Several days of record breaking heat affected central and southeast Illinois from September 20-26. The table below lists record highs along with the observed high temperatures for selected cities. Records set this year are highlighted in red.
Note the observation time for the 24-hour high temperature listed for each location. Readings for Charleston, Danville, Decatur, Effingham, Galesburg, Jacksonville, Normal, Olney, and Urbana are provided by NWS Cooperative Weather Observers. The official measurement sites for Peoria and Springfield are at each airport. Lincoln's temperatures are measured at the NWS Office.
| 9/20 | 9/21 | 9/22 | 9/23 | 9/24 | 9/25 | 9/26 | ||
| Charleston 7 pm |
Record |
93 95 |
95 96 |
95 M |
93 M |
93 96 |
91 M |
92 95 |
|
Danville |
Record |
95 92 |
97 93 |
93 93 |
91 93 |
92 93 |
94 92 |
91 91 |
| Decatur midnight |
Record 2017 |
96 90 |
95 93 |
94 93 |
92 92 |
93 90 |
91 90 |
96 90 |
| Effingham 7 am |
Record 2017 |
96 89 |
96 96 |
96 97 |
95 98 |
95 95 |
92 97 |
93 94 |
|
Galesburg |
Record 2017 |
91 80 |
90 92 |
92 91 |
89 92 |
90 92 |
90 90 |
92 89 |
| Jacksonville 7 am |
Record 2017 |
96 87 |
95 96 |
96 89 |
94 96 |
94 94 |
93 94 |
97 M |
|
Lincoln |
Record 2017 |
94 92 |
94 94 |
94 94 |
92 93 |
93 91 |
92 92 |
91 91 |
| Normal 5 am |
Record 2017 |
95 85 |
94 93 |
94 90 |
92 95 |
94 93 |
93 92 |
93 92 |
| Olney 7 am |
Record 2017 |
100 86 |
100 92 |
96 93 |
94 93 |
94 90 |
92 92 |
94 M |
| Peoria midnight |
Record 2017 |
94 94 |
93 91 |
93 94 |
92 93 |
91 91 |
92 92 |
93 91 |
| Springfield midnight |
Record 2017 |
96 96 |
96 95 |
95 96 |
93 95 |
93 94 |
94 94 |
92 94 |
| Urbana midnight |
Record 2017 |
94 95 |
95 95 |
95 95 |
94 94 |
94 93 |
96 91 |
94 93 |
Other September Records:
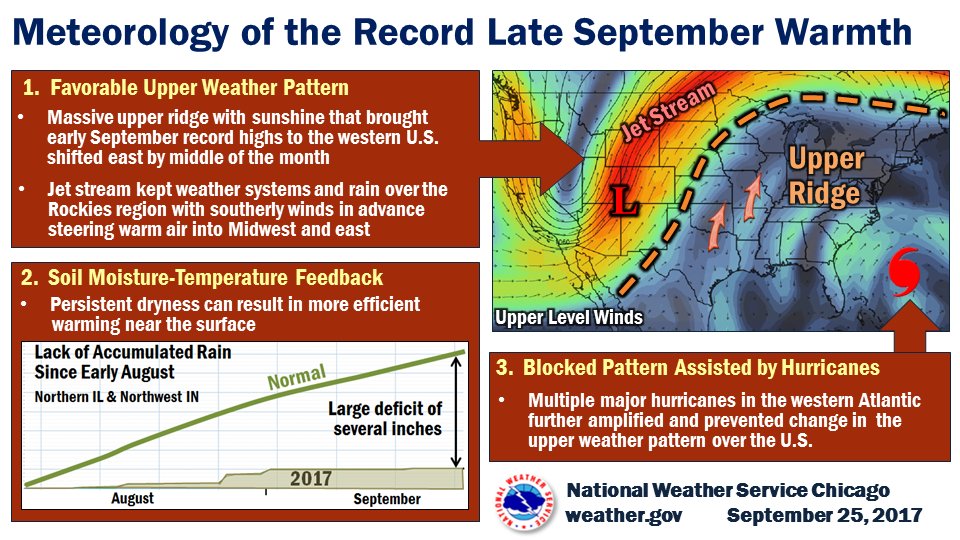
Why have conditions been so warm? NWS Chicago provides the explanation in this graphic: