Key Points:
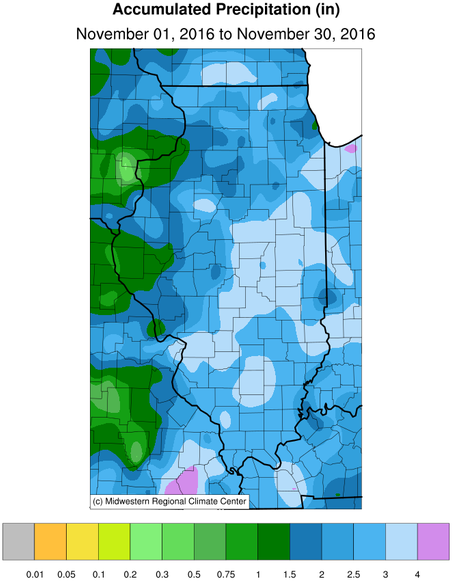
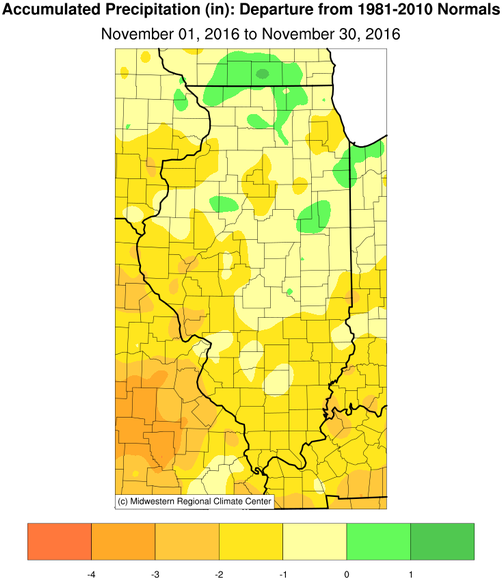
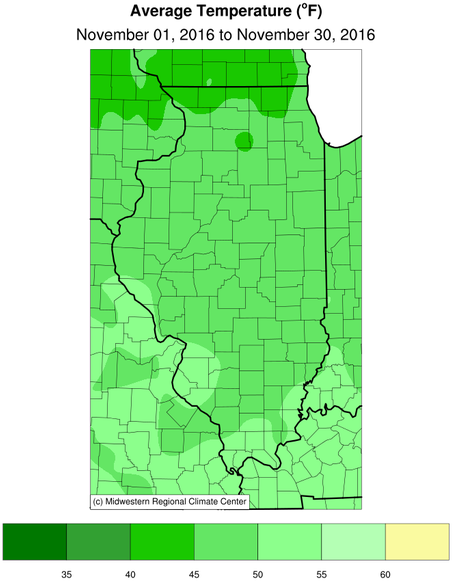
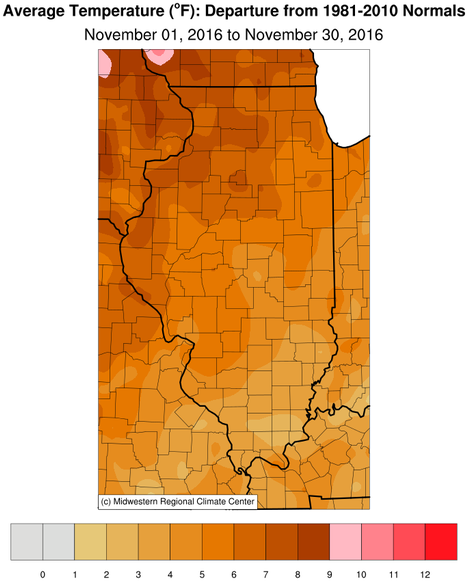
Rainfall and Temperature Maps
Climate Data
The table below summarizes November rainfall and temperature, and departure from normal for selected cities across central and southeast Illinois.
| Location | Rainfall | vs. Normal |
Average Temp. |
vs. Normal |
Notes |
|---|---|---|---|---|---|
| Charleston | 2.43" | -1.54" | 50.8 | +6.4 | 4th warmest November since 1896 |
| Danville | 3.85" | +0.02" | 47.7 | +4.3 | 7th warmest November since 1895 |
| Decatur | 3.74" | +0.03" | 47.6 | +3.8 | 8th warmest November since 1893 |
| Effingham | 2.81" | N/A | 49.5 | N/A | |
| Flora | 2.92" | -1.21" | 48.6 | +3.8 | |
| Galesburg | 2.16" | -0.71" | 45.5 | +6.4 | 6th warmest November since 1895 |
| Havana | 3.24" | +0.00 | N/A | N/A | |
| Jacksonville | 2.67" | -0.95" | 47.3 | +4.8 | 9th warmest November since 1895 |
| Lincoln | 2.91" | -0.34" | 46.8 | +4.7 | 7th warmest November since 1906 |
| Normal | 3.22" | -0.05" | 46.2 | +5.7 | 10th warmest November since 1893 |
| Olney | 2.84" | -1.64" | 48.1 | +3.6 | |
| Paris | 2.69" | -1.09" | 47.0 | +4.2 | |
| Peoria | 2.52" | -0.61" | 47.7 | +6.1 | 6th warmest November since 1883 |
| Springfield | 2.14" | -1.07" | 49.4 | +6.3 | 4th warmest November since 1879 |
| Tuscola | 3.10" | -0.75" | 47.4 | +5.7 | 6th warmest November since 1893 |
| Urbana | 4.03" | +0.35" | 46.8 | +5.5 | 8th warmest November since 1888 |
The following links are to the monthly climate summaries for area cities. Only the summaries for Peoria, Springfield, and Lincoln are considered "official", meaning they are the station of record for their respective locations. The other summaries are "supplemental", meaning another location in the area is the official climate station for the city.
Climate data for other cities is available at https://www.weather.gov/climate/xmacis.php?wfo=ilx
Rainfall and Temperature Maps
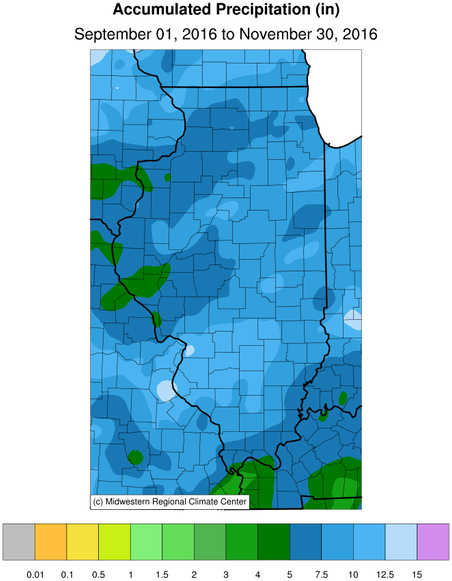
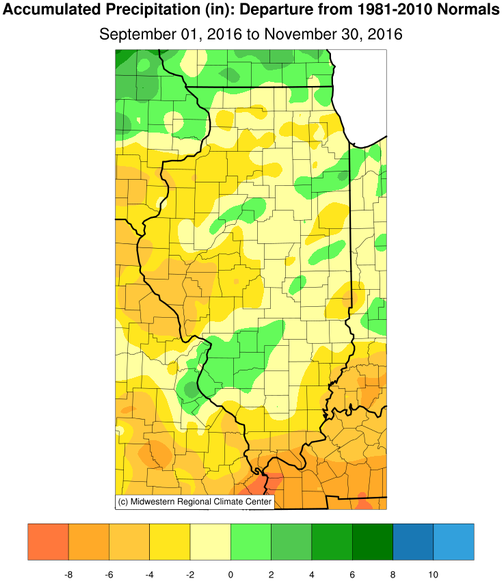
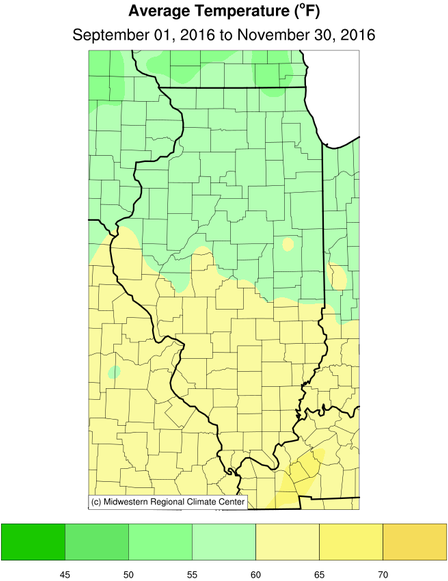
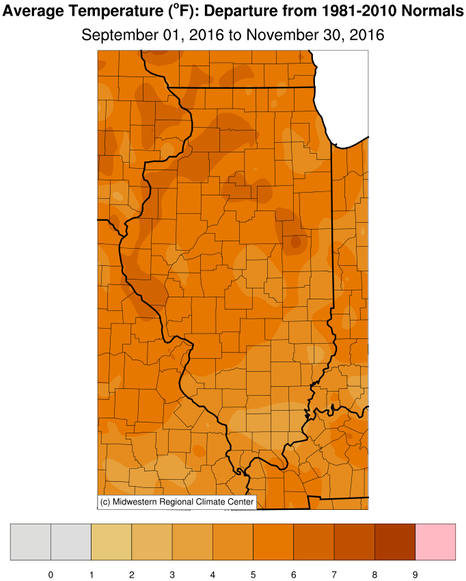
Climate Data
The table below summarizes seasonal rainfall and temperature, and departure from normal for selected cities across central and southeast Illinois.
| Location | Rainfall | vs. Normal |
Average Temp. |
vs. Normal |
Notes |
|---|---|---|---|---|---|
| Charleston | 10.18" | -0.79" | 61.5 | +3.8 | 2nd warmest Fall since 1896 |
| Danville | 10.50" | +0.17 | 59.7 | +4.7 | 2nd warmest Fall since 1895 |
| Decatur | 9.31" | -0.79" | 60.0 | +3.1 | 4th warmest Fall since 1893 |
| Effingham | 9.90" | N/A | 61.5 | N/A | 2nd warmest Fall since 1892 |
| Flora | 10.27" | -0.67" | 60.8 | +4.8 | 2nd warmest Fall since 1893 |
| Galesburg | 5.72" | -3.37" | 57.8 | +5.7 | 2nd warmest Fall since 1895 |
| Havana | 9.22" | -0.21" | N/A | N/A | |
| Jacksonville | 5.86" | -4.30" | 58.8 | +4.7 | 5th warmest Fall since 1895 |
| Lincoln | 8.98" | -0.56" | 59.1 | +5.2 | 3rd warmest Fall since 1905 |
| Normal | 7.91" | -1.78" | 58.2 | +5.3 | 4th warmest Fall since 1893 |
| Olney | 9.24" | -2.30" | 60.3 | +4.1 | 8th warmest Fall since 1890 |
| Paris | 8.54" | -1.80" | 59.0 | +4.3 | 6th warmest Fall since 1893 |
| Peoria | 11.01" | +1.89" | 59.6 | +5.7 | 3rd warmest Fall since 1883 |
| Springfield | 6.01" | -3.25" | 61.4 | +6.4 | 2nd warmest Fall since 1879 |
| Tuscola | 10.24" | +0.13" | 59.4 | +5.2 | 2nd warmest Fall since 1893 |
| Urbana | 11.30" | +1.23" | 59.4 | +5.6 | 2nd warmest Fall since 1888 |
The following links are to the seasonal climate summaries for area cities. Only the summaries for Peoria, Springfield, and Lincoln are considered "official", meaning they are the station of record for their respective locations. The other summaries are "supplemental", meaning another location in the area is the official climate station for the city.
Climate data for other cities is available at https://www.weather.gov/climate/xmacis.php?wfo=ilx

