Overview
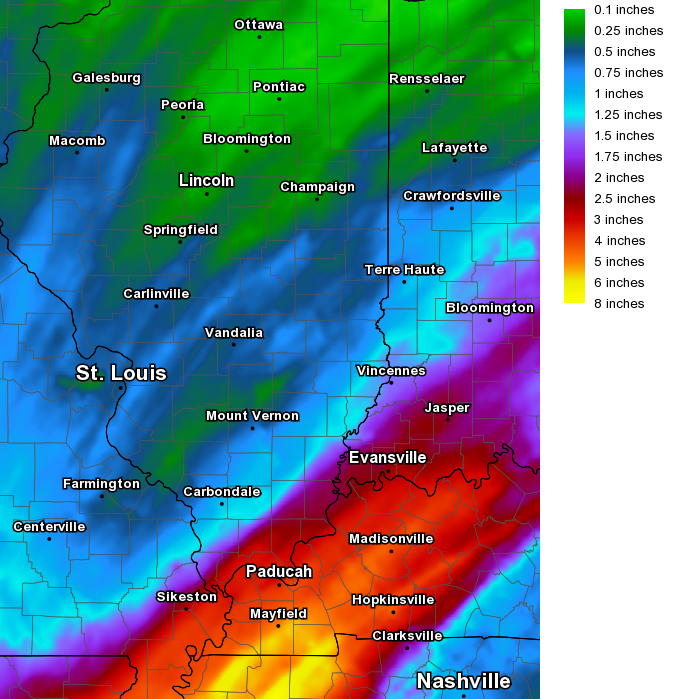
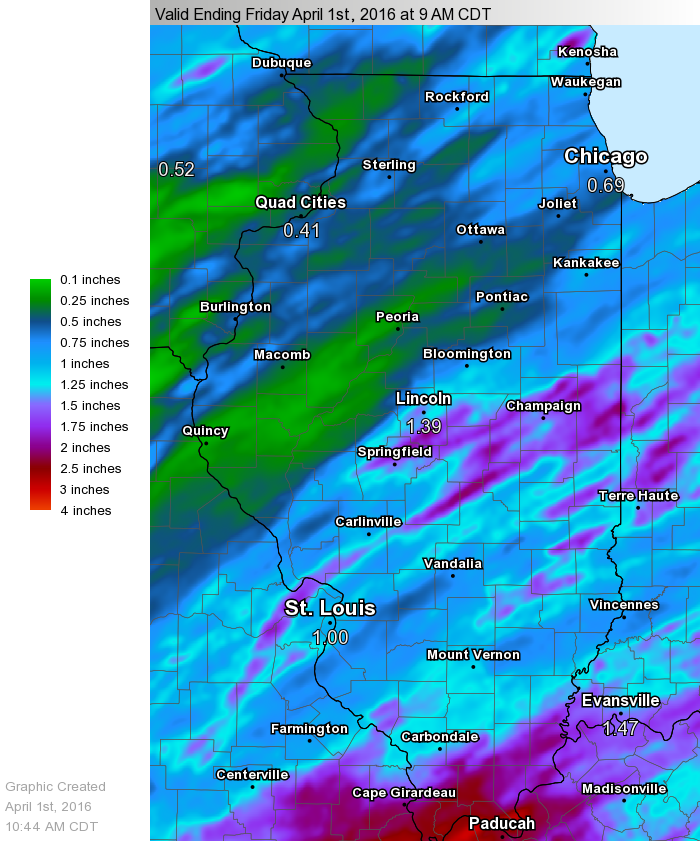
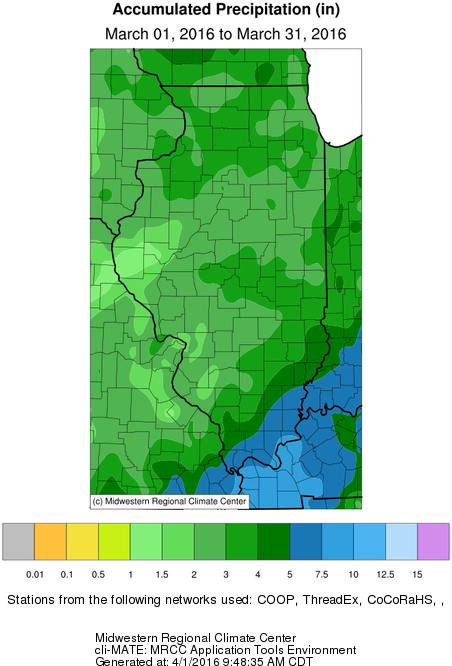
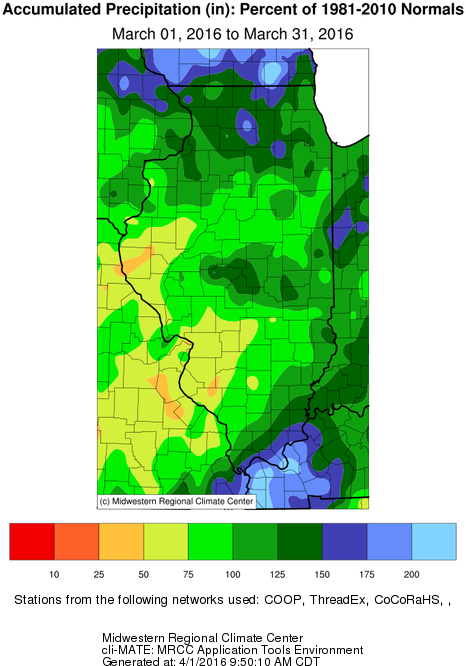
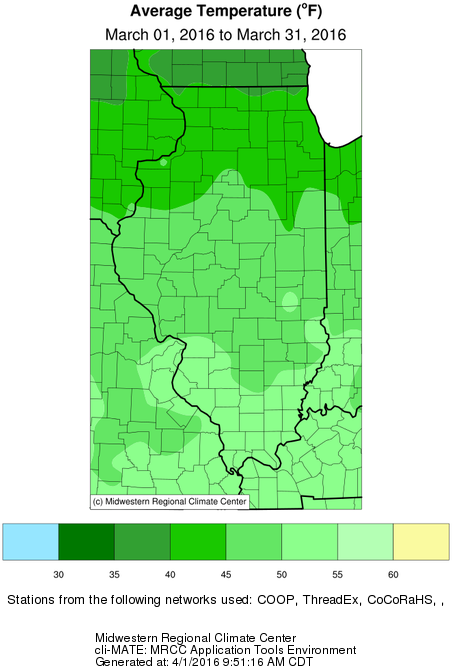
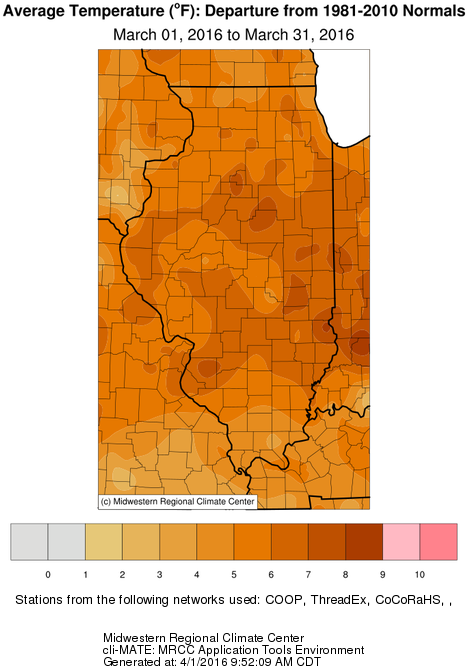
March featured much above normal temperatures across all of central and southeast Illinois. The mean temperature for the month was 5-8 degrees above normal, which put many sites in or near their top 10 warmest. This caused the growing season to start a few weeks earlier than normal and put caused some vegetation to be susceptible to freeze damage by the end of the month. Due to the warm temperatures, precipitation fell as rain, except for some flurries and light snow that affected the area on the 1st. Rainfall was well above normal for most of central and eastern Illinois, while near to slightly below normal for the western part of the state. Heavy rain affected the region on the 7th-10th, and again on the 30th-31st. The first organized severe weather event of the spring affected western Illinois on the 15th, when four tornadoes touched down.
Significant Events
March Precipitation and Temperature Maps
March Climate Data
The table below summarizes March precipitation, snowfall, and temperature, and departure from normal for selected cities across central and southeast Illinois. Data from Peoria and Springfield are from ASOS sites, while others are from NWS Cooperative Observers.
| Site |
Precipitation |
Departure from Normal | Average Temperature |
Departure from Normal |
|
Charleston |
3.87" | +0.98" | 51.9 | +8.9 |
| Danville |
5.53" |
+1.51" | 48.9 | +6.9 |
| Decatur |
3.29" |
+0.70" | 47.7 | +5.0 |
| Effingham |
2.51" |
NA | 49.0 | NA |
|
Flora |
3.41" | +0.51" | 50.0 | +6.5 |
| Galesburg |
3.40" |
+0.64" | 43.4 | +5.4 |
|
Havana |
2.33" | -0.48" | NA | NA |
|
Jacksonville |
2.57" | -0.15" | 48.4 | +7.7 |
| Lincoln |
3.83" |
+1.23" | 47.0 | +5.9 |
|
Normal |
2.91" |
+0.20" | 45.6 | +7.4 |
|
Olney |
3.65" | +0.69" | 48.9 | +6.0 |
|
Paris |
3.12" | +0.22" | 46.9 | +6.0 |
| Peoria |
2.32" |
-0.48" | 47.1 | +6.5 |
| Springfield |
5.59" |
+2.96" | 49.8 | +7.7 |
|
Tuscola |
4.03" | +1.22" | 47.3 | +7.0 |
| Urbana |
3.51" |
+0.65" | 47.5 | +7.5 |
Links below are the monthly climate summaries for area cities. Only the summaries for Peoria, Springfield and Lincoln are considered "official", meaning they are the station of record for their respective locations. The other summaries are "supplemental", meaning another location in the area is the official climate station for that city.
Climate data for other area cities is available at http://www.nws.noaa.gov/climate/xmacis.php?wfo=ilx

