July Precipitation Highlights:
- Monthly rainfall was near or above normal over large portions of central IL, and well above normal over southeast IL. Though there were pockets of below normal precipitation over parts of central IL, like the Canton, Decatur, Lincoln, Taylorville and Tuscola areas which were 1 to 2 inches below normal. On the other end of the spectrum, Flora and Clay City in Clay County had 10.5 and 11 inches of rain respectively, which was 6.25 to 6.5 inches above normal. There were a few periods of flooding rains and severe weather during July over central and southeast IL. The most active weather period during the month was from July 9-16th including some brief tornadoes on July 9th, 10th and 12th. There were also two brief tornadoes in southeast IL on Thursday evening July 29th.
July Temperature Highlights:
- Monthly average temperatures averaged about 1 degree below normal across most of central and southeast IL. A record cool high of 71 was tied at Peoria on July 11th, while Springfield set a record cool high of 68 on July 31st. Smoke from western wildfires in the Rockies was prevalent across the IL skies during July and may have tempered high temperatures as not many days reached 90 or higher during the month with the Champaign and Mattoon airports only getting as warm as 89 degrees. Much of central IL had lows in the mid to upper 50s July 1-3rd and July 31st. Saturday July 24th was one of the hotter days in the month over central IL with highs in the lower 90s over much of the area. High humidity prevailed through the month despite not many days in the 90s. The summer season's 2nd heat advisory was issued for much of central and southeast IL Wednesday afternoon through early Thursday evening July 28-29th.
Climate Statistics July 2021:
|
Site
|
Precipitation
|
Departure from Normal |
Average Temperature
|
Departure from Normal |
|
Charleston
|
7.90" |
+3.50" |
77.0 |
-0.2 |
|
Canton
|
3.06" |
-1.07" |
N/A |
N/A |
| Danville |
6.57" |
+2.23" |
74.3 |
-0.8
|
| Decatur |
2.73" |
-1.27" |
74.4 |
-1.2
|
| Effingham |
8.12"
|
+3.75" |
N/A |
N/A |
|
Flora
|
10.47" |
+6.28" |
77.0 |
-0.4 |
| Galesburg |
5.10" |
+1.06" |
74.2 |
-0.5
|
|
Morton
|
3.81" |
-0.29 |
N/A |
N/A |
|
Jacksonville
|
3.75" |
-0.22" |
75.1 |
-1.0 |
|
Lincoln
|
3.94" |
-0.97" |
73.5 |
-1.1 |
|
Normal
|
4.16" |
+0.04" |
73.7 |
-0.8 |
|
Olney
|
7.46" |
+2.50" |
75.7 |
-0.5 |
|
Paris
|
4.28" |
+0.45" |
73.7 |
-0.4 |
|
Peoria
|
4.07" |
"+0.54 |
75.4 |
-0.9 |
| Springfield |
5.15"
|
+1.30" |
75.0 |
-1.5 |
|
Taylorville
|
2.62" |
-0.69" |
74.0 |
N/A |
|
Tuscola
|
2.24" |
-2.14" |
76.5 |
+1.4 |
| Urbana |
4.54" |
+0.05" |
74.2 |
-1.0
|
The following links are the monthly climate summaries for area cities. Only the summaries for Peoria, Springfield, and Lincoln are considered "official", meaning they are the station of record for their respective locations. The other summaries are "supplemental", meaning another location in the area is the official climate station for the city.
- Peoria -- Peoria International Airport
- Springfield -- Abraham Lincoln Capital Airport
- Lincoln -- National Weather Service Office
- Champaign -- University of Illinois-Willard Airport
- Decatur -- Decatur Airport
- Lawrenceville -- Lawrenceville-Vincennes International Airport
- Mattoon -- Coles County Memorial Airport
Climate data for other cities is available at http://w2.weather.gov/climate/xmacis.php?wfo=ilx
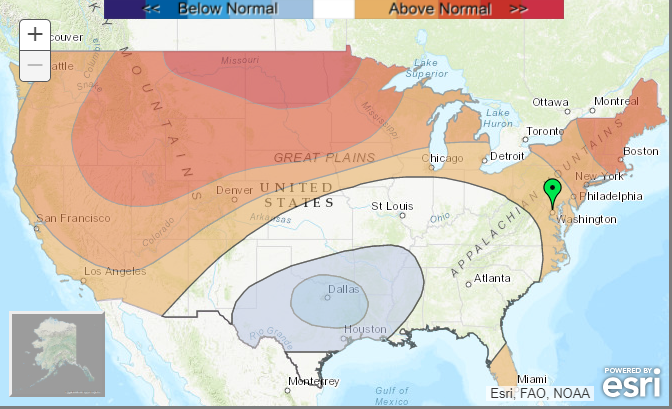
August Look Ahead:
- Official outlooks from NOAA's Climate Predication center show near normal temperatures favored for central & southern IL,
and a trend towards near normal rainfall in central IL and trending toward above normal rainfall in southeast IL.
---------------------------------------------------------------------------------------------------------------------------------------------------------
Climate data for other area cities is available at http://w2.weather.gov/climate/xmacis.php?wfo=ilx


