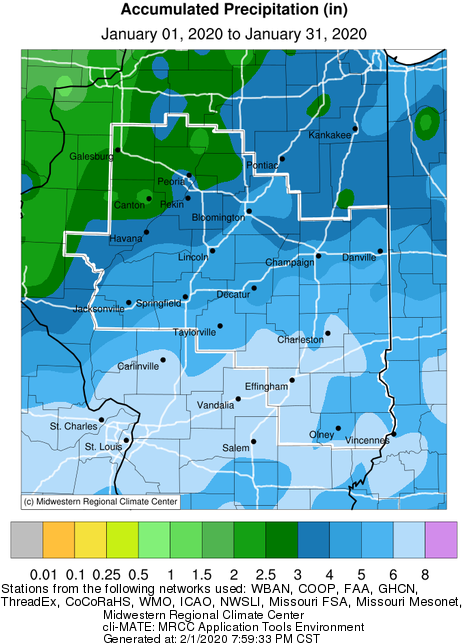
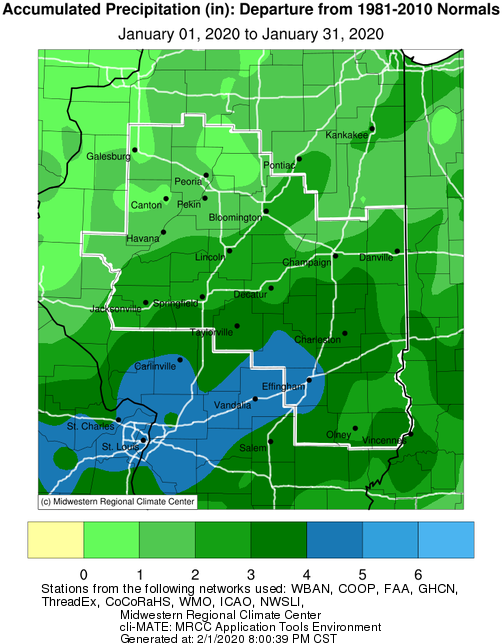
January 2020 Precipitation Highlights:
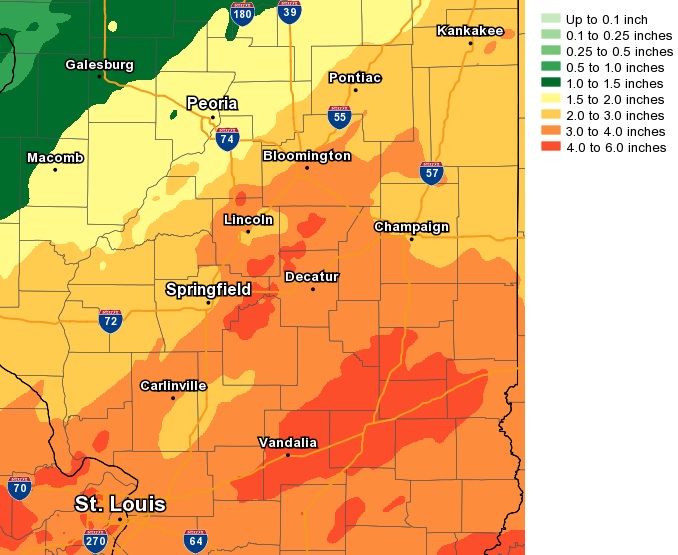
- Liquid equivalent precipitation was well above normal across central and southeast IL. Monthly totals of 3-6.5 inches were common along and southeast of the IL river, with the highest amounts south of I-72 where locally 6.5 to 8 inches of precipitation occurred. A couple inches of precipitation fell on Jan 10-11th with thunderstorms east of the IL river. Below is the precipitation map from Jan 10-12th with near 5 inches of precipitation in Effingham county. Another 1.5 inches of precipitation fell in southeast IL by Lawrenceville from Jan 17-18th.
- Springfield, IL had its 10th wettest January on record with 4.49 inches of precipitation, narrowly beating the 4.48 inches in Jan 1982 to reach the top 10 list.
- Here is a summary of the Jan 10-12th heavy precipitation event from forecaster Matt Barnes. A slow-moving storm system brought several waves of precipitation to central Illinois over the past couple of days. The first significant wave arrived during the evening of Friday, January 10th when a band of heavy rain with a few embedded thunderstorms developed in the Illinois River Valley. The band gradually shifted eastward overnight, with sleet and snow mixing with the rain west of the Illinois River toward dawn Saturday. After a lull in the steady/heavy precipitation from late morning through mid-afternoon, a final wave arrived late Saturday afternoon and evening. As colder air wrapped into the departing system, a mixture of freezing rain, sleet, and snow occurred, with most of the wintry precipitation focusing along and west of the I-55 corridor.
Rainfall totals with this winter storm system were impressive...with all locations east of a Pontiac, Illinois to Kirksville, Missouri line picking up in excess of 2 inches. The heaviest amounts were focused from Vandalia northeastward through Effingham and Charleston-Mattoon where greater than 4 inches was reported. The highest rainfall total observed within the SWOP network was a whopping 4.95 in Watson in Effingham County.
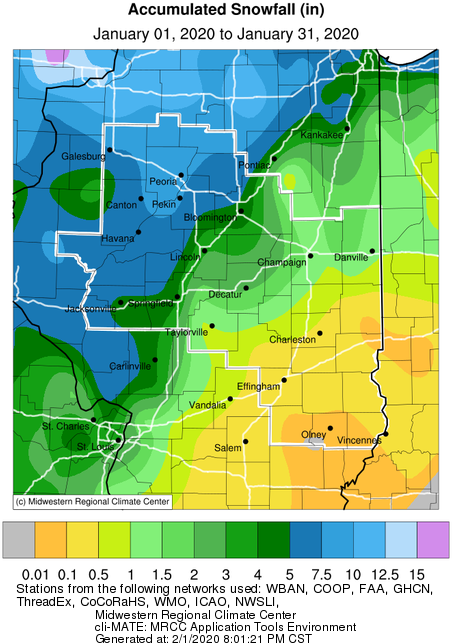
Snowfall was less impressive, as enough warm air was entrained into the system to keep the precipitation in the form of rain longer than originally anticipated. As a result, snow amounts were generally in the 1 to 2 inch range along and west of a Champaign to Shelbyville line...with totals of around 3 inches across western Mason County and portions of Sangamon County. The highest SWOP snowfall measurement was 2.5 inches in Chatham in Sangamon County.
 |
 |
Jan 10-12, 2020 Precipitation in Central IL
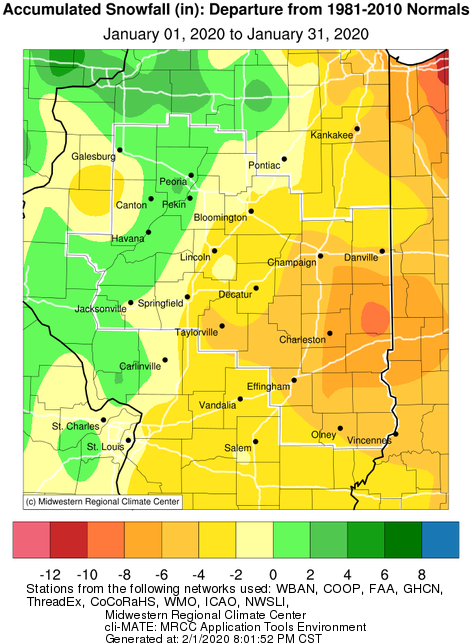
January 2020 Snowfall Highlights:
- Snowfall was below normal east of the IL river valley during January 2020 and near to a bit above normal over the IL river valley. Peoria had 10 inches of snow during January and was one of the few central IL cities that had above normal snowfall. Nearly half of the snowfall (4.7 inches) fell from Jan 23-25th. Areas along and south of a Taylorville to Paris line had less than 1 inch of snow during the entire month with some cities only getting a trace or less.
-
In addition to the snow, much of central IL north of I-70 had between a tenth and a quarter inch of ice from several hours of freezing rain on late Friday afternoon and Friday evening Jan 17th, causing numerous traffic accidents.
-
Dense fog occurred a few times during this wet month, and was especially widespread on Tuesday night Jan 14-15th and on Friday Jan 24th when dense fog advisories were issued.
-
A wind advisory was issued for much of central IL on Thursday afternoon Jan 9th with southerly winds gusting 40-45 mph.
 |
 |
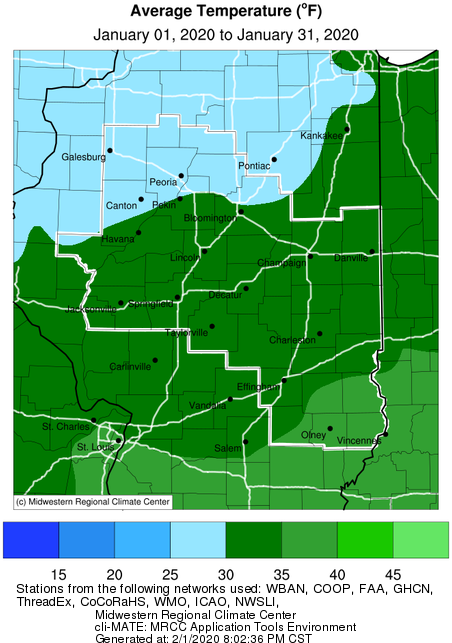
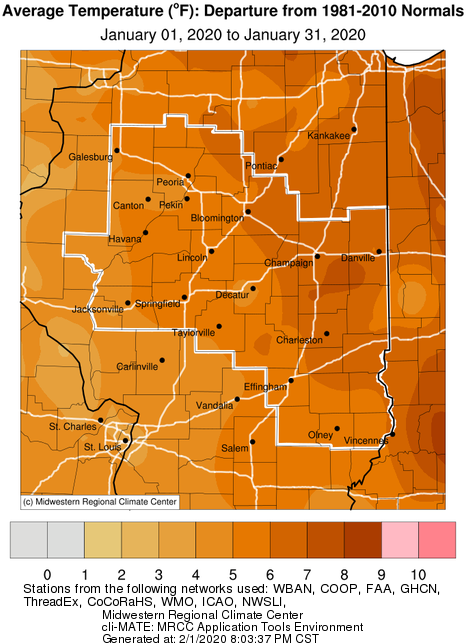
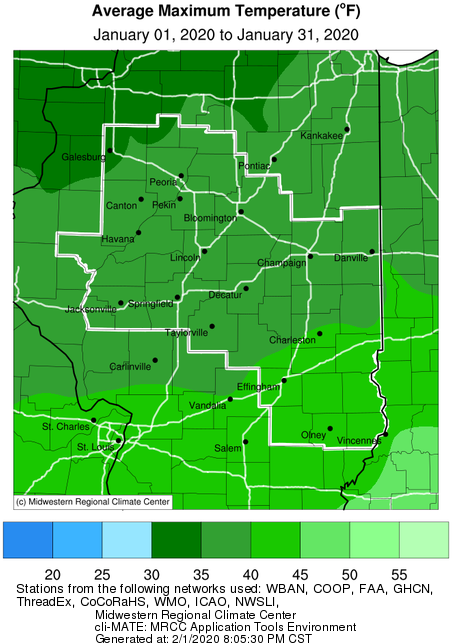
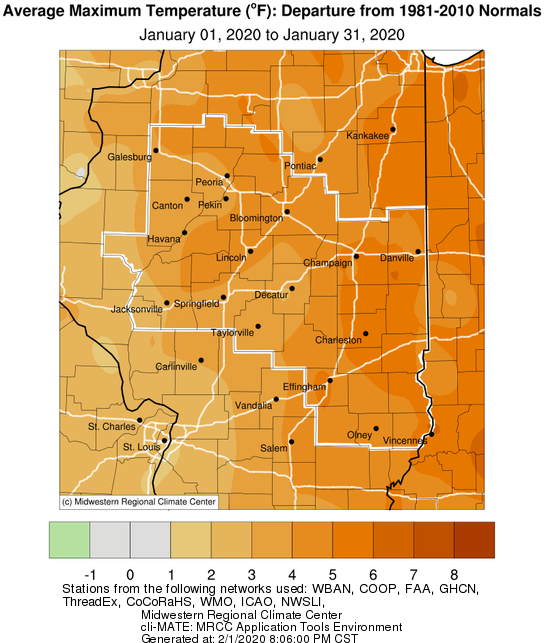
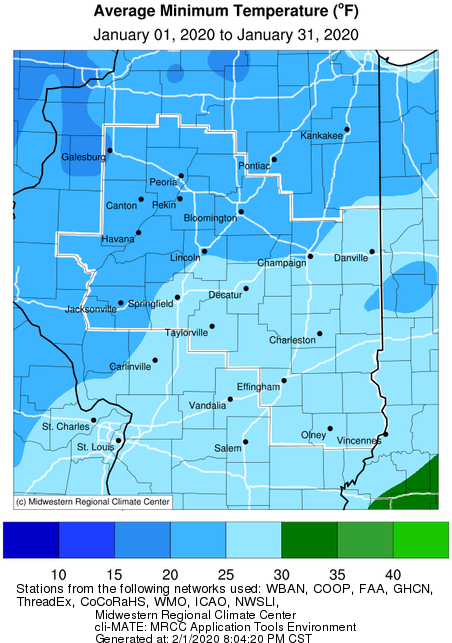
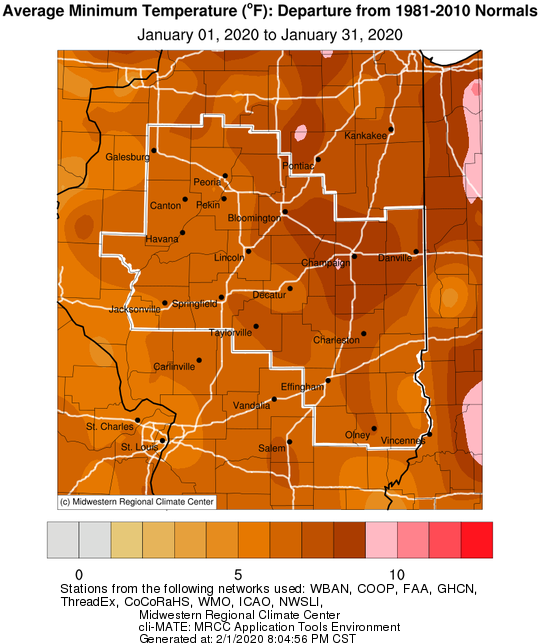
January 2020 Temperature Highlights:
- Similar to December 2019, January 2020 temperatures were well above normal across the entire area, ranging from 4 to 7 degrees above normal for central and southeast IL. Sunday Jan 19 was the coldest day of the month, and coldest day since March 4th 2019, with highs 10-15 and lows of zero to 5 above over much of central IL. Jan 16-21st was a 6 day period with below normal temperatures, while the rest of the month had above normal temperatures. Jan 9-11th was the mildest stretch of weather during the month, with highs in the mid to upper 50s over much of the area. Springfield and Lincoln had mild lows of 50 degrees on Jan 10th, and Lincoln set a record warm low temperature on this day.
January 2020 Climate Statistics:
|
City
|
Precipitation
|
Departure from Normal |
Snow |
Departure
from
Normal
|
Average Temperature
|
Departure from Normal |
|
Charleston
|
7.70" |
+5.21" |
T |
-7.5" |
34.5 |
+6.1 |
|
Clinton
|
5.29" |
+3.23" |
3.2" |
-2.7" |
N/A |
N/A |
| Danville |
5.77"
|
+3.52" |
N/A |
N/A |
33.0 |
+5.9 |
|
Decatur
|
5.02" |
+2.88" |
1.5" |
-3.3" |
32.3 |
+4.8 |
|
Effingham
|
6.61" |
+3.72" |
0.2" |
-4.3" |
33.8 |
+5.8 |
|
Flora
|
6.56" |
+3.52" |
T |
-4.0" |
35.1 |
+5.6 |
|
Galesburg
|
2.58" |
+1.07" |
5.5" |
-2.3" |
26.6 |
+4.7 |
|
Havana
|
3.51" |
+1.43" |
7.4" |
-0.8" |
N/A |
N/A |
|
Jacksonville
|
4.26" |
+2.67" |
4.2" |
-0.3" |
31.7 |
+5.3 |
|
Lincoln
|
4.28" |
+2.35" |
2.8" |
-3.1" |
31.7 |
+5.8 |
|
Mattoon
|
6.53" |
+4.27" |
0.5" |
-5.3" |
N/A |
N/A |
|
Minonk
|
3.09" |
+1.17" |
9.0" |
+3.6" |
29.8 |
+6.6 |
|
Morton
|
2.95" |
+0.98" |
6.4" |
-0.7" |
N/A |
N/A |
|
Normal
|
3.68"
|
+1.55" |
4.3" |
-2.8" |
29.5 |
+5.6 |
|
Olney
|
6.06" |
+3.01" |
0.0" |
-4.0" |
34.9 |
+5.8 |
|
Paris
|
4.96" |
+2.57" |
0.0" |
-8.9" |
32.0 |
+5.8 |
|
Peoria
|
3.44" |
+1.66" |
10.0" |
+5.0" |
29.7 |
+4.8 |
| Springfield |
4.49"
|
+2.67" |
4.6" |
-1.8" |
32.2 |
+5.5 |
|
Taylorville
|
6.71" |
+4.61" |
0.3" |
N/A |
32.0 |
M |
|
Tuscola
|
5.72" |
+3.62" |
1.0" |
-5.1" |
32.3 |
+7.1 |
|
Urbana
|
5.23" |
+3.18" |
1.9" |
-4.9" |
31.5 |
+6.7 |
The following links are the monthly climate summaries for area cities. Only the summaries for Peoria, Springfield, and Lincoln are considered "official", meaning they are the station of record for their respective locations. The other summaries are "supplemental", meaning another location in the area is the official climate station for the city.
- Peoria -- Peoria International Airport
- Springfield -- Abraham Lincoln Capital Airport
- Lincoln -- National Weather Service Office
- Champaign -- University of Illinois-Willard Airport
- Decatur -- Decatur Airport
- Lawrenceville -- Lawrenceville-Vincennes International Airport
- Mattoon -- Coles County Memorial Airport
Climate data for other cities is available at http://w2.weather.gov/climate/xmacis.php?wfo=ilx
February 2020 Look Ahead:
- Official outlooks from NOAA's Climate Predication center show equal chances of above or below normal precipitation (no trend favored) for central and southeast IL in Feb 2020. Temperature outlooks show equal chances of above or below normal (no trend favored) for the northwest half of IL, with above normal favored for the southeast half of the state in Feb 2020.