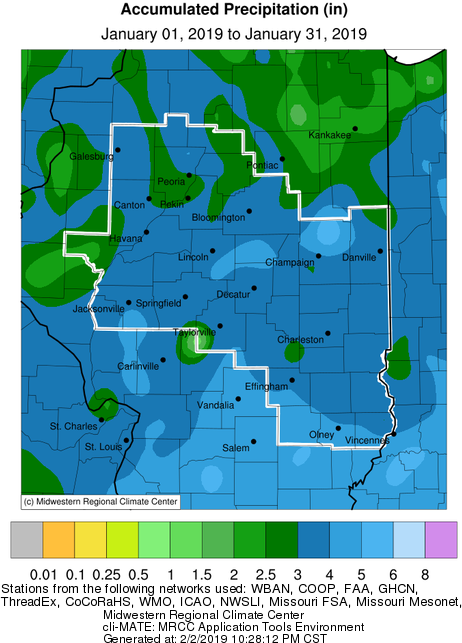
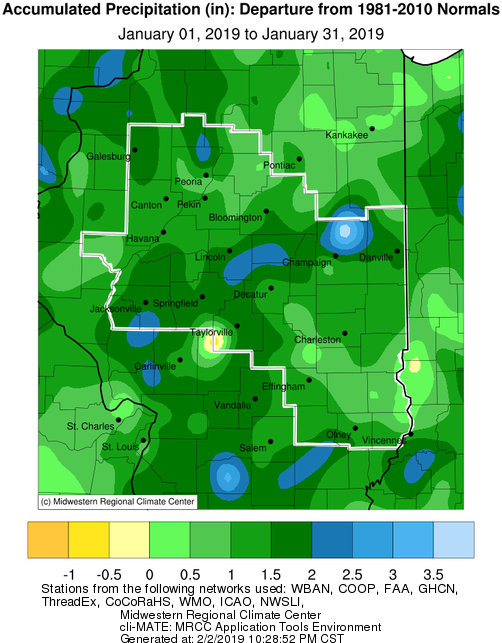
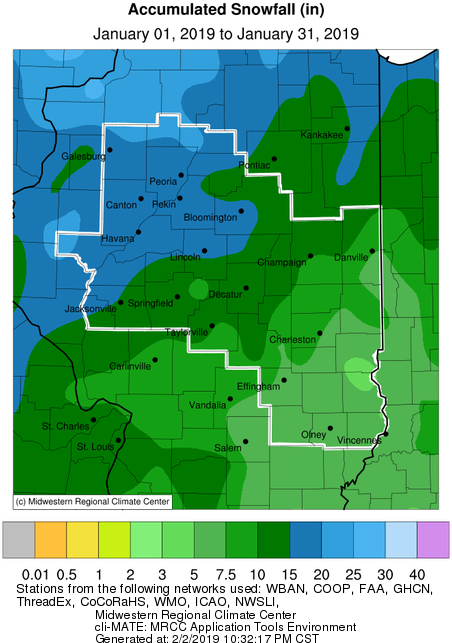
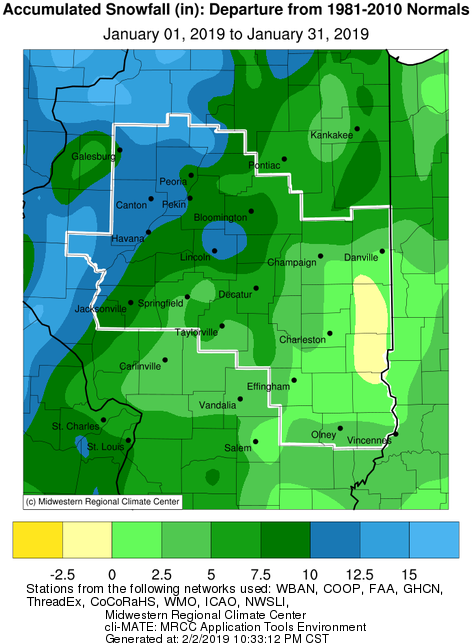
January Precipitation Highlights:
- An active storm track through the central U.S. brought much above normal precipitation to central and southeast IL this month. Monthly totals were 3-4" in many areas, which was 1-2" above normal. As far as snowfall was concerned, totals ranged from 6-8" south of I-70, to 15-20" northwest of I-55. This resulted in near to slightly above normal snowfall for eastern IL, and amounts as much as 1 foot above normal for parts of central and western IL. Peoria set their 5th snowiest January with 17.9", while Lincoln was 2nd snowiest with 19.1".
- The most significant snowstorm of the month occurred on the 11th-13th. This system brought amounts in excess of 8 inches along and west of a Bloomington to Shelbyville line, and greater than 12 inches from just west of Lincoln and Springfield westward to the Mississippi River. Another strong system on the 19th produced 2-6" snowfall accumulations north of I-72, along with 30-40 mph wind gusts. Farther south, rain totals exceeded a half inch south of I-70.
 |
 |
 |
 |
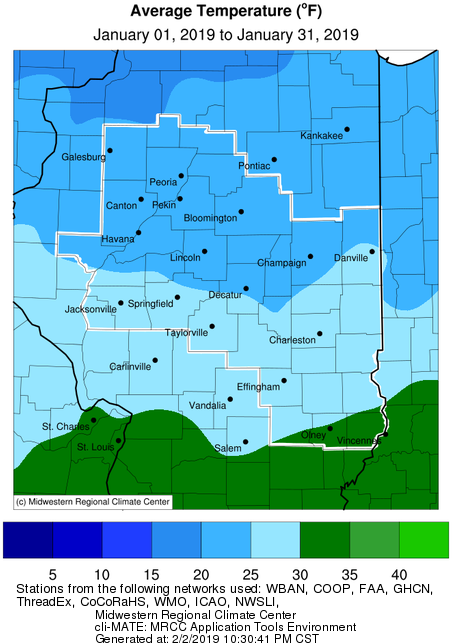
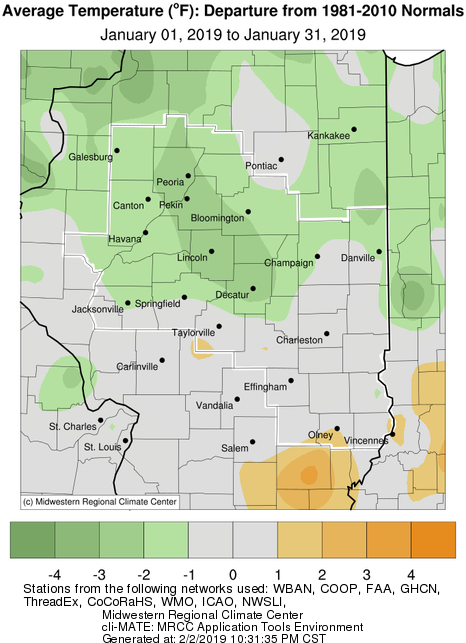
January Temperature Highlights:
- January saw a roller coaster ride in temperatures, starting out with much above normal readings for the first 8 days the month, and ending the month with record cold. The result was monthly average temperatures near normal south of I-72, and 1-3 degree below normal readings farther north. Extreme cold affected the region on the 29th-31st, when numerous daily record low temperatures and record cold high temperatures were set. Blustery winds accompanied the arctic air, with wind chills dropping as low as -53 F in Bloomington on the morning of the 30th. This was the lowest wind chill ever observed at Bloomington. Much of central to western IL spent 30-40 consecutive hours below zero during the heart of the cold.
Climate Statistics:
|
Site
|
Precipitation
|
Departure from Normal |
Snowfall |
Departure
from
Normal
|
Average Temperature
|
Departure from Normal |
|
Charleston
|
3.48" |
+0.99" |
7.5" |
0.0 |
27.8 |
-0.6 |
| Danville |
2.87"
|
+0.66" |
6.5" |
+1.7" |
25.7 |
-1.4 |
| Decatur |
3.08" |
+0.94" |
5.9" |
+1.1" |
24.9 |
-2.6 |
| Effingham |
3.88"
|
+0.99" |
7.8" |
+3.3" |
28.7 |
+0.7 |
|
Flora
|
4.21" |
+1.17" |
6.5" |
M |
29.8 |
+0.3 |
| Galesburg |
2.90"
|
+1.39" |
19.5" |
+11.7" |
20.5 |
-1.4 |
|
Havana
|
2.11" |
+0.03" |
M |
M |
M |
M |
|
Jacksonville
|
3.62" |
+1.58" |
15.0" |
+10.5" |
25.7 |
-1.2 |
| Lincoln |
3.21" |
+1.28" |
19.1" |
+13.2" |
23.0 |
-2.9 |
|
Normal
|
3.47"
|
+1.34" |
19.0" |
+11.9" |
22.4 |
-1.5 |
|
Olney
|
4.66" |
+1.61" |
7.3" |
+3.3" |
30.3 |
+1.2 |
|
Paris
|
3.96" |
+1.57" |
8.0" |
-0.9" |
25.6 |
-0.6 |
| Peoria |
2.65" |
+0.77" |
17.9" |
+11.0" |
22.5 |
-2.4 |
| Springfield |
2.94"
|
+1.12" |
12.3" |
+5.9" |
25.3 |
-1.4 |
|
Tuscola
|
3.81" |
+1.71" |
9.7" |
+3.6" |
25.4 |
+0.2 |
| Urbana |
3.88"
|
+1.83" |
9.8" |
+3.0" |
23.9 |
-0.9 |
The following links are the monthly and seasonal climate summaries for area cities. Only the summaries for Peoria, Springfield, and Lincoln are considered "official", meaning they are the station of record for their respective locations. The other summaries are "supplemental", meaning another location in the area is the official climate station for the city.
Climate data for other cities is available at http://w2.weather.gov/climate/xmacis.php?wfo=ilx