
Heavy rainfall is expected to continue through Thursday over New Mexico into far west Texas. Flash flooding and debris flows in wildfire burn areas will be possible. Heavy rain and flash flooding is also expected over the southern Appalachians and Ohio Valley. Tropical Depression 15-E, southeast of Hawaii, is expected to bring heavy rain beginning today to the Big Island and Maui. Read More >
Overview
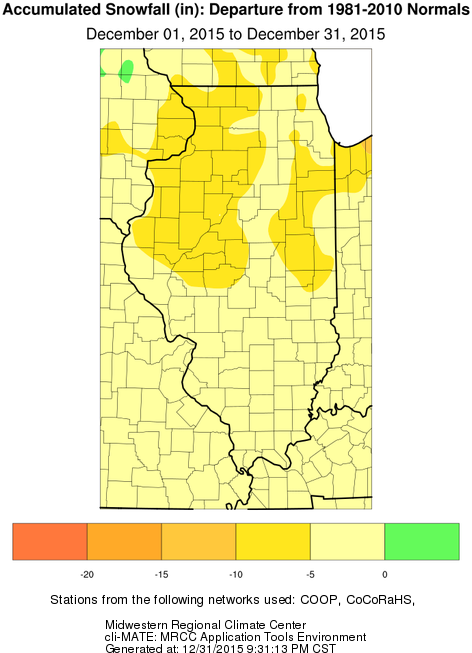
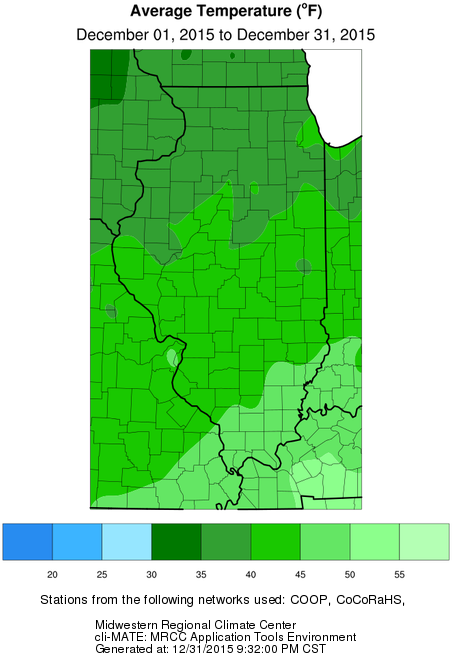
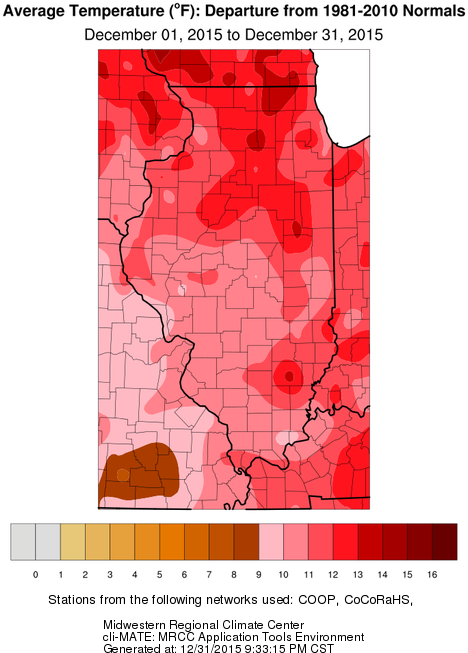
December was an active weather month for central and southeast Illinois, and resulted in record to near record warm temperatures and precipitation. Many days featured spring-like conditions, and temperatures were more typical for March. Arctic air remained locked up well to the north, as westerly to southwesterly flow prevailed across the Midwest. Little to no snow fell over the region, setting a record for the least snowy December for some locations.
Two significant weather events impacted the area. On the 23rd severe weather and locally heavy rainfall was observed as strong low pressure tracked across the Midwest. On the 26th-28th, heavy rains brought significant flash flooding and river flooding to central and southern Illinois, and as colder air filtered in on the north side of the system, an ice storm affected northern portions of central Illinois on the 28th. All of this activity produced monthly precipitation of 2 to 4 times normal.
Major Events
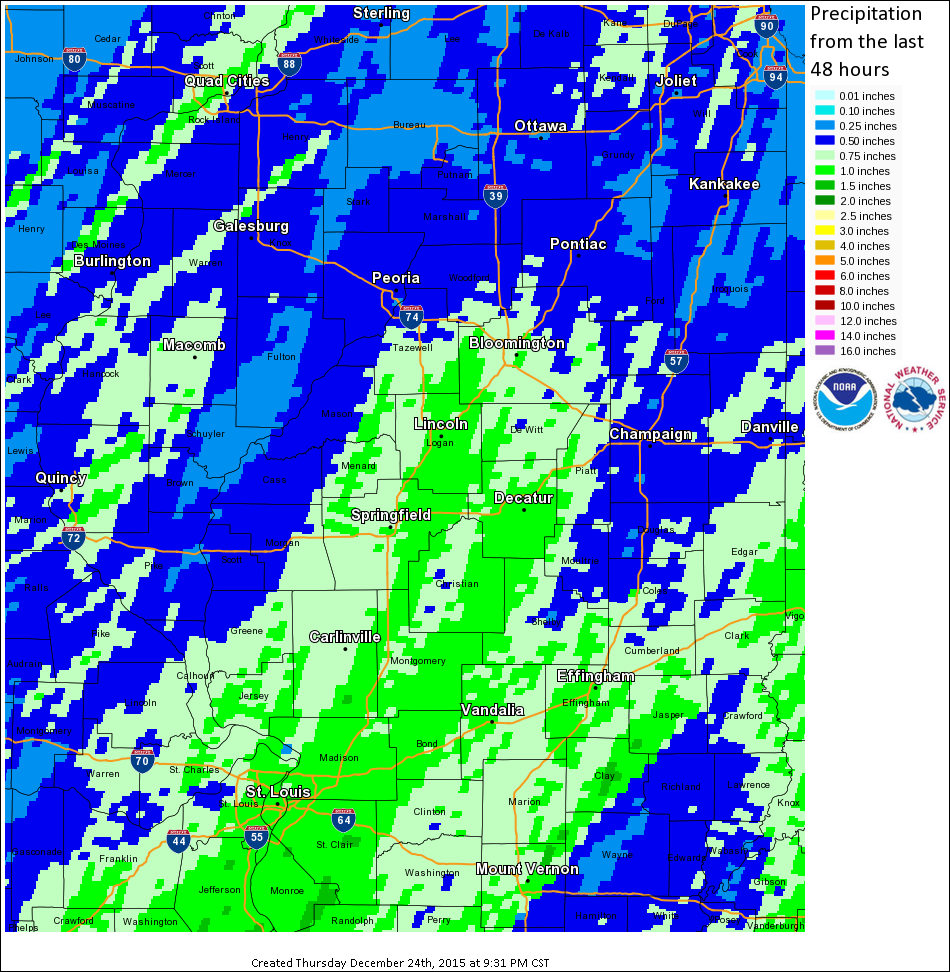 |
.png) |
| December 23 Rainfall | December 26-28 Rainfall |
Precipitation
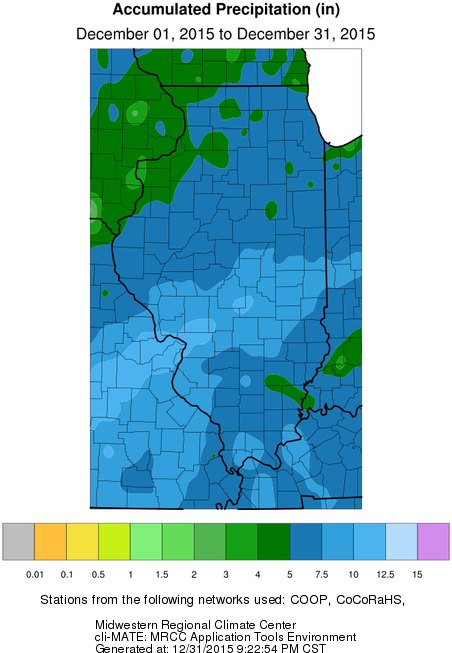
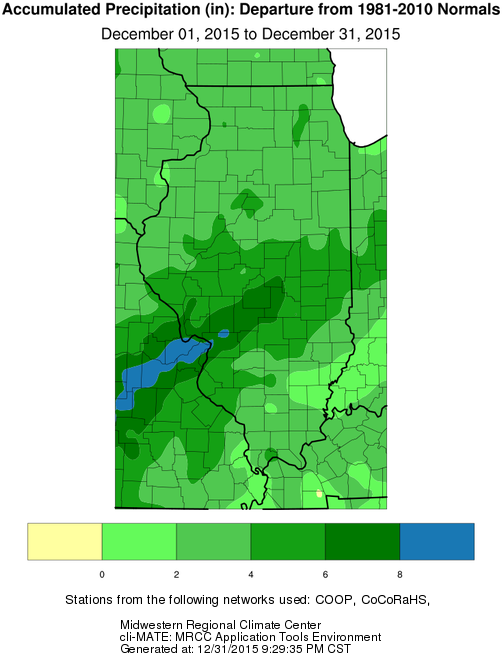
Snowfall
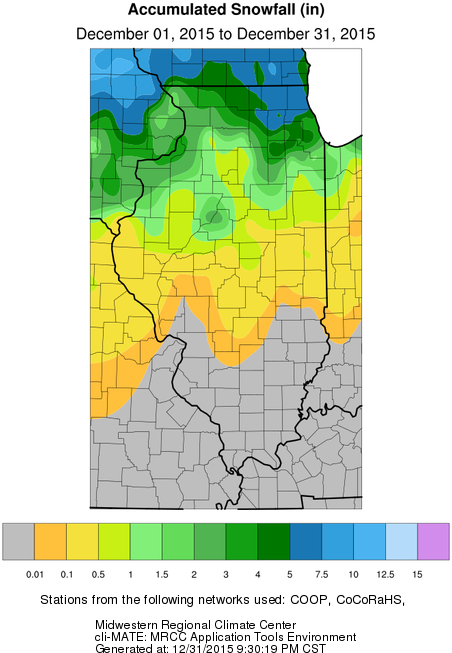
Temperatures
Climate Data
The table below summarizes December liquid equivalent precipitation, snowfall, and temperature, and departure from normal for selected cities across central and southeast Illinois. Data from Peoria and Springfield are from ASOS sites, while others are from NWS Cooperative Observers.
| Site |
Precipitation |
Departure from Normal | Snowfall | Departure from Normal | Average Temperature |
Departure from Normal |
|
Charleston |
8.46" | +5.31" | 0.2" | -2.4" | 44.3 | +12.2 |
| Danville |
7.44" |
+4.61" | 0.2" | -5.0" | 42.4 | +11.6 |
| Decatur |
8.35" |
+5.57" | T | -4.9" | 41.3 | +10.1 |
| Effingham |
8.38" |
+5.24" | T | NA | 42.1 | NA |
|
Flora |
8.06" | +4.62" | 0 | NA | 44.3 | +11.8 |
| Galesburg |
4.57" |
+2.30" | 0.3" | -5.6" | 37.1 | +11.1 |
|
Jacksonville |
7.30" | +4.80" | 0 | -5.2" | 42.0 | +12.1 |
| Lincoln |
6.81" |
+4.17" | 0.1" | -6.1" | 40.2 | +10.7 |
|
Normal |
6.77" |
+4.07" | 0.3" | -4.8" | 39.2 | +11.4 |
|
Olney |
6.36" | +2.48" | 0 | -2.9" | 43.6 | +10.9 |
|
Paris |
9.56" | +6.53" | 0 | -5.5" | 40.7 | +10.5 |
| Peoria |
6.31" |
+3.89" | 2.5" | -4.6" | 41.1 | +12.5 |
| Springfield |
6.56" |
+4.04" | 0.1" | -5.5" | 42.4 | +12.0 |
| Urbana |
7.47" |
+4.74" | T | -6.6" | 40.5 | +11.6 |
Sites in Top 10 Wettest Decembers:
Sites in Top 10 Warmest Decembers:
Links below are the monthly climate summaries for area cities. Only the summaries for Peoria, Springfield and Lincoln are considered "official", meaning they are the station of record for their respective locations. The other summaries are "supplemental", meaning another location in the area is the official climate station for that city.
Climate data for other area cities is available at http://www.nws.noaa.gov/climate/xmacis.php?wfo=ilx



 Follow us on X
 Follow us on Facebook
 Follow us on YouTube
 ILX RSS Feed