Overview
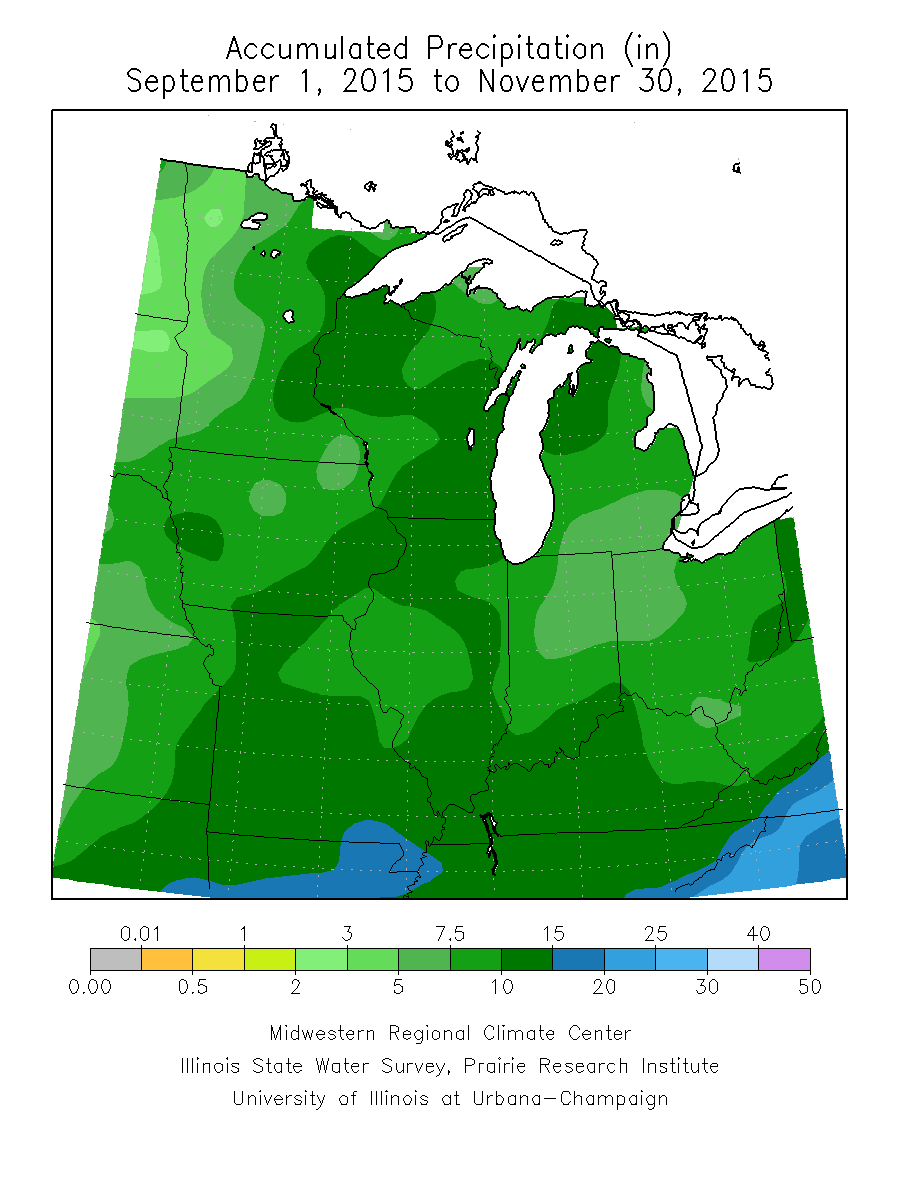
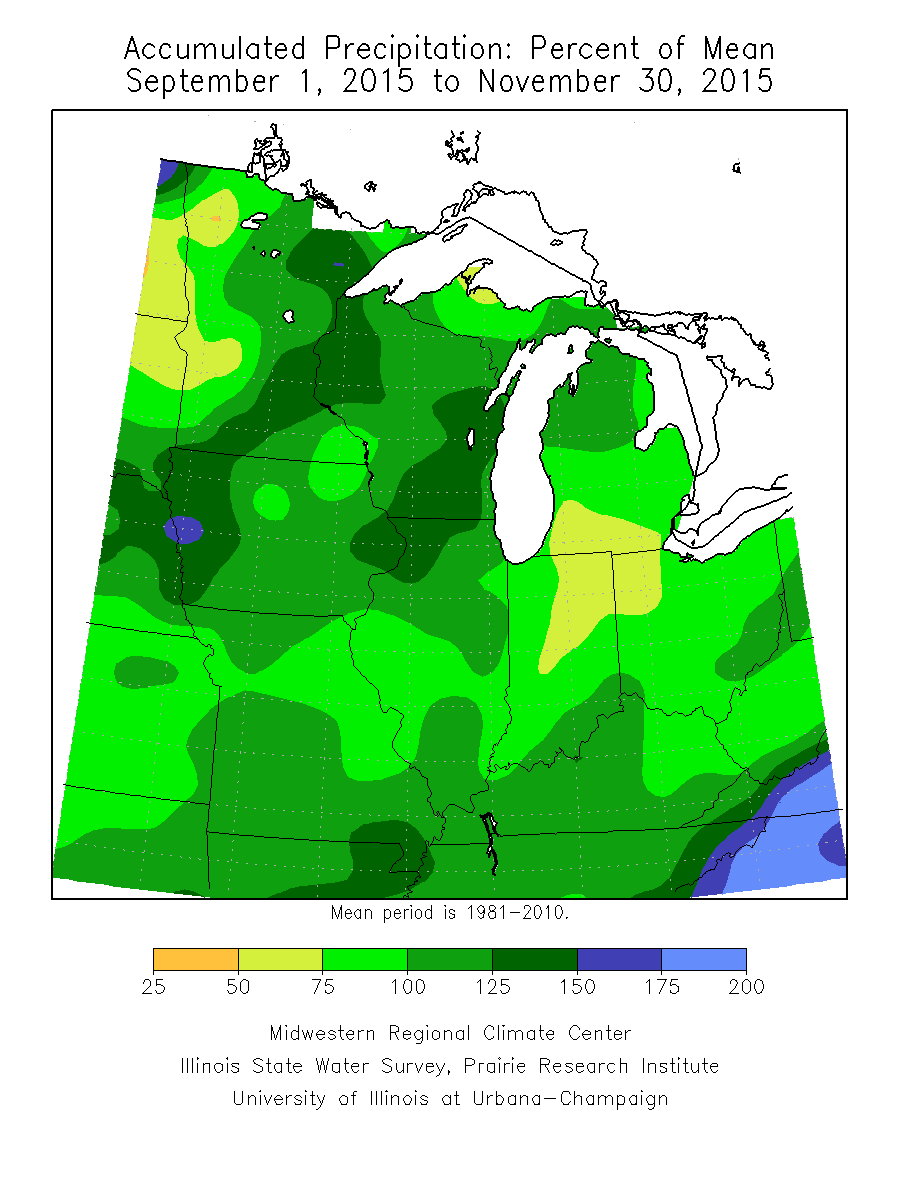
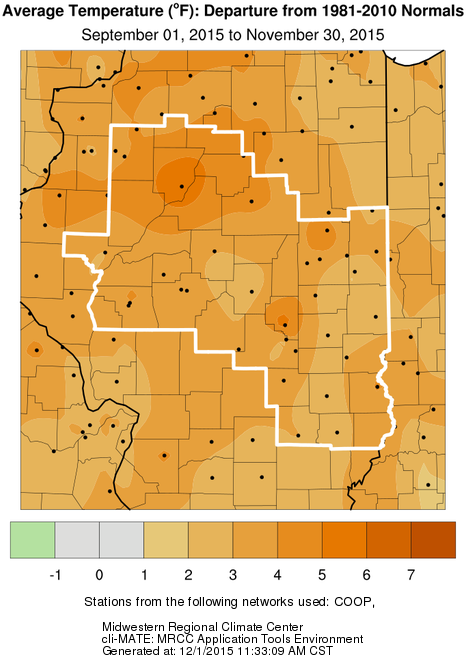
Meteorological Autumn (September through November) produced above normal temperatures, and precipitation that was within a couple inches of normal for central and southeast Illinois. As shown in the maps below, the heavier rainfall distribution favored areas along and north of I-74, and also areas near and east of I-57. Below normal rain amounts fell from west-central Illinois, into the middle of the state. As anticipated with El Nino conditions present, fall temperatures were well above normal. Much of the region saw average temperatures of 2 to 6 degrees above normal. Peoria and Springfield set their 2nd and 3rd warmest Autumns on record, respectively.
Precipitation and Temperature Maps
 |
 |
 |
 |
 |
 |
Links below are the seasonal climate summaries for area cities. Only the summaries for Peoria, Springfield and Lincoln are considered "official", meaning they are the station of record for their respective locations. The other summaries are "supplemental", meaning another location in the area is the official climate station for that city.
Climate data for other area cities is available at http://www.nws.noaa.gov/climate/xmacis.php?wfo=ilx
---------------------------------------------------------------------------------------------------------------------------------------------------
September Summary
September featured well above normal temperatures for all of central and southeast Illinois, and precipitation that ranged from well below normal for much of the area, to well above normal in isolated areas that saw more frequent thunderstorms. The month started out with a hot stretch, when southwest flow and plentiful sunshine boosted highs into the low to mid 90s for several days. There were only a couple brief cool snaps which saw temperatures dip a few degrees below normal, which resulted in monthly averages of 3-7 degrees above normal. Peoria set their warmest September on record with an average temperature of 73.5, or 7.4 degrees above normal.
While most days were dry, a few heavy rain events occurred. Notable events occurred on Thursday September 10th, and Friday, September 18th, when two separate frontal boundaries produced locally heavy rainfall, and isolated hail and damaging wind gusts. Repeated storms resulted in a monthly rain total of 11.74 inches at Hoopeston (northern Vermilion County), and many areas from Danville through Champaign to southeast McLean County received 5 to 8 inches of rain during September. However, west central Illinois was fairly dry, with rainfall totals only about 50-75% of normal, and some areas were classified as "abnormally dry" on the Drought Monitor by the end of the month.
Rainfall
Temperatures
Climate Data
The table below summarizes September rainfall and temperature, and departure from normal for selected cities across central and southeast Illinois. Data from Peoria and Springfield are from ASOS sites, while others are from NWS Cooperative Observers.
| Site |
Rainfall |
Departure from Normal | Average Temperature |
Departure from Normal |
| Danville |
5.23" |
+2.30" | 69.9 | +3.2 |
| Decatur |
1.57" |
-1.57" | 71.0 | +3.2 |
| Effingham |
2.28" |
N/A | 71.1 | N/A |
|
Flora |
1.65" | -1.49" | 71.4 | +3.6 |
| Galesburg |
1.53" |
-1.94" | 70.3 | +5.6 |
|
Jacksonville |
1.45" | -2.08" | 70.9 | +5.2 |
| Lincoln |
4.68 |
+1.47" | 69.8 | +3.9 |
|
Mattoon |
1.93" | -1.29" | N/A | N/A |
|
Normal |
3.48" |
+0.34" | 70.9 | +5.8 |
|
Olney |
1.07" | -2.0 | 71.2 | +3.4 |
|
Paris |
3.00" | -0.18" | 69.1 | +2.6 |
| Peoria |
3.25" |
+0.10" | 73.5 | +7.4 |
| Springfield |
4.29" |
+1.39" | 72.7 | +5.9 |
| Urbana |
6.44" |
+3.31" | 69.8 | +3.6 |
-------------------------------------------------------------------------------------------------------------------------------------------------------------------------------
October Summary
October featured well below normal rainfall, and slightly above normal temperatures across central and southeast Illinois. A stretch of dry weather which began in mid-September, continued into late October for much of the area. With little to no rain falling in many locations for over a month, abnormally dry to moderate drought conditions developed. The worst of the drought conditions extended from west-central Illinois, eastward in a narrow corridor including Springfield, Lincoln, Decatur, Mattoon, and Paris.
Some beneficial rains did occur with a weather system which moved through the area on October 27-28. Rain spread in from the south as low pressure lifted north from Louisiana toward the region. With an upper level disturbance approaching from the west, and rich moisture with both Pacific and Gulf origin, rain spread across the area. The heaviest rain occurred during the late afternoon and evening of the 27th, with another round of heavier rain and even a few thunderstorms across east-central Illinois during the pre-dawn hours of the 28th. Rain totals were generally between one-half and one inch, but several locations along and east of I-57 received in excess of one inch. Another widespread rain occurred on the 31st, when one-quarter to three-quarters of an inch fell ahead of a weak frontal boundary. Even with these rain events, monthly totals were less than half of normal for much of the area.
Temperatures were generally a degree or two above normal for the monthly average. The first sub-freezing temperatures of the season were observed on October 17th & 18th, when many locations saw morning lows in the mid to upper 20s. This ended the growing season across the region.
Rainfall
Temperatures
Climate Data
The table below summarizes October rainfall and temperature, and departure from normal for selected cities across central and southeast Illinois. Data from Peoria and Springfield are from ASOS sites, while others are from NWS Cooperative Observers.
| Site |
Rainfall |
Departure from Normal | Average Temperature |
Departure from Normal |
| Danville |
1.81" |
-1.76" | 57.4 | +2.4 |
| Decatur |
1.54" |
-1.71" | 56.7 | +0.5 |
| Effingham |
1.40" |
N/A | 57.8 | N/A |
|
Flora |
1.46" | -2.21" | 58.0 | +2.7 |
| Galesburg |
1.29" |
-1.46" | 54.0 | +1.5 |
|
Jacksonville |
1.21" | -1.80" | 56.3 | +2.1 |
| Lincoln |
1.64" |
-1.44" | 55.0 | +1.2 |
|
Mattoon |
1.27" | -2.29" | N/A | N/A |
|
Normal |
1.43" |
-1.89" | 55.0 | +1.9 |
|
Olney |
0.87" | -3.12 | 57.8 | +1.6 |
|
Paris |
1.43" | -1.95" | 56.9 | +2.1 |
| Peoria |
2.01" |
-0.83" | 58.3 | +4.3 |
| Springfield |
1.47" |
-1.68" | 57.2 | +2.1 |
| Urbana |
2.02" |
-1.24" | 56.2 | +2.3 |
------------------------------------------------------------------------------------------------------------------------------------------------------------------------------
November Summary
November 2015 featured above normal precipitation of 4-6 inches, and above normal temperatures across central and southeast Illinois. After a drier than normal October, a wetter pattern developed after Nov 4th. The 4-7 inches of precipitation from Nov 5-30th ended the drought over central and southeast IL. Peoria had 6.17 inches of precipitation during this month making it their 3rd wettest November since records began in 1883.
The most significant event of the month occurred on Saturday, November 21, when low pressure tracked across southern Illinois, and into Indiana. This system initially spread rain across central and southeast Illinois, but as colder air filtered in from the north, a change over to snow occurred from north to south, overnight and during the morning. Periods of moderate to heavy snow were observed until the snow tapered off from west to east during the afternoon. Blustery northerly winds developed causing some blowing and drifting, mainly north of I-74, where colder temperatures and higher snow amounts were observed. With soil temperatures in the upper 40s to lower 50s, the snow initially melted in many areas, however snowfall rates were high enough to overcome the melting and allow for accumulation to occur, mainly north of a Jacksonville to Paris line. The highest totals in central Illinois were reported north of a Galesburg to Roanoke line, where 5 to 9 inch totals were received. While it is not unusual to see the first snowfall in late November, such high totals were quite unusual for a first snow event of the season. Daily snowfall records were set at many sites, including official climate stations at Springfield (0.5"), Lincoln (1.0"), and Peoria (4.6").
Temperatures in November 2015 were generally 3-6 degrees above normal for the monthly average. Peoria's average monthly temperature of 47.9 degrees was tied for the 4th warmest November on record. Springfield's average monthly temperature of 48.4F was the 7th warmest November on record.
Precipitation
Temperatures
Climate Data
The table below summarizes November rainfall, snowfall, and temperature, and departure from normal for selected cities across central and southeast Illinois. Data from Peoria and Springfield are from ASOS sites, while others are from NWS Cooperative Observers.
| Site |
Rainfall |
Departure from Normal | Snowfall | Departure from Normal | Average Temperature |
Departure from Normal |
|
Charleston |
4.51" | +0.54 | 0.2" | -0.5" | 49.3 | +4.9 |
| Danville |
4.06" |
+0.23" | 2.0" | +1.8" | 47.7 | +4.3 |
| Decatur |
4.42" |
+0.71" | N/A | N/A | 47.3 | +3.5 |
| Effingham |
6.83" |
+2.77" | Trace | +0.0" | 47.5 | N/A |
|
Flora |
6.81" | -2.21" | N/A | N/A | 48.0 | +3.2 |
| Galesburg |
5.52" |
+2.65" | 5.0" | +4.2" | 43.2 | +4.1 |
|
Jacksonville |
4.62" | +1.00" | 0.1" | -0.4" | 47.9 | +5.4 |
| Lincoln |
4.42" |
+2.26" | 1.0" | +0.4" | 45.8 | +3.7 |
|
Mattoon |
6.11" | +2.29" | 0.0" | -0.4" |
N/A | N/A |
|
Morton |
6.46" | +3.20" | 3.6" | +2.9" | N/A | N/A |
|
Normal |
5.15" |
+1.88" | 3.5" | +3.2" | 45.2 | +4.7 |
|
Olney |
5.88" | +1.40 | 0.0" | -0.3" | 48.5 | +4.0 |
|
Paris |
5.63" | +1.85" | 0.1" | -0.3" | 46.0 | +3.2 |
| Peoria |
6.17" |
+3.04" | 4.6" | +3.5" | 47.9 | +6.3 |
|
Rushville |
5.71" | +2.71" | 1.0" | +0.7" | 45.9 | +3.7 |
| Springfield |
4.01" |
+0.80" | 0.5" | -0.1" | 48.4 | +5.3 |
|
Tuscola |
4.37" | +0.52" | 2.0" | +1.3" | 46.1 | +4.4 |
| Urbana |
5.10" |
+1.42" | 1.8" | +0.9" | 45.9 | +4.6 |