A slow moving front will bring rounds of strong to severe thunderstorms and heavy rainfall to the central Plains eastward to the east-central U.S.. The first widespread significant heat wave of summer for the Intermountain West and Plains is expected to develop today and expand through next week. Dangerous heat will continue to impact portions of the Southwest and Southeast. Read More >
Overview
|
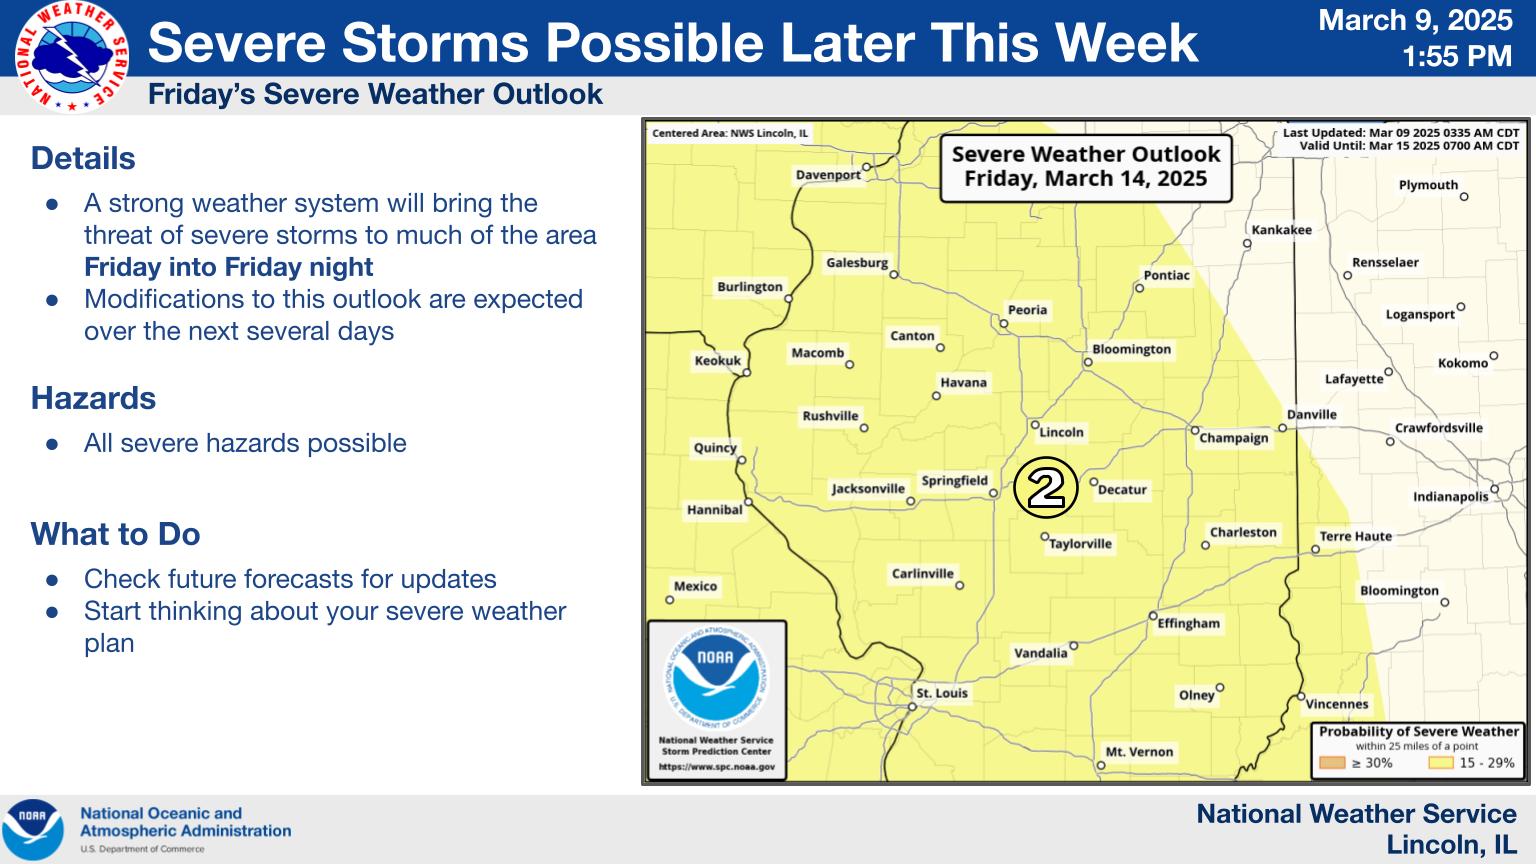
On Friday, March 14th, an unseasonably strong low pressure system lifted across the Great Plains and into the Midwest. The resulting tight pressure gradient ahead of that cyclone resulted in strong southerly winds that advected an unseasonably warm airmass into the region. In fact, a high temperature record was broken in Peoria and tied in Lincoln and Springfield, hitting 82 and 83 degrees respectively. Preliminary findings from our damage surveys determined there were 8 tornadoes. Two EF-2s and six EF-1s. **Stay tuned for further updates in the coming days** |
 Radar loop from the night of Friday, March 14 into the early morning hours of Saturday, March 15. |
Tornadoes
Select a tornado from the table to zoom into the track and view more information. The default table view is limited to 8 tracks, but can be scrolled by a mouse wheel or dynamically expanded. Additionally, the table can fill the entire window by clicking the small circular expanding arrow icon at the very top right of the table and returned to its original size by clicking the button again. The side information panel that opens over the map can be closed using the "X" on the upper right corner of the pop-up. Zoom into the map and click damage points to see detailed information and pictures from the surveys.
|
NOTE: times shown below are local to your device's time zone. |

The Enhanced Fujita (EF) Scale classifies tornadoes into the following categories:
| EF0 Weak 65-85 mph |
EF1 Moderate 86-110 mph |
EF2 Significant 111-135 mph |
EF3 Severe 136-165 mph |
EF4 Extreme 166-200 mph |
EF5 Catastrophic 200+ mph |
 |
|||||
| Tornadoes that fail to impact any ratable structures on the EF-Scale are rated EF-Unknown (EF-U) | |||||
Storm Reports
Preliminary Local Storm Report...Summary
National Weather Service Lincoln IL
659 PM CDT Mon Mar 17 2025

..TIME...   ...EVENT...      ...CITY LOCATION...     ...LAT.LON...
..DATE...   ....MAG....      ..COUNTY LOCATION..ST.. ...SOURCE....
            ..REMARKS..

0910 PM     Tstm Wnd Dmg     3 NE Rushville          40.15N 90.52W
03/14/2025                   Schuyler           IL   Mesonet

            Several tree branches were blown down and
            power was out for about 6 hours.

0915 PM     Tstm Wnd Gst     Galesburg Airport       40.94N 90.43W
03/14/2025  M69 MPH          Knox               IL   AWOS

            REPORTED AT GBG.

0939 PM     Tstm Wnd Dmg     Canton                  40.56N 90.04W
03/14/2025                   Fulton             IL   Emergency Mngr

            Decayed tree split, powerlines down, and
            pieces of roofing material blown off a
            couple buildings. Timing estimated from
            radar.

0940 PM     Tstm Wnd Dmg     1 SSE Canton            40.55N 90.03W
03/14/2025                   Fulton             IL   Emergency Mngr

            Metal carport blown down. Time estimated
            from radar.

0951 PM     Tstm Wnd Dmg     4 N West Jersey         41.07N 89.93W
03/14/2025                   Stark              IL   Public

            time estimated from radar. Public report of
            pieces of metal from farm outbuildings
            removed and a small area of a drip edge that
            was taken off a home.

0955 PM     Tstm Wnd Dmg     4 N Easton              40.30N 89.85W
03/14/2025                   Mason              IL   Emergency Mngr

            Structural damage to a home porch.

0957 PM     Tstm Wnd Dmg     4 SSW Alta              40.77N 89.66W
03/14/2025                   Peoria             IL   Trained Spotter

            Large but decayed tree snapped near the
            base. Time estimated by radar.

0957 PM     Tstm Wnd Dmg     1 SE West Peoria        40.68N 89.62W
03/14/2025                   Peoria             IL   Broadcast Media

            Fence and a few ill-looking trees downed by
            thunderstorm winds. Time estimated from
            radar.

0958 PM     Tstm Wnd Dmg     2 SE Alta               40.80N 89.61W
03/14/2025                   Peoria             IL   Emergency Mngr

            A large section of sturdy fencing was
            knocked down across from the Kroger on Rt
            40.

0958 PM     Tstm Wnd Dmg     1 E Peoria Heights      40.74N 89.56W
03/14/2025                   Peoria             IL   Broadcast Media

            Rotted tree snapped at its base at the
            Peoria Country Club Golf Course. Time
            estimated from radar.

0959 PM     Tstm Wnd Dmg     Pekin                   40.57N 89.65W
03/14/2025                   Tazewell           IL   Emergency Mngr

            Roofing material ripped off of a large
            building. Time estimated from radar.

1000 PM     Tstm Wnd Dmg     Mossville               40.82N 89.57W
03/14/2025                   Peoria             IL   Broadcast Media

            A couple trees downed by thunderstorm winds.
            Time estimated from radar.

1000 PM     Tstm Wnd Dmg     Hanna City              40.69N 89.80W
03/14/2025                   Peoria             IL   Broadcast Media

            Restaurant sign blown over. Time estimated
            from radar.

1007 PM     Tstm Wnd Dmg     3 SE Brimfield          40.81N 89.83W
03/14/2025                   Peoria             IL   Emergency Mngr

            Trees down.

1008 PM     Tstm Wnd Dmg     1 E Pekin               40.57N 89.63W
03/14/2025                   Tazewell           IL   Emergency Mngr

            Tree down. Time estimated from radar.

1010 PM     Tstm Wnd Gst     New Berlin              39.73N 89.91W
03/14/2025  E70 MPH          Sangamon           IL   Emergency Mngr

            60 to 70 mph winds estimated from New Berlin
            to Loami.

1015 PM     Tstm Wnd Dmg     3 W Green Valley        40.41N 89.69W
03/14/2025                   Tazewell           IL   Public

            A grain bin was destroyed and part of a barn
            roof was damaged.

1019 PM     Hail             Athens                  39.96N 89.73W
03/14/2025  M0.75 Inch       Menard             IL   Public

            Report from mPING: Dime (0.75 in.).

1022 PM     Tstm Wnd Gst     Chillicothe             40.92N 89.49W
03/14/2025  M61 MPH          Peoria             IL   Emergency Mngr


1025 PM     Tstm Wnd Dmg     1 S Washington          40.69N 89.41W
03/14/2025                   Tazewell           IL   Mesonet

            Large trees blown down on the south side of
            Washington.

1031 PM     Tstm Wnd Dmg     2 ENE Beason            40.15N 89.15W
03/14/2025                   Logan              IL   NWS Storm Survey

            Siding damage on outbuilding and garage.

1105 PM     Hail             3 SE Taylorville        39.52N 89.25W
03/14/2025  M1.50 Inch       Christian          IL   Public


1120 PM     Tstm Wnd Dmg     Niantic                 39.86N 89.17W
03/14/2025                   Macon              IL   Emergency Mngr

            Delayed Report. School bus barn roof was
            peeled off. Time estimated by radar.

1125 PM     Hail             Altamont                39.06N 88.75W
03/14/2025  E1.25 Inch       Effingham          IL   Mesonet


1140 PM     Tstm Wnd Dmg     3 WNW Findlay           39.54N 88.81W
03/14/2025                   Shelby             IL   Broadcast Media

            Barn with 2nd level torn off, near Findlay
            along Rt 128. Delayed Report. Time estimated
            by radar.

1145 PM     Hail             1 E Moccasin            39.15N 88.75W
03/14/2025  M1.75 Inch       Effingham          IL   Mesonet

            Hail lasted for approximately 5 minutes and
            partially covered the road.

1152 PM     Tstm Wnd Dmg     3 ENE Bethany           39.66N 88.69W
03/14/2025                   Moultrie           IL   Public

            Farm outbuilding destroyed.

1153 PM     Tstm Wnd Dmg     Hammond                 39.80N 88.59W
03/14/2025                   Piatt              IL   Broadcast Media

            Delayed report. Relayed from broadcast
            media. Time estimated by radar. Large 12 in
            tree limbs down on a house. Shingles peeled
            upward on roofing.

1155 PM     Funnel Cloud     3 NW Watson             39.06N 88.61W
03/14/2025                   Effingham          IL   Trained Spotter

            Corrects previous funnel cloud report from 3
            NW Watson.

1155 PM     Funnel Cloud     4 NW Watson             39.06N 88.63W
03/14/2025                   Effingham          IL   Trained Spotter


1157 PM     Tornado          3 W Lovington           39.72N 88.68W
03/14/2025                   Moultrie           IL   NWS Storm Survey

            EF1, peak wind speed 110 mph. Path length
            5.1 miles, width 150 yards. Most damage was
            to trees and power lines, but farm
            outbuildings were destroyed near the
            touchdown point, a well as county road 950E
            a quarter mile north of 2500N.

1159 PM     Tstm Wnd Dmg     Hammond                 39.80N 88.59W
03/14/2025                   Piatt              IL   Broadcast Media

            Gutters and roofing material ripped off of
            house, small outbuilding demolished, large
            limbs and cell tower blown down. Time
            estimated from radar.

1200 AM     Tstm Wnd Dmg     Neoga                   39.32N 88.45W
03/15/2025                   Cumberland         IL   Public

            Report from social media. Porch and portion
            of roof torn off of home.

1202 AM     Tstm Wnd Dmg     1 NE Neoga              39.33N 88.43W
03/15/2025                   Cumberland         IL   Law Enforcement

            Semis blown over on I-57.

1203 AM     Tornado          1 SE Neoga              39.31N 88.44W
03/15/2025                   Cumberland         IL   NWS Storm Survey

            *** 2 INJ ***
            EF2, peak wind speed 120 mph. Path length
            11.3 miles, max width 300 yards. Touched
            down on the southeast side of Neoga, and
            damaged the roof of the high school and
            caved in the front door of the elementary
            school. Two injuries occurred in semis that
            were overturned on I-57 at the US-45 exit.
            The tornado tracked northeast and crossed
            into Coles County west of US-45, lifting
            along Lerna Rd. south of county road 450N.

1205 AM     Tornado          Hammond                 39.79N 88.59W
03/15/2025                   Piatt              IL   NWS Storm Survey

            EF2, peak wind speed 115 mph. Path length
            10.1 miles, max width 150 yards. Numerous
            trees were damaged in Hammond, some of which
            caused building damage as they fell. The
            peak intensity occurred near the
            intersection of Don Ryan St. and county road
            100, where an outbuilding was completely
            destroyed, though high winds also blew down
            a cell tower about 3/4 mile east.

1210 AM     Tornado          3 SSE Cooks Mill        39.53N 88.38W
03/15/2025                   Coles              IL   NWS Storm Survey

            EF1, peak wind speed 100 mph. Path length
            0.6 miles, max width 75 yards. Snapped 11
            power poles near the intersection of county
            roads 500E and 1100N.

1213 AM     Tstm Wnd Dmg     Janesville              39.37N 88.24W
03/15/2025                   Coles              IL   Public

            time estimated from radar. Public photos
            shared of large tree branches broken and a
            small outbuilding shifted from the
            foundation.

1215 AM     Tstm Wnd Dmg     1 WNW Lerna             39.42N 88.31W
03/15/2025                   Coles              IL   Emergency Mngr

            power lines down. Time estimated from radar.

1220 AM     Tstm Wnd Dmg     1 SE Charleston         39.47N 88.15W
03/15/2025                   Coles              IL   Emergency Mngr

            power poles and lines down. Time estimated
            from radar.

1227 AM     Tstm Wnd Gst     Tolono                  39.99N 88.26W
03/15/2025  M55 MPH          Champaign          IL   Fire Dept/Rescue

            relayed via emergency manager.

1231 AM     Tstm Wnd Dmg     3 N Mattoon             39.53N 88.37W
03/15/2025                   Coles              IL   Emergency Mngr

            power poles broken and powerlines down.

1232 AM     Tstm Wnd Gst     Willard Airport         40.04N 88.28W
03/15/2025  M64 MPH          Champaign          IL   ASOS

            REPORTED AT CMI.

1240 AM     Tstm Wnd Dmg     Champaign               40.12N 88.26W
03/15/2025                   Champaign          IL   Mesonet

            A tree was blown down near the intersection
            of S McKinley Avenue and W Church Street.

1241 AM     Tornado          6 SE Thomasboro         40.18N 88.11W
03/15/2025                   Champaign          IL   NWS Storm Survey

            EF1, peak wind speed 100 mph. Path length
            13.5 miles, max width 150 yards. Touched
            down just west of Sellars, mainly doing tree
            damage. Outbuilding damage occurred along
            county road 2000E just north of 2300N, with
            additional outbuildings damaged along 2600N
            west of 2100E. It continued north-northeast
            and went across the northwest edge of
            Gifford, causing shingle damage to several
            houses. It lifted in the Middle Fork Forest
            Preserve near county road 3300N.

1242 AM     Tstm Wnd Dmg     4 NNW Clarksville       39.51N 87.83W
03/15/2025                   Edgar              IL   Public

            time estimated from radar. image shared of
            an open-air farm outbuilding with walls
            collapsed and roofing blown off.

1250 AM     Tstm Wnd Dmg     1 S Paris               39.60N 87.69W
03/15/2025                   Edgar              IL   Broadcast Media

            Trees uprooted, structural damage to a
            trailer home, and a roof uplifted from a
            single residence home.

1250 AM     Tornado          2 SSW Paris             39.58N 87.71W
03/15/2025                   Edgar              IL   NWS Storm Survey

            EF1, peak wind speed 90 miles. Path length
            3.6 miles, max width 1/4 mile. Touched down
            near the intersection of E. 750th Rd. and N.
            1400th St. It moved northeast across the
            southern part of Paris, damaging several
            homes, mobile homes, and trees. It
            dissipated on the north side of Sycamore
            Hills Country Club.

1251 AM     Tstm Wnd Dmg     1 SSE Paris             39.60N 87.68W
03/15/2025                   Edgar              IL   Public

            Delayed report. Relayed from social media.
            Time estimated by radar. Multiple power
            poles down east side of Paris along US 150.

1258 AM     Tstm Wnd Dmg     Gifford                 40.31N 88.02W
03/15/2025                   Champaign          IL   Emergency Mngr

            a few trailers flipped.

0153 AM     Funnel Cloud     Annapolis               39.15N 87.82W
03/15/2025                   Crawford           IL   Trained Spotter


0216 AM     Hail             2 SW Bridgeport         38.69N 87.78W
03/15/2025  M0.75 Inch       Lawrence           IL   Public

            Report from mPING: Dime (0.75 in.).


&&

$$
Environment
 |
 |
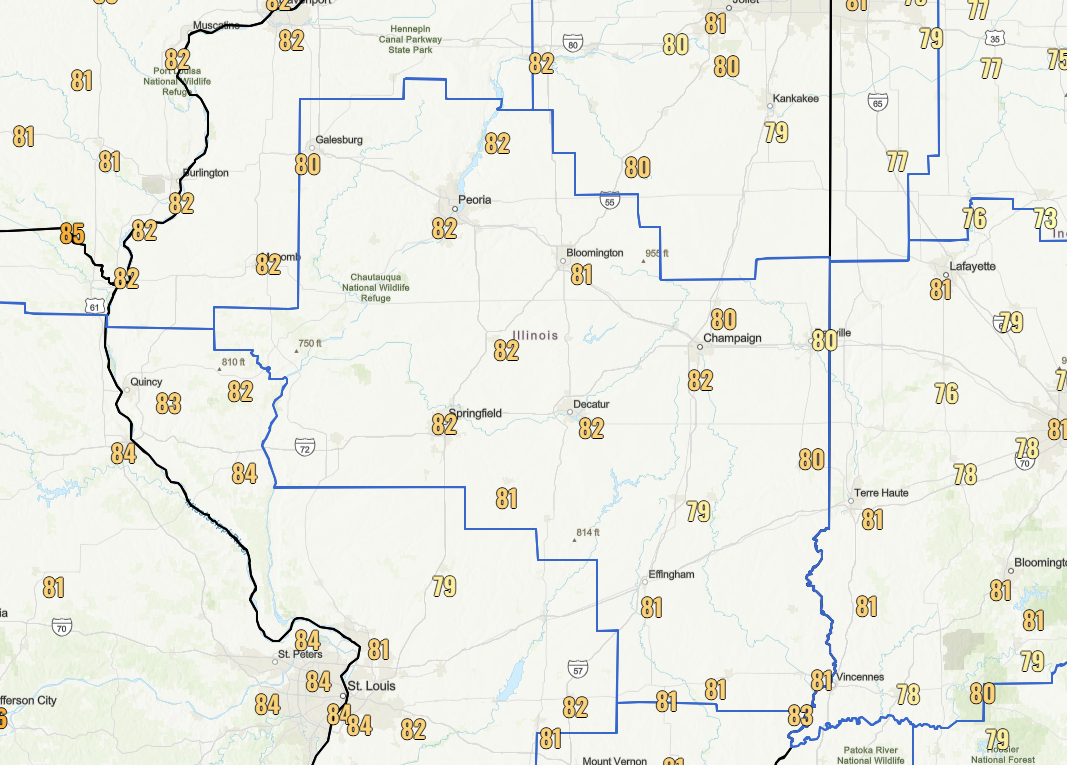 |
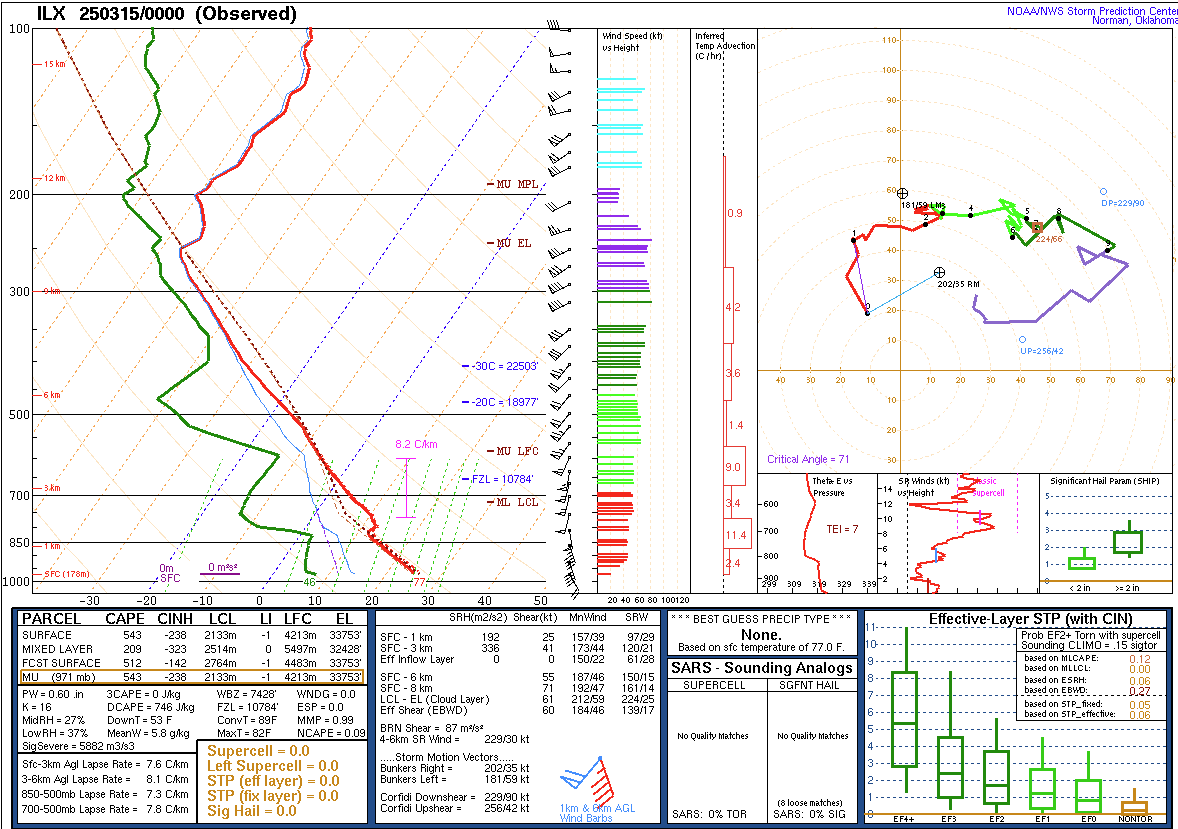
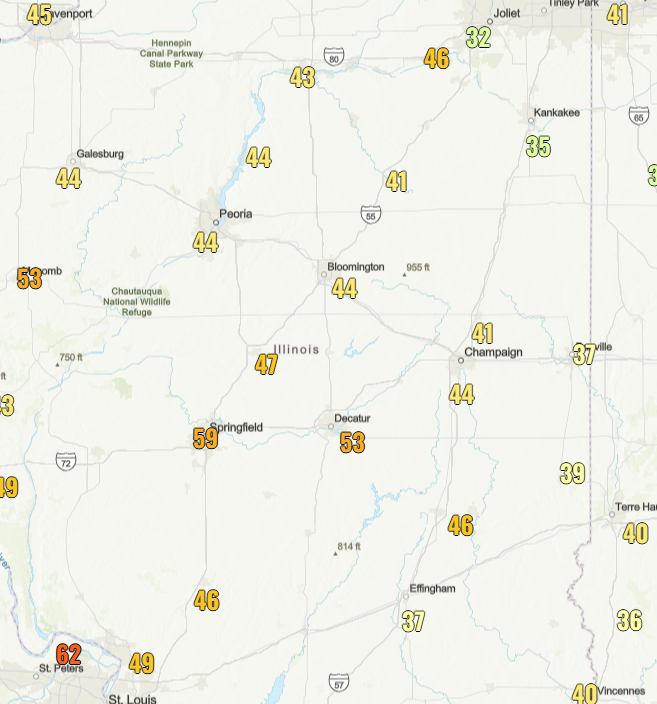
| The KILX sounding from the evening of March 14 (00Z March 15). | Infrared satellite imagery showing the powerhouse low pressure system as it pushed storms toward IL late Friday evening (March 14). | Max Temperatures on Fri, Mar 14 were about 30 degrees warmer than normal, which helped aid the environment for severe storm development later that night. |
 |
 |
|
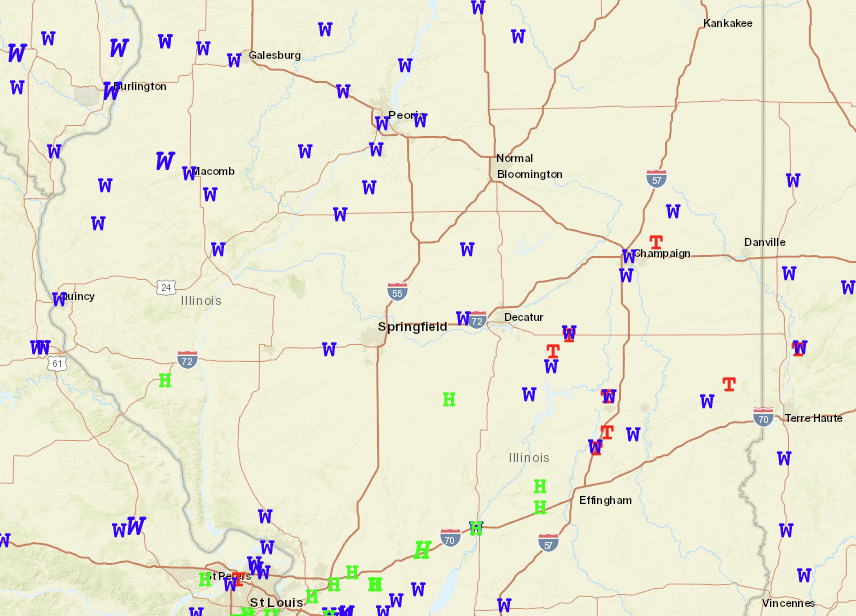
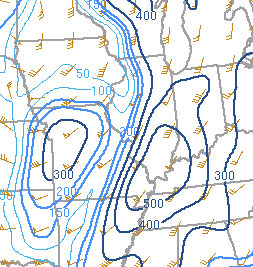
| Maximum wind gusts across central IL ahead of the thunderstorms Friday evening | 0-1km storm relative helicity (SRH) at 11pm Friday evening. For reference, 0-1km SRH values over 100 m^2/s^2 are favorable for tornadoes. | Figure 6: Caption |
Photos & Video
 |
 |
 |
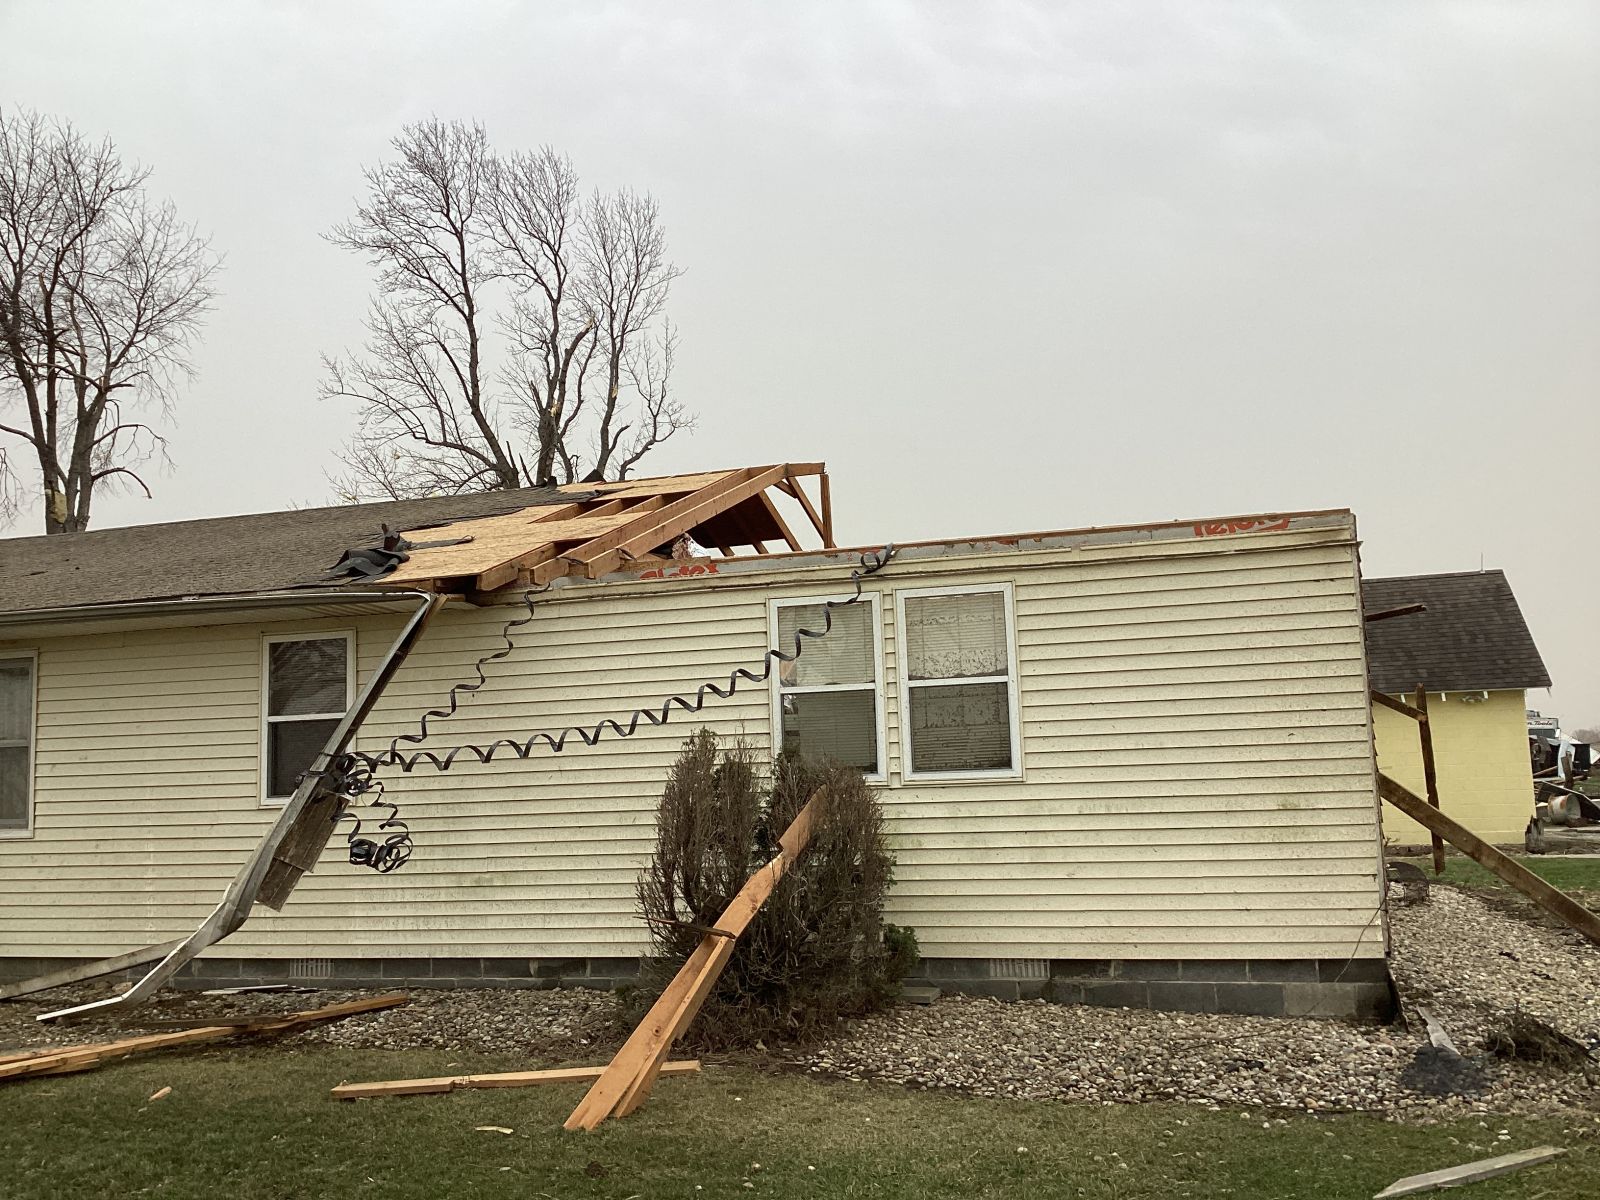 |
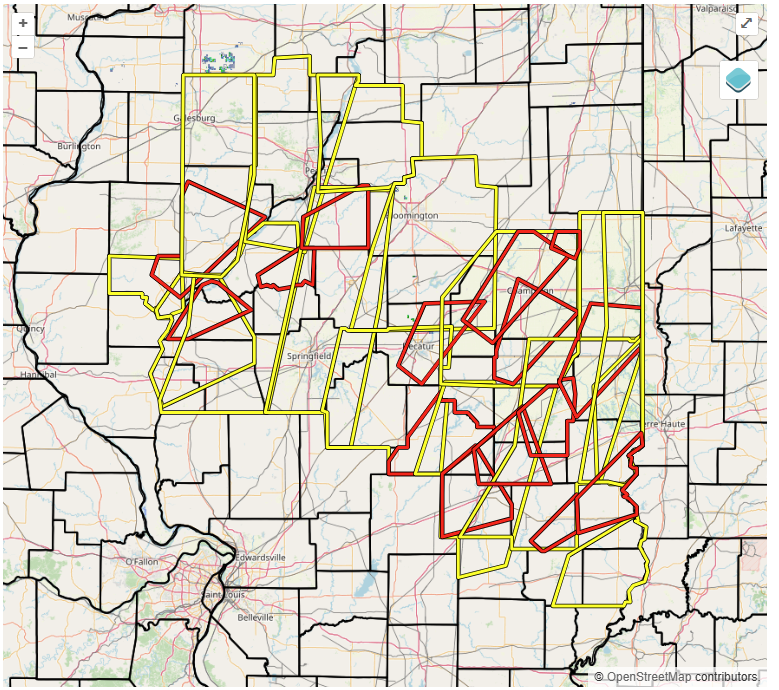
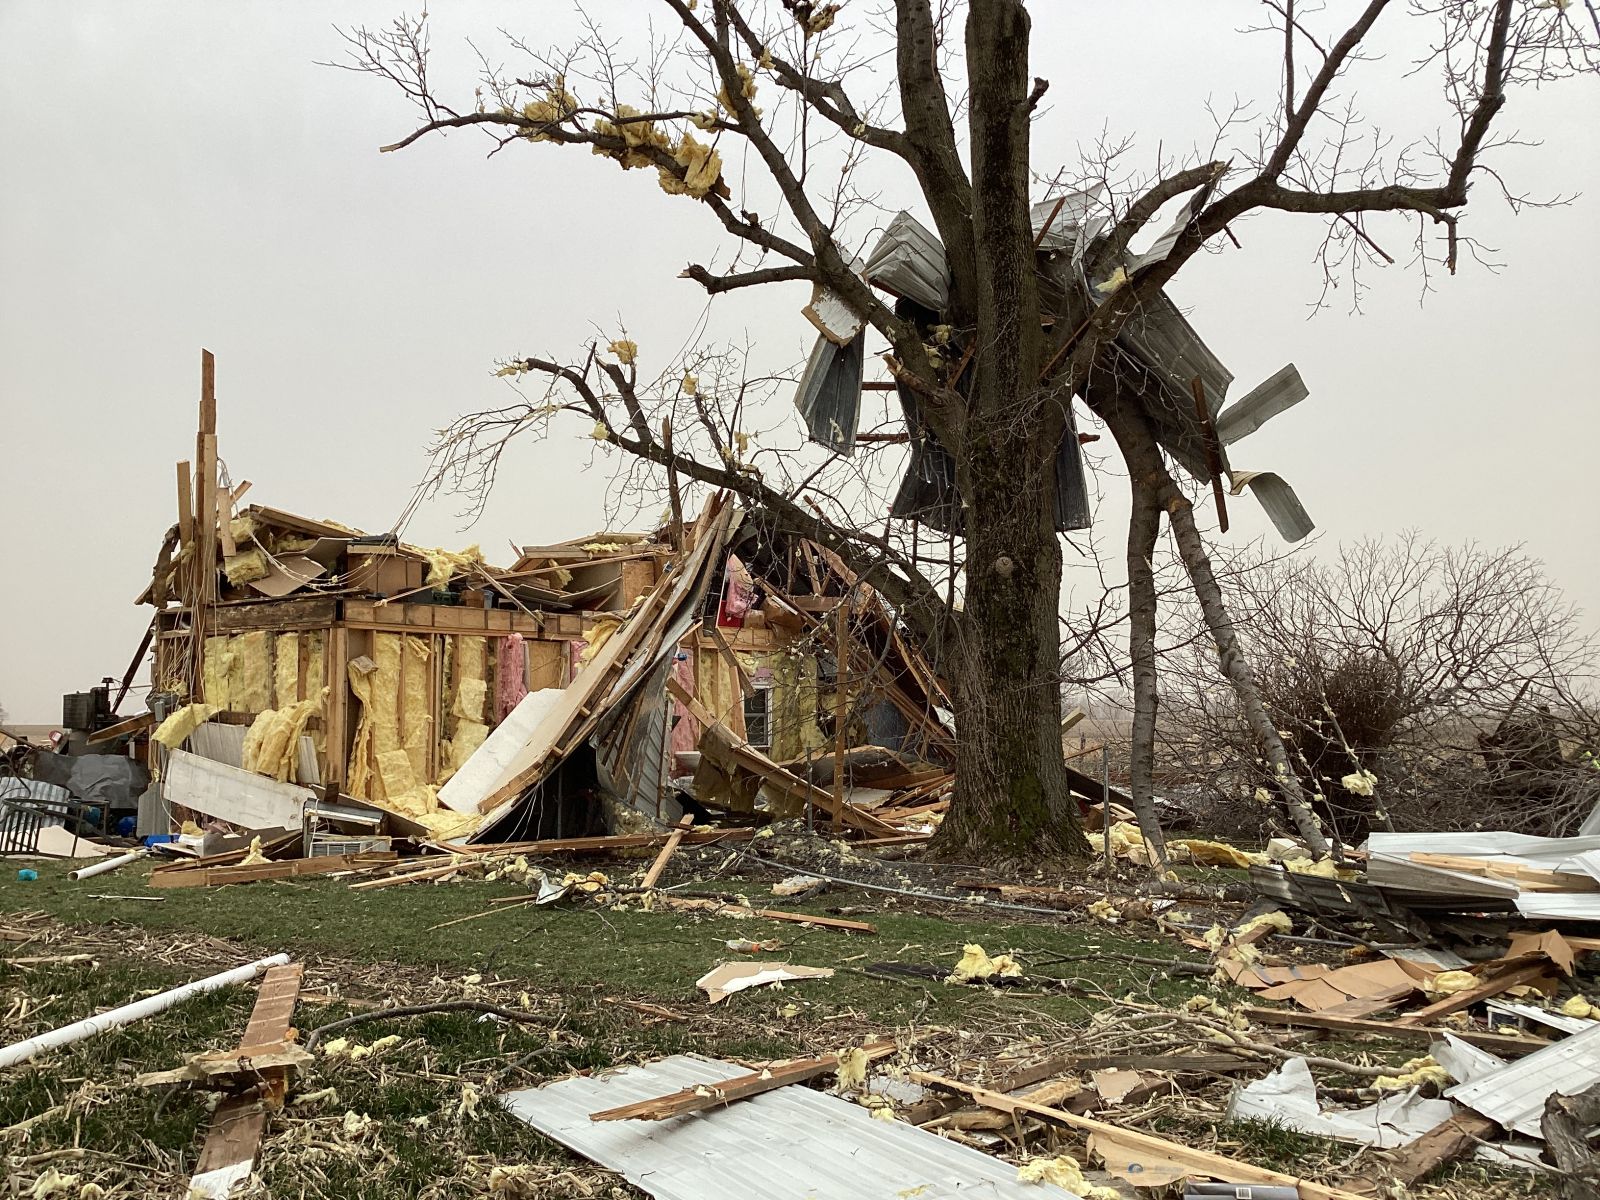
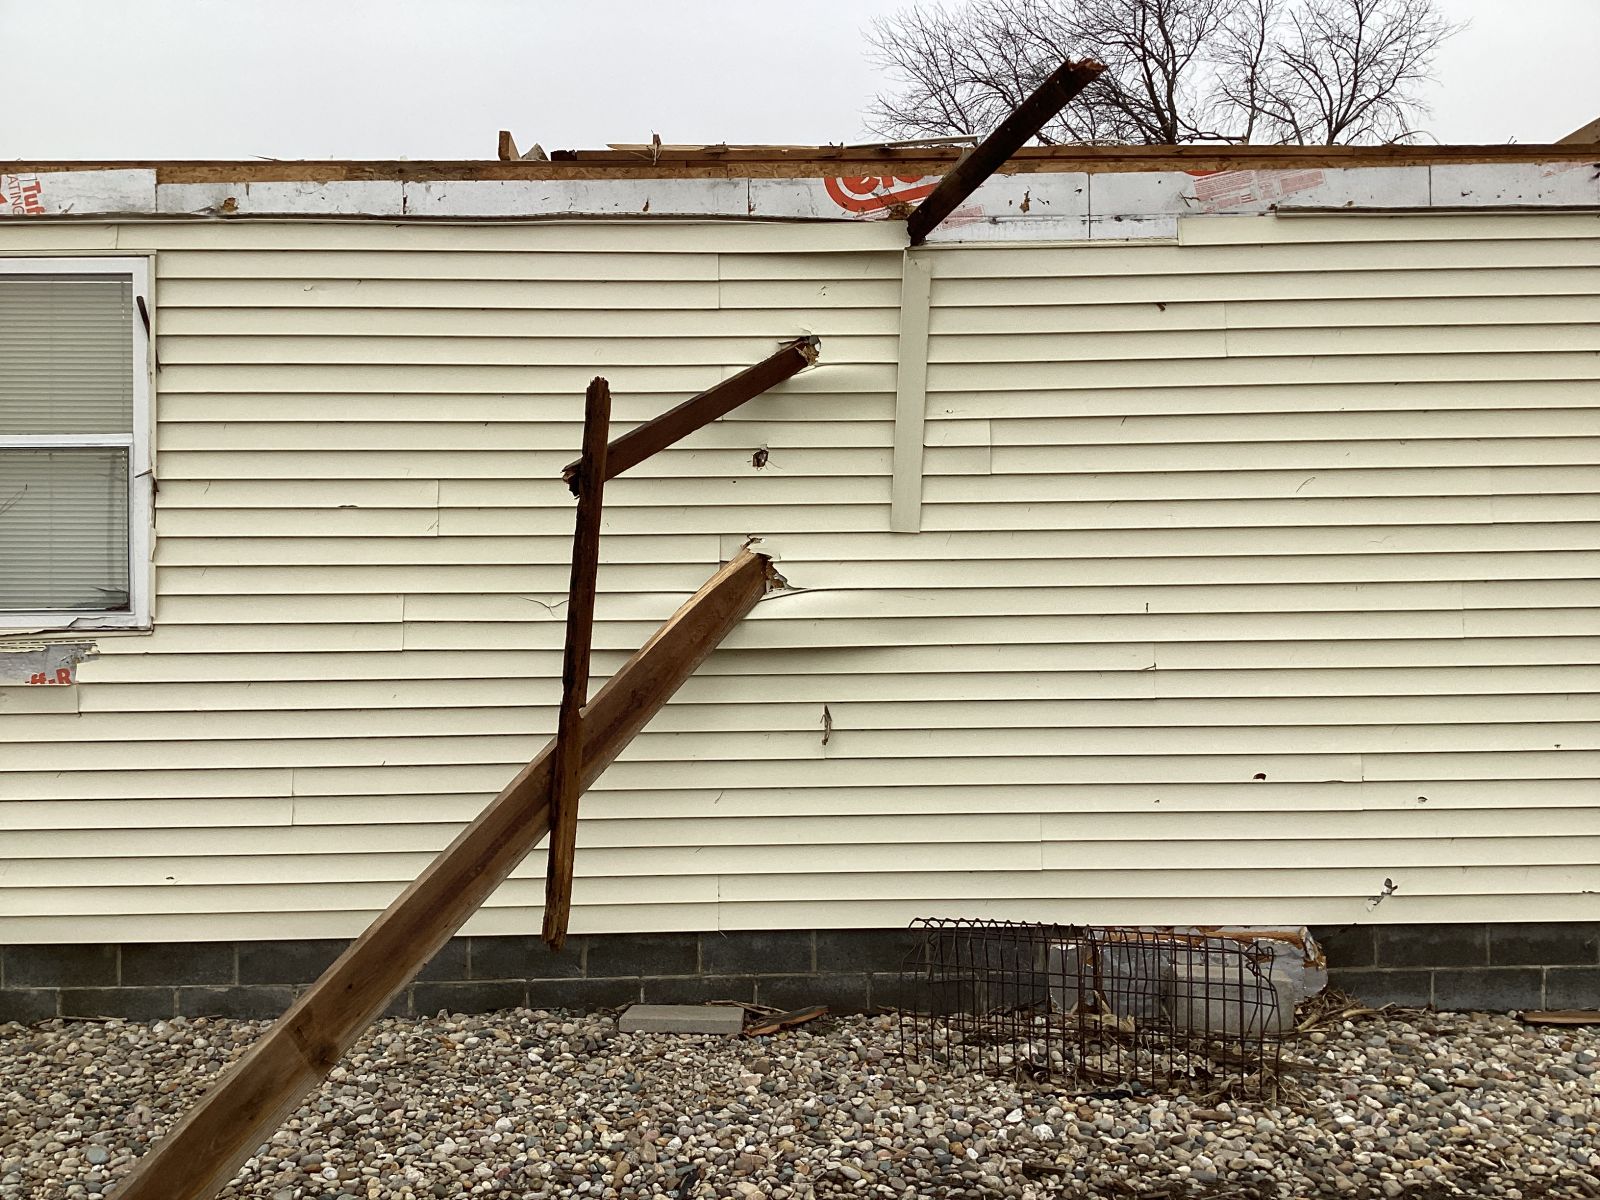
| A composite of all the warnings issued by NWS Central IL between March 14-15, which included 16 Severe Thunderstorm Warnings and 15 Tornado Warnings. Image courtesy of Iowa State Mesonet. | Photo of a destroyed outbuilding between Etna and Trilla, caused by the EF2 tornado that began near Neoga. (NWS Survey) | Pieces of plywood impaled into a home on the Cumberland/Coles County line from the EF2 Neoga tornado. (NWS Survey) | Roof damage to a home on the Cumberland/Coles County line from the EF2 Neoga tornado. (NWS Survey) |
 |
 |
||
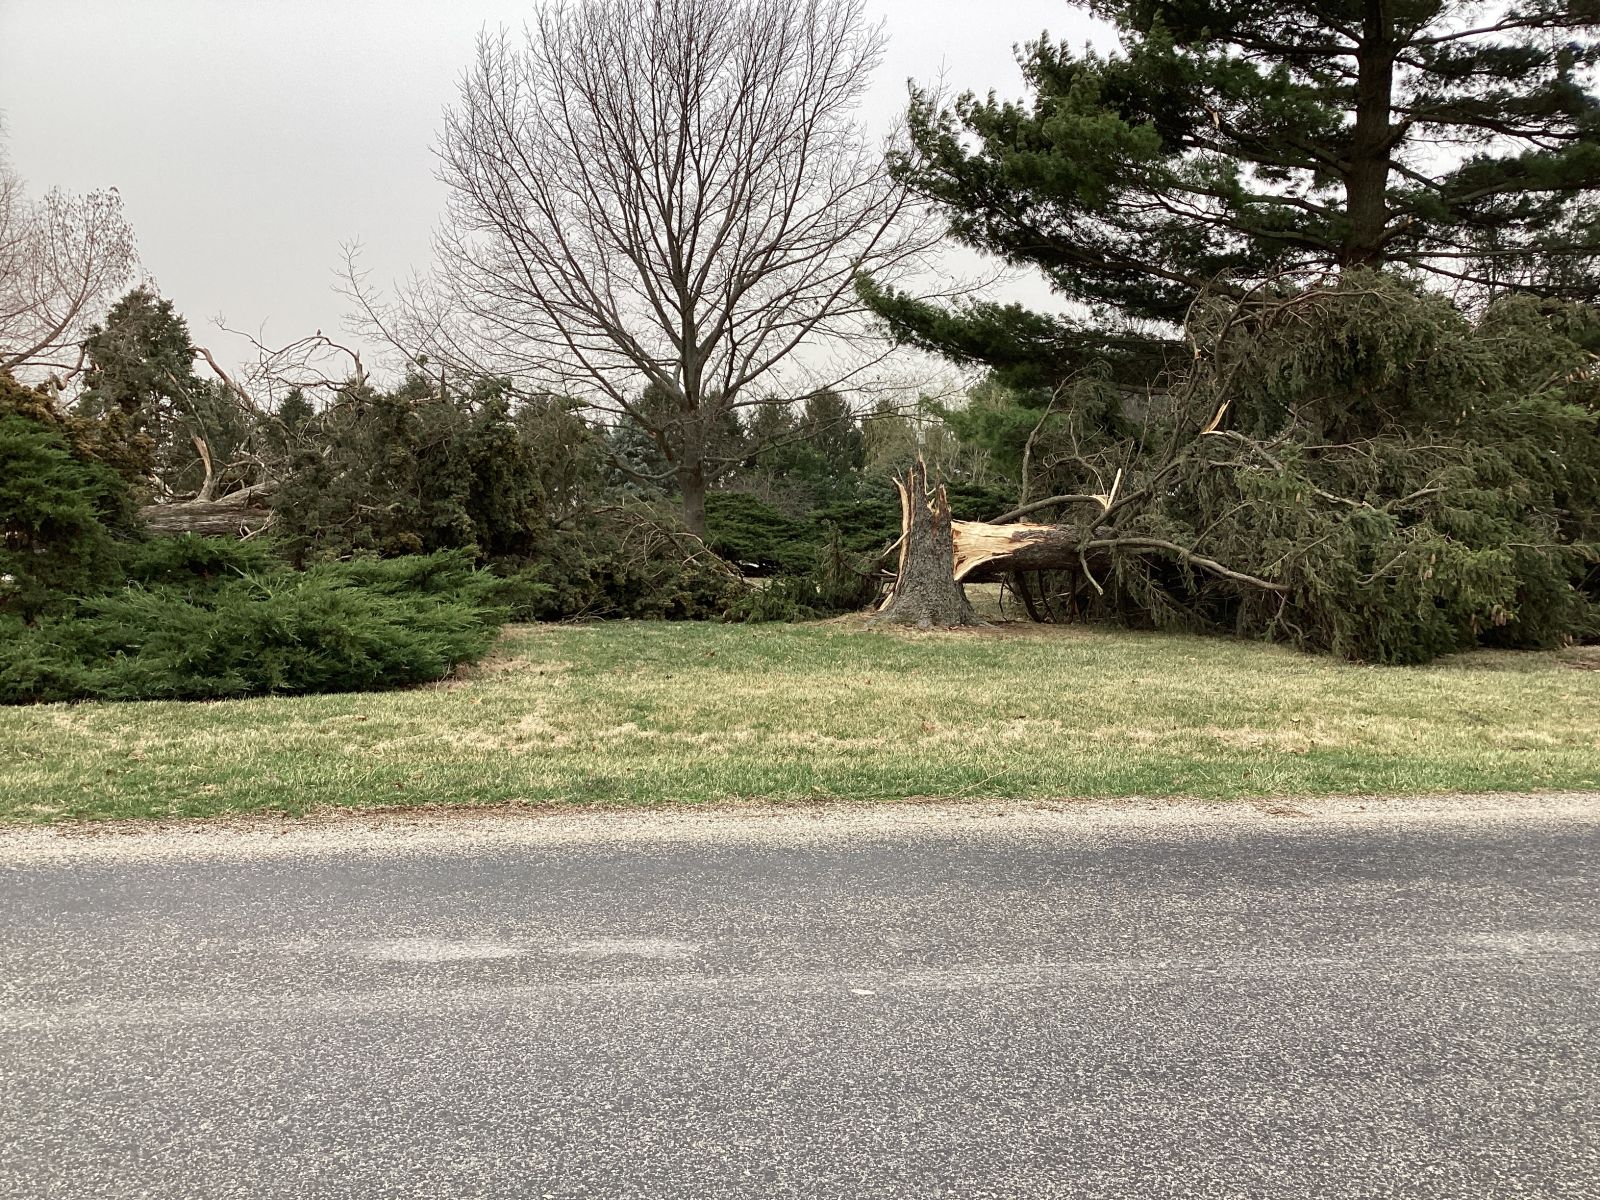
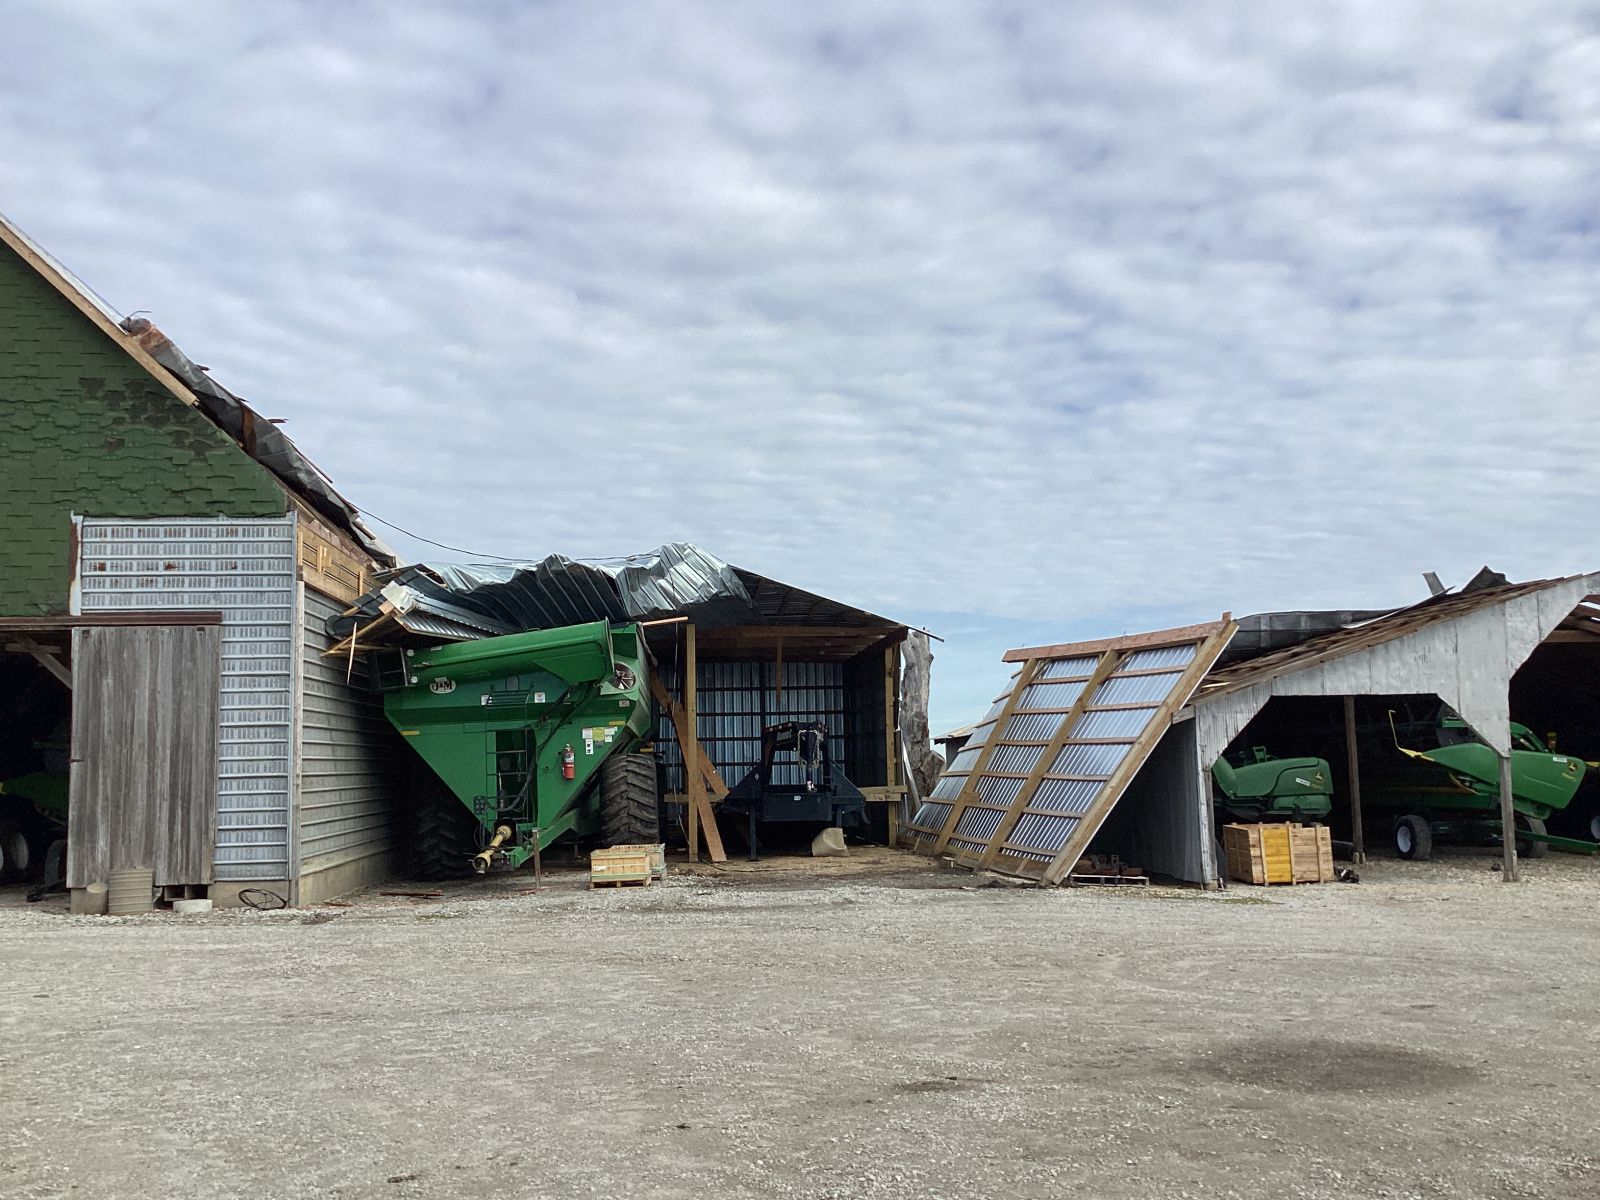
| Softwood tree trunks snapped along the path of the EF1 tornado about 3 miles north of Mattoon, IL. (NWS Survey) | Damage to a farm outbuilding about 1 mile southeast of Voorhies, IL along the track of the EF2 Hammond, IL tornado. (NWS Survey) |
Caption (source) |
Caption (source) |
Radar
 |
 |
 |
|
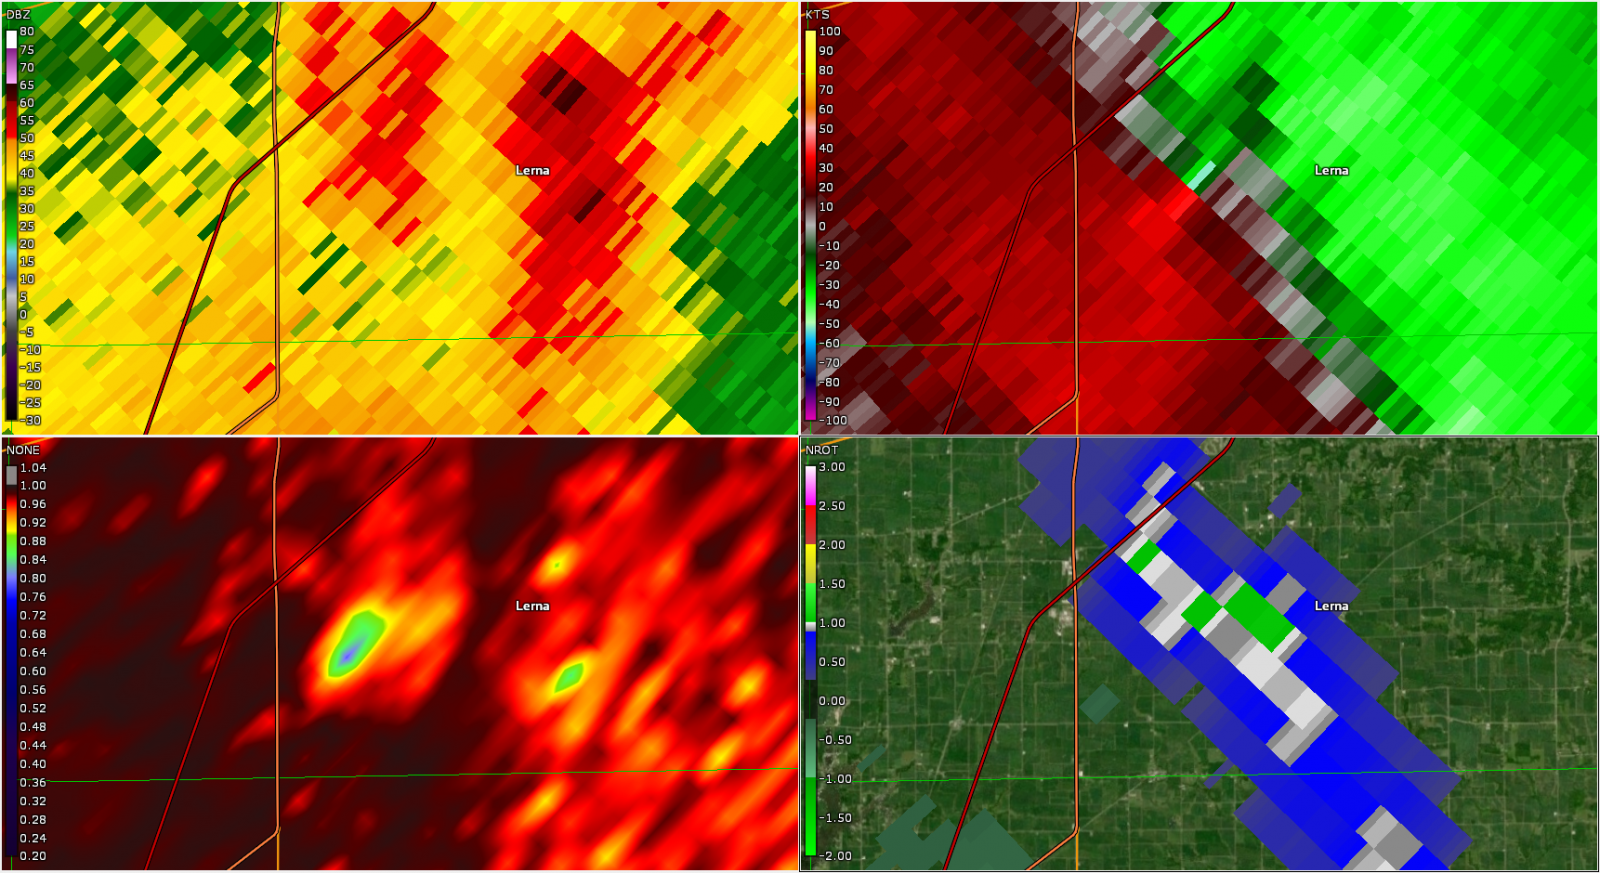
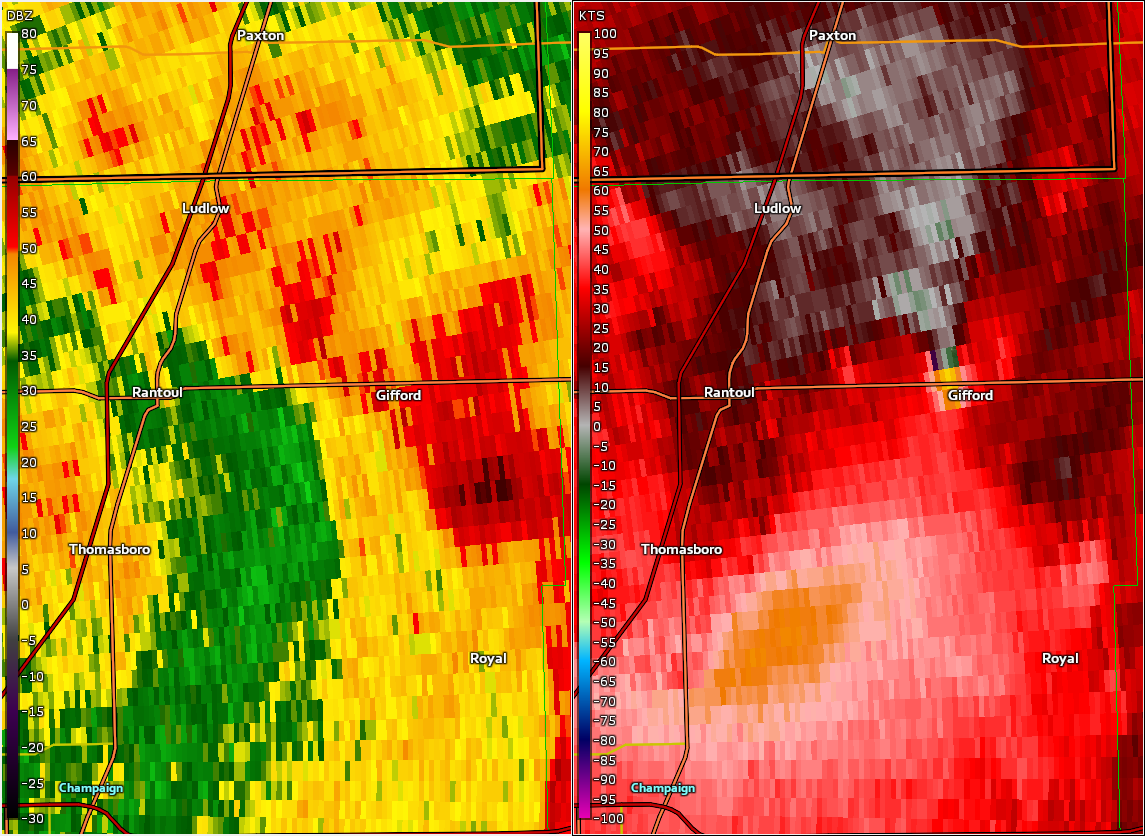
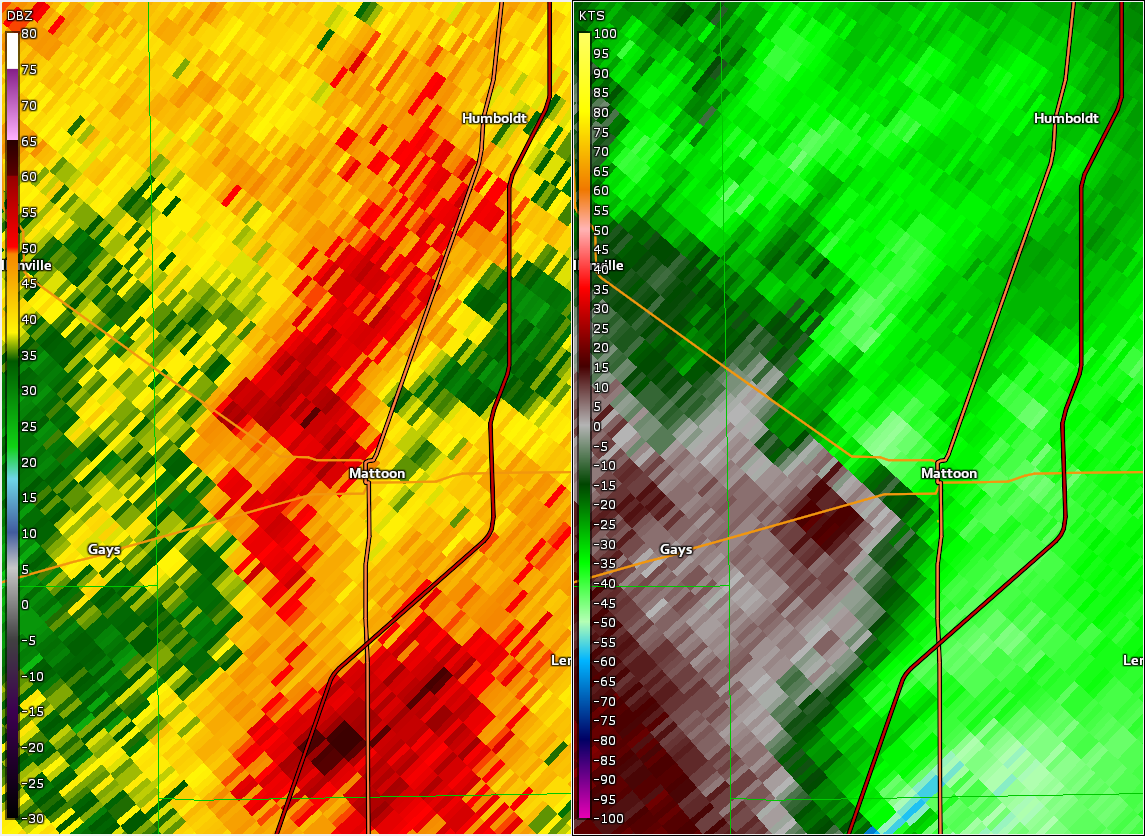
| Radar image near Lerna, IL at 12:13 AM CDT March 15 showing gate-to-gate rotation on storm relative velocity (upper right) co-located with a tornadic debris signature on correlation coefficient (lower left). | Reflectivity and storm relative velocity as the tornado passed through Gifford. Notice the enhanced velocity surge just northeast of Champaign. | Reflectivity and velocity showing broad rotation around the time of the brief tornado touchdown on the northwest side of Mattoon. Our radar was sampling ~5500 ft AGL, making it a challenge to know whether a tornado was in fact on the ground at the time. | Caption |
Additional Information
The Forecast
 |
 |
 |
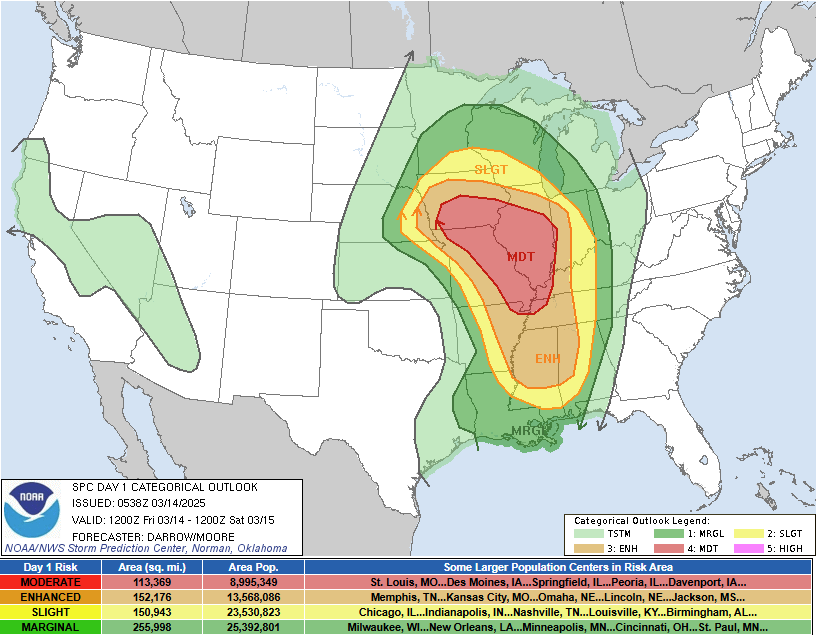 |
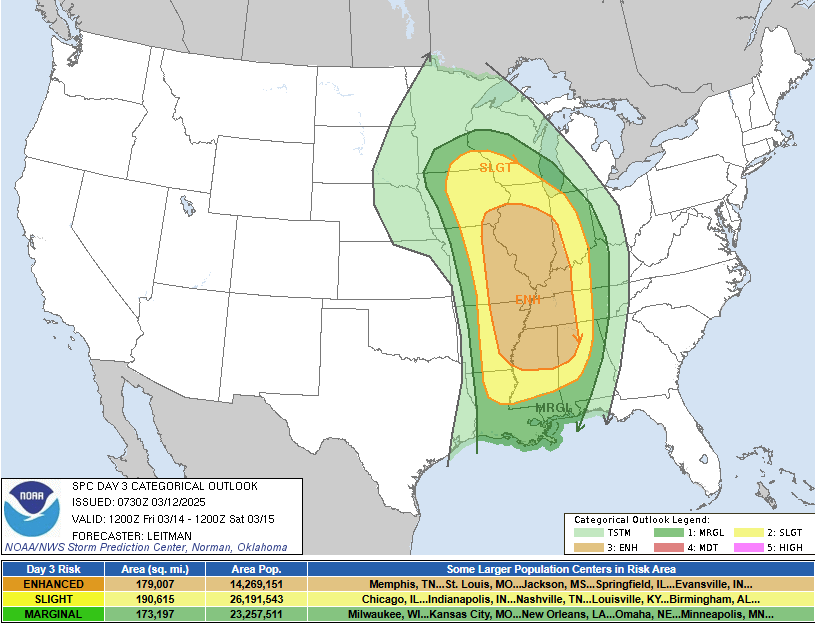
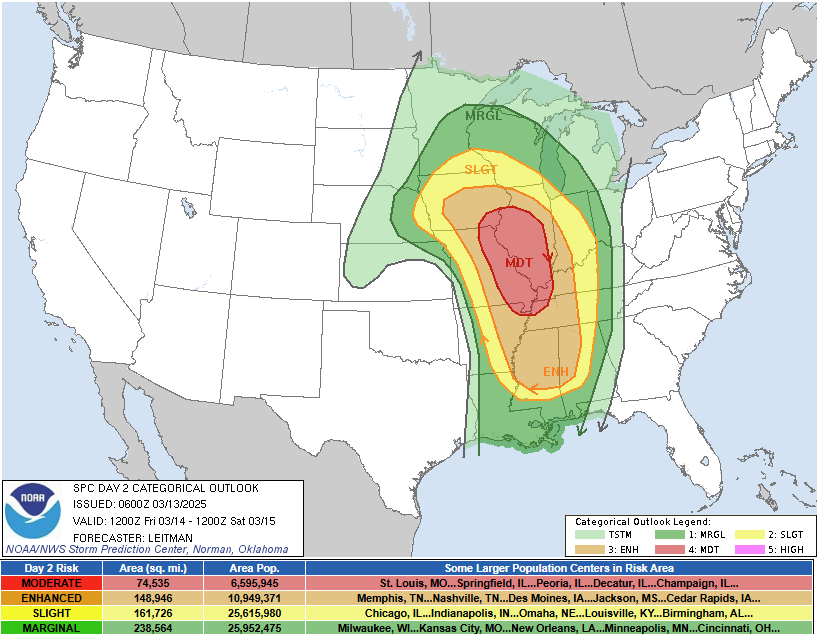
| Graphic showing the Storm Prediction Center's thunderstorm outlook 6 days ahead of the event. | SPC Day 3 Categorical Outlook issued March 12 at 0730Z. | SPC Day 2 Categorical Outlook issued March 13 at 0600Z. | SPC Day 1 Categorical Outlook issued March 14 at 1200Z. |
 |
 |
 |
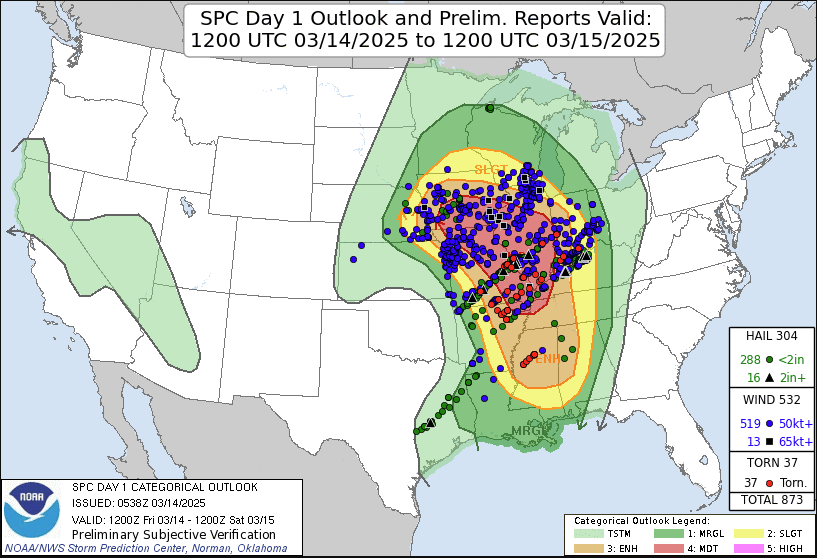 |
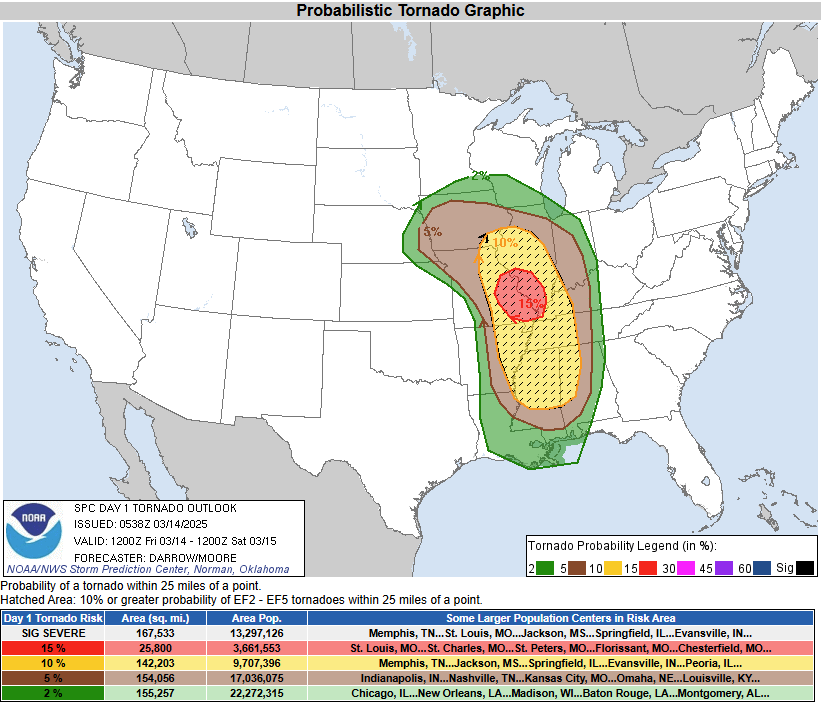
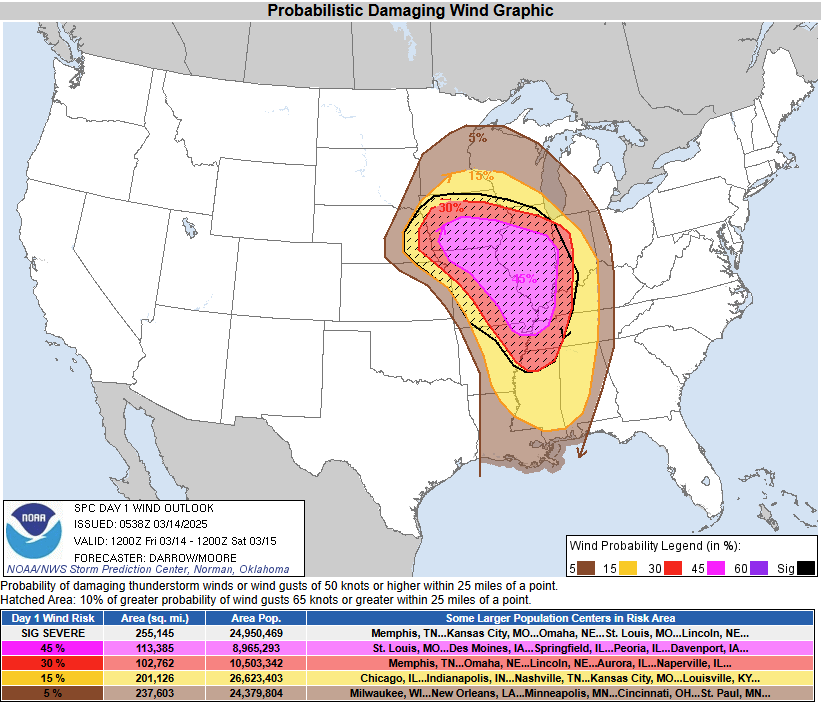
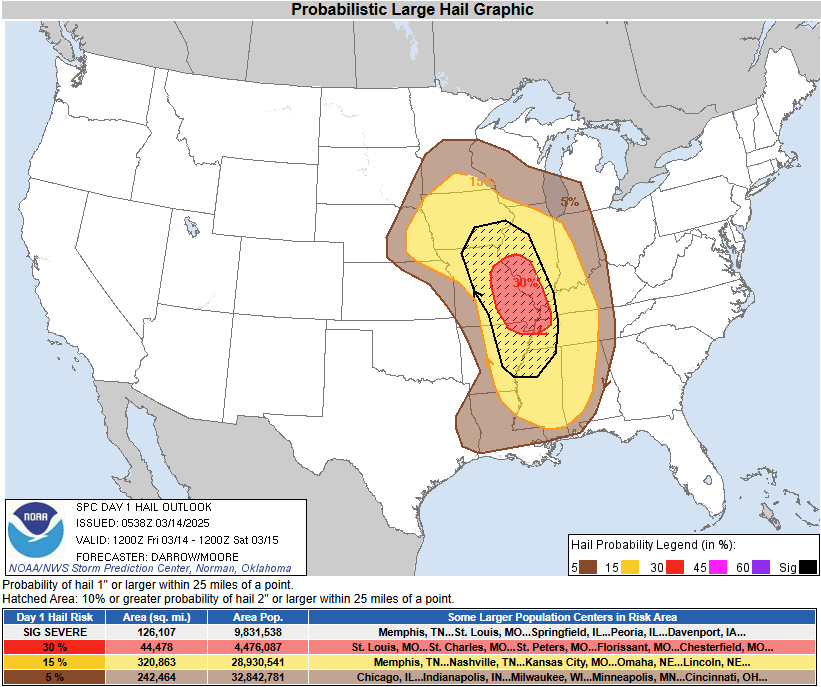
| SPC Day 1 Tornado Outlook issued March 12 at 1200Z. | SPC Day 1 Wind Outlook issued March 12 at 1200Z. | SPC Day 1 Hail Outlook issued March 12 at 1200Z. | SPC Day 1 Categorical Outlook with Storm Reports overlayed. |
 |
Media use of NWS Web News Stories is encouraged! Please acknowledge the NWS as the source of any news information accessed from this site. |
|