Summer is just around the corner and it looks like a hot one across eastern North and South Carolina. Outlooks from the NWS Climate Prediction Center show an increased potential for above-normal temperatures this summer across most of the United States. And in what may be a welcome reversal, the summer precipitation outlook shows an increased chance for above-normal rainfall from Florida across the Carolinas into the Mid Atlantic states.
|
2022 Summer temperature outlook |
2022 Summer rainfall outlook |
La Niña
The La Niña episode that began late last summer continues in the Pacific Ocean. La Niña is part of a naturally occurring oscillation in tropical Pacific water temperatures called the El Niño-Southern Oscillation (ENSO). Earlier in the year it was expected that La Niña would fade as spring turned to summer, but water temperatures along the equator south of Hawaii remain stubbornly below normal. Computer models now suggest there is greater than 50 percent chance La Niña will continue through this summer and into next winter.
The La Niña/El Nino climate oscillation has global climate impacts as it creates changes in wind, temperatures, rainfall, and tropical cyclone activity that extend well beyond the Pacific Ocean.
|
Global Ocean Water Temperature anomalies. The highlighted box across the tropical east Pacific Ocean shows below-normal water temperatures associated with La Niña. |
Temperature
La Niña by itself can bring above-normal summer temperatures across the eastern half of the United States. When rising temperature from climate change is factored in, the chances that this summer's temperatures will exceed their 1991-2020 average is quite high.
|
Correlation between La Niña and summer air temperatures. Yellow colors across the eastern U.S. indicate there is a fair degree of correlation between La Niña and above-normal temperatures. (La Niña is defined as the negative phase of ENSO, therefore ENSO and above-normal summer temperatures are inversely correlated) Source: NOAA PSL |
Trends in summer temperature expressed as degrees change per decade. Most of the Southeast U.S. has observed summer increases of +0.5° F per decade. Source: NCEI |
Soil temperatures are currently well above normal across the Carolinas and most of the eastern United States. Analysis graphics from the Climate Prediction Center show soil temperature anomalies of +3 to +5 degrees Celsius, or +5 to +9 degrees Fahrenheit, across the Carolinas. This is confirmed by local observervations from the NC Econet which have shown afternoon soil temperatures between 85 and 90 degrees throughout late May and early June.
Due to drought, soil moisture is well below normal across many of these same areas. Soil moisture helps regulate soil temperatures as evaporation of moisture consumes solar energy that would otherwise go into heating the ground. Soil and air temperatures influence one another and can create a feedback toward hot summer temperatures during periods of drought.
With such little moisture available to help keep the soil cool, local soil temperatures will likely remain very warm until significant rainfall develops. Agricultural impacts could become significant if these hot and dry conditions continue through June.
|
Source: Climate Prediction Center |
For every one degree Fahrenheit increase in observed daily average temperature during the summer, there is a 5 to 7 percent increase in energy usage for air conditioning. With increased potential for above-normal temperatures, there is also potential for increased energy usage with higher financial costs.
Rainfall
| Rainfall (and Deficits) | Wilmington, NC | Florence, SC | Myrtle Beach, SC |
| 1-month rainfall | 1.12" (-3.42") | 2.14" (-1.57") | 1.72" (-1.24") |
| 3-month rainfall | 6.82" (-4.76") | 9.34" (-0.56") | 7.96" (-1.36") |
| 6-month rainfall | 14.86" (-7.46") | 17.45" (-1.82") | 16.12" (-2.29") |
| 9-month rainfall | 27.03" (-11.51") | 21.11" (-8.45") | 20.77" (-11.24") |
Much of coastal North and South Carolina remains in a moderate to severe drought. Rainfall deficits began to build last fall and as of June 1 accumulated totals are nearly 12 inches below normal in Wilmington and Myrtle Beach.
Rainfall amounts typically increase during summer as daytime thunderstorms become more common with the arrival of tropical heat and humidity. Our climatologically wettest months of the year are June through September as thunderstorms and tropical cyclone activity reach their peak.
|
National Drought Monitor as of May 24, 2022. Moderate to Severe Drought covers large sections of eastern North and South Carolina east of Interstate 95. |

Climate Prediction Center Drought Outlook showing the expectation for improving drought conditions this summer |
Assuming substantial rainfall does develop this summer, CPC climatologists suggest drought conditions will improve or even disappear across the eastern portions of North and South Carolina.
|
Official NOAA seasonal outlook for Atlantic tropical cyclone activity for 2022. More information is available at https://www.cpc.ncep.noaa.gov/products/outlooks/hurricane.shtml |
Hurricane Season
The official Atlantic Hurricane Season begins June 1 and lasts through November 30. The bulk of our significant local hurricane impacts have occurred in early fall, however summer can still bring destructive storms across eastern North and South Carolina. Some of our more notable summer hurricane strikes include:
NOAA's official seasonal outlook is for a 65 percent chance of an above-normal season with 14 to 21 named tropical storms. Between six and 10 storms are expected to strengthen into hurricanes, and three to six of those are expected to become major (category 3+) hurricanes with winds in excess of 111 mph. This could be the seventh consecutive season of above-normal Atlantic tropical cyclone activity.
The biggest factor affecting this year's hurricane season is the continuing La Niña in the eastern tropical Pacific Ocean. La Niña reduces the coverage of thunderstorms over the eastern Pacific Ocean and this leads to less downstream wind shear across the Atlantic Ocean. A low-shear environment gives Atlantic tropical cyclones a better chance to form and strengthen.
Another important factor is above-normal water temperatures covering a good portion of the North Atlantic Ocean and Gulf of America. A large area between Bermuda and the Carolinas is particularly warm with water temperatures in early June running 2° to 4° F above normal. Warm ocean water is the ultimate energy source for tropical cyclones and hotter water temperatures will, in general, support stronger storms.
|
Sea surface temperature anomalies as of the end of May 2022. There is a large area of very warm ocean water relative to normal between the Carolina coastline and Bermuda. Source: https://coralreefwatch.noaa.gov/product/vs/map.php |
Hurricanes do not have to directly strike the Carolinas to create local impacts. Large waves generated by hurricanes hundreds or even thousands of miles offshore can create hazardous rip currents and large surf on our beaches. You can always check the latest local beach forecasts at https://www.weather.gov/beach/ilm
Coastal Flooding and River Flooding
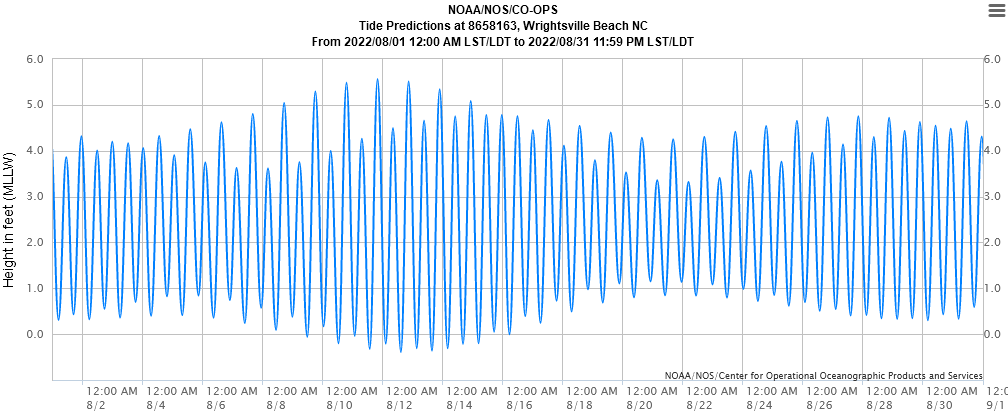
This summer the highest astronomical tides will occur during Full Moons between June 11-17, July 11-16, and August 9-13. Sustained onshore winds occurring within these times could easily produce minor coastal flooding. If a tropical storm or hurricane were to strike, the severity of storm surge and coastal flooding would be enhanced by the higher astronomical tides.
|
June 2022 astronomical tides |
July 2022 astronomical tides |
August 2022 astronomical tides |
Both North and South Carolina have developed programs to help understand and document the increasing occurrence of coastal flooding. If you are in North Carolina, please consider participating in the King Tides Project. And if you are in South Carolina, click here to participate in the King Tides Initiative. A "king tide" is a non-scientific term increasingly being used to describe exceptionally high tides. NOAA's National Ocean Service has created a resource describing more about King Tides.
Due to the ongoing drought, river levels are very low across eastern North and South Carolina. Probabilistic flood forecasts from the Southeast River Forecast Center show less than a 10% weekly chance of flooding now through August along the Waccamaw River at Conway, the Lumber River at Lumberton, the Black Creek at Quinby, and the Northeast Cape Fear River at Burgaw.
Additional Links of Interest
Research and Page Author: Tim Armstrong
Last Updated: June 9, 2022


 Coastal Flood