|
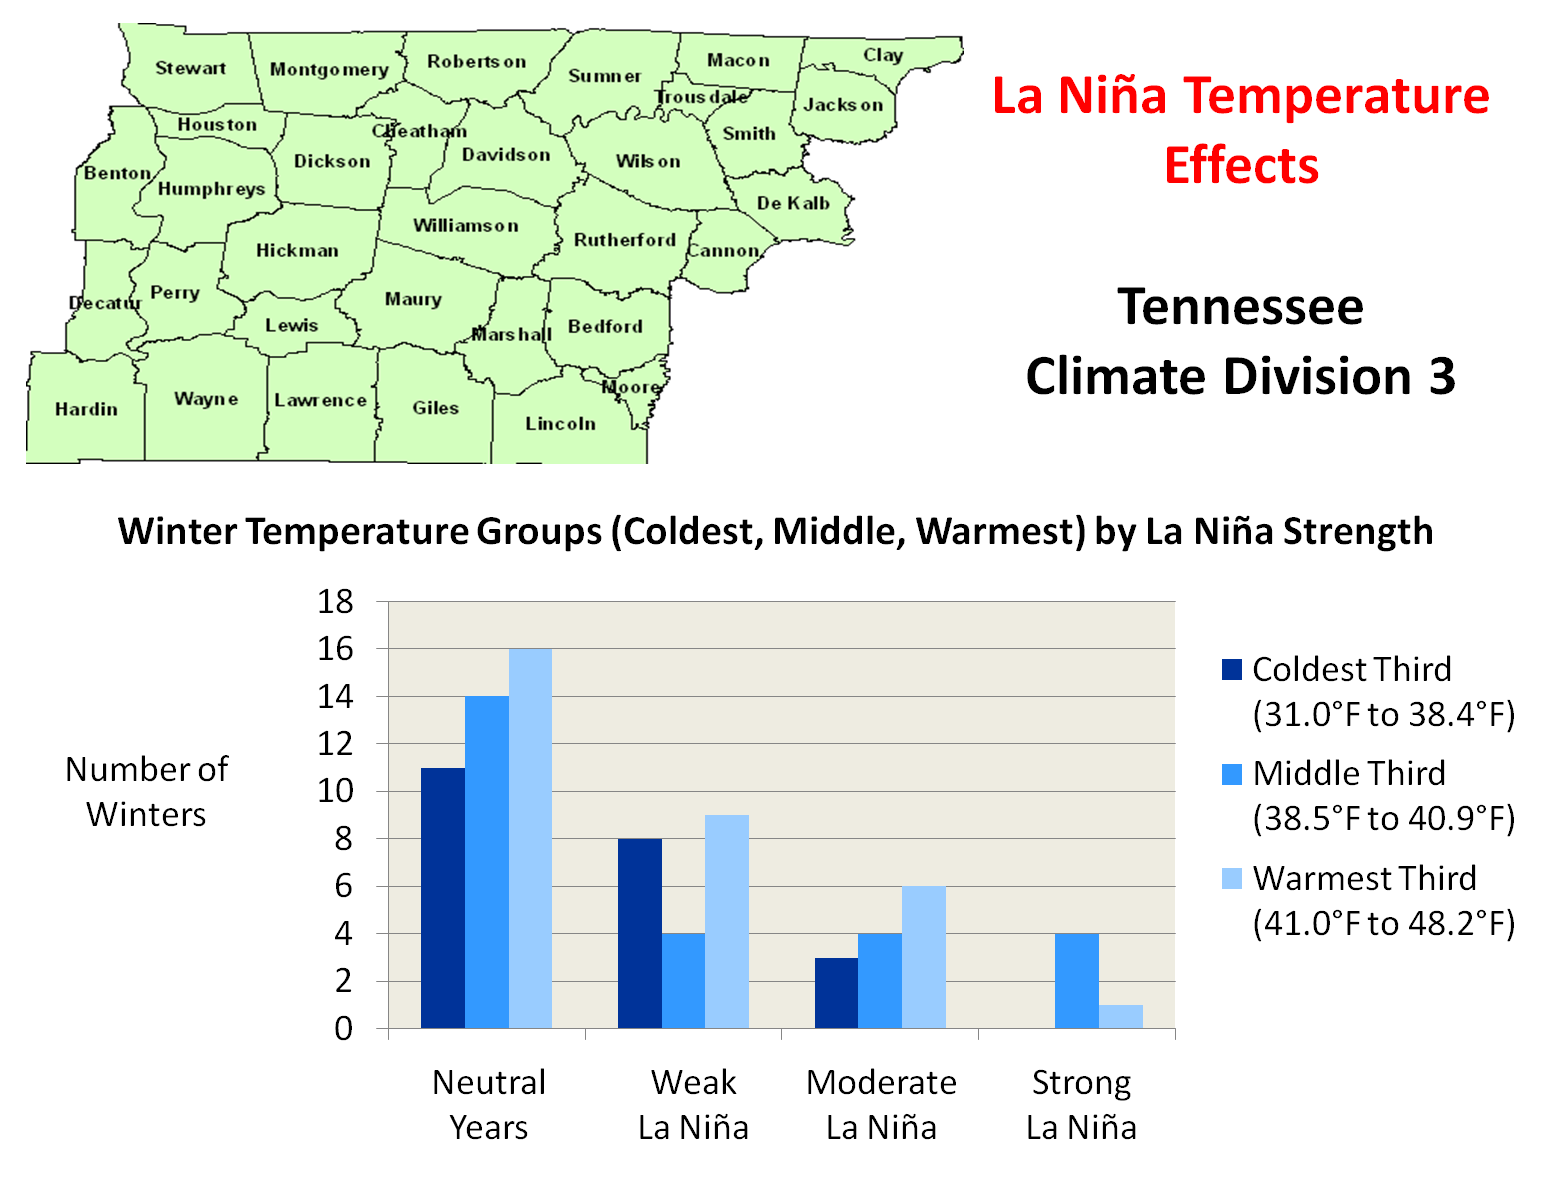
The graph below details temperature impacts during the winter months (December through February) associated with La Niñas of the indicated intensity in Tennessee Climate Division 3. The winter temperatures are divided into terciles, or the coldest third, the middle third, and the warmest third of all winters. The temperatures associated with these groups are indicated on the graph. For example, for all winters since 1896 for this climate division, the coldest third had average temperatures of 31.0°F to 38.4°F. It will be important to pay particular attention to La Niñas of strong intensity, since that is the anticipated magnitude of this winter's event. Notice in the graph below, for example, that not a single winter during all of the strong La Niña events since 1896 were among the coldest third, in similarity to the northern Alabama Climate Divisions. In fact, of the 5 winters during strong La Niñas, four were in the middle third and one was in the warmest third of all winters. This does not necessarily mean that temperatures this winter in across much of middle Tennessee are guaranteed to rank in the middle or warmest third of all winters, but that certainly has been the trend in past.
|
 |
|
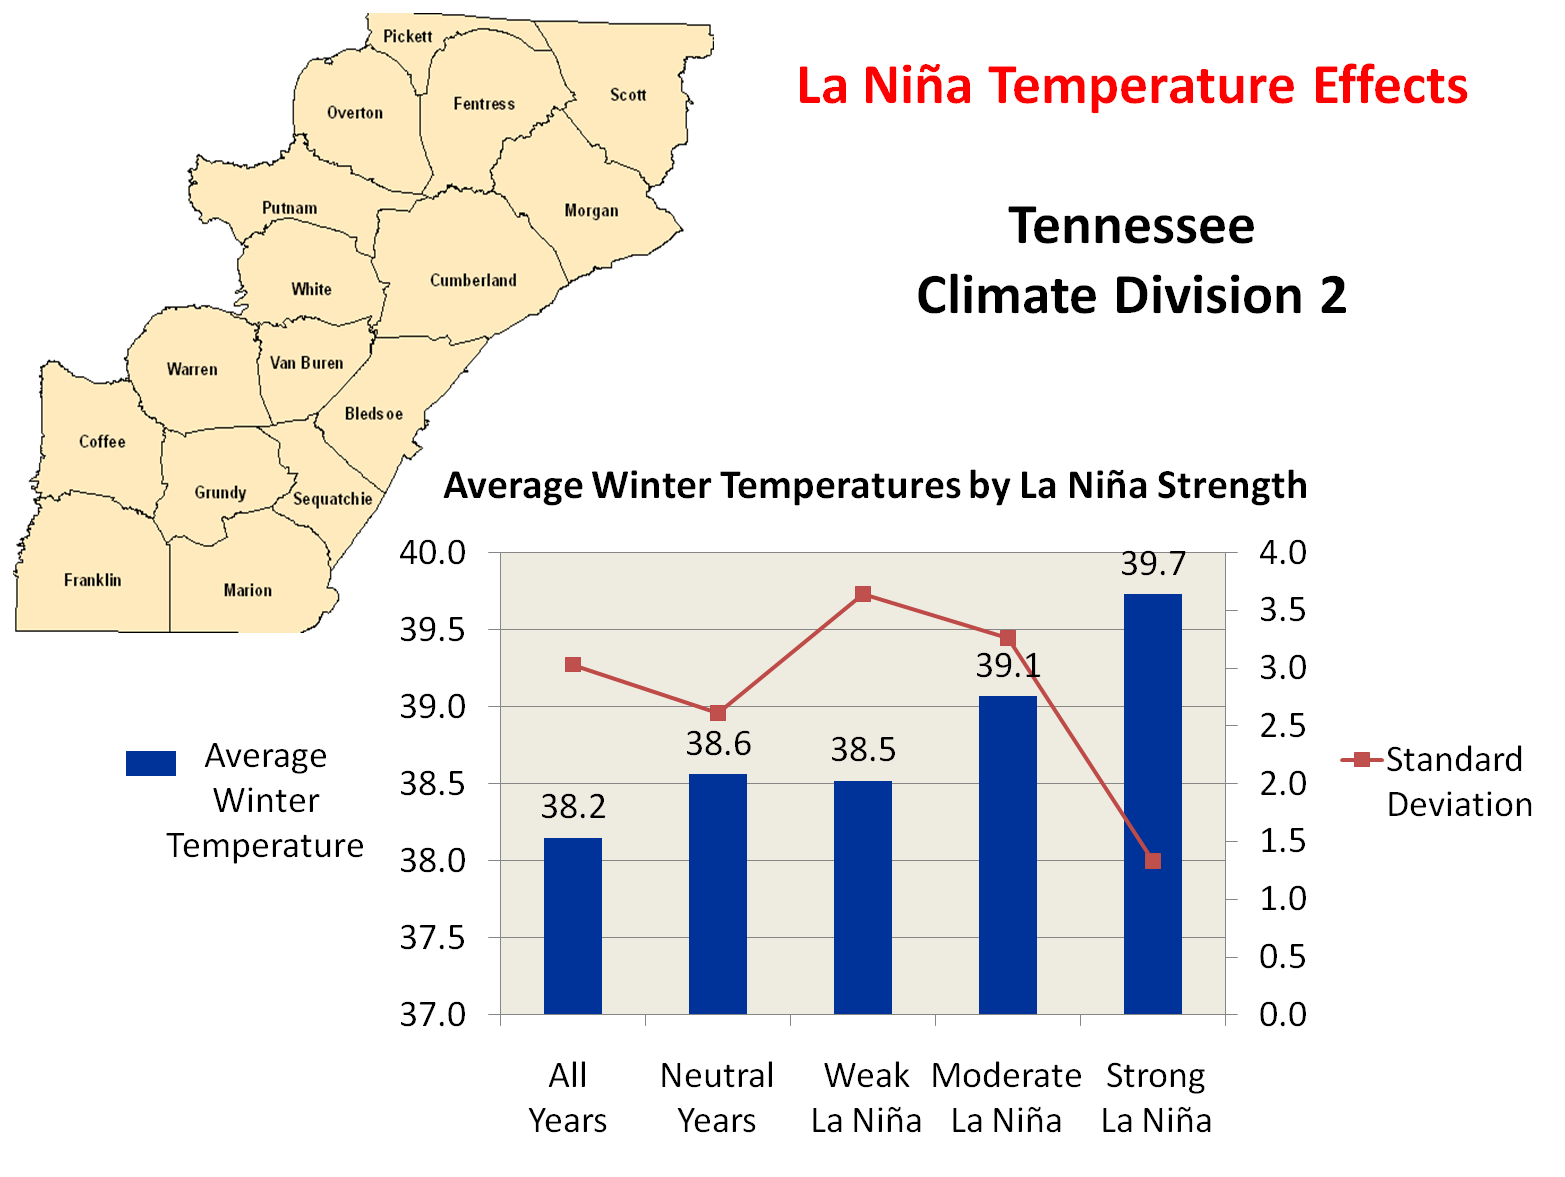
The graph below shows La Niña's effect on average winter temperatures since 1896. Notice that average temperatures are 1.5 °F warmer during strong La Niña events compared to the average temperature for all winters. Interestingly, notice that the standard deviation, or variability, of average winter temperatures decreases significantly in strong La Niña winters. These factors suggest higher confidence that winter temperatures will be above the long-term average value during strong La Niñas.
|
 |


 Local Radar
 Weather Map