|
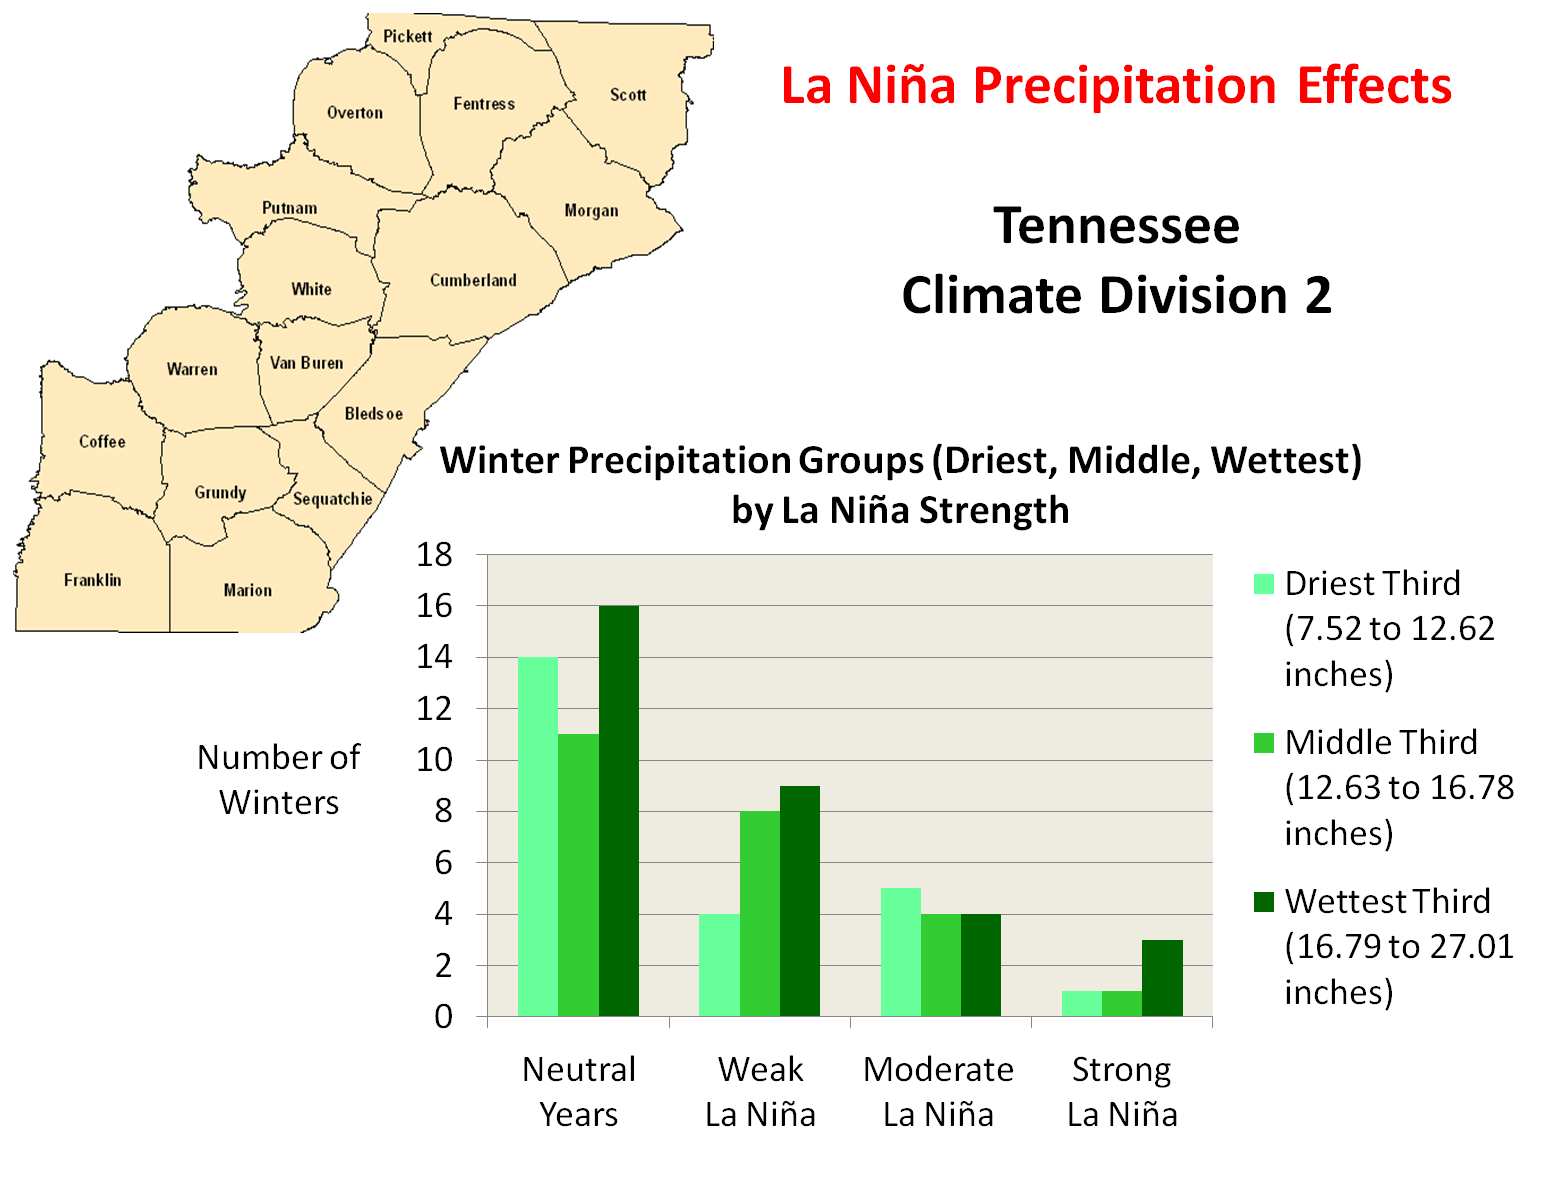
The graph below details impacts during the winter months (December through February) associated with La Niñas of the indicated intensity in Tennessee Climate Division 2. Winter precipitation is divided into terciles, or the driest third, the middle third, and the wettest third of all winters. The precipitation totals associated with these groups are indicated on the graph. For example, for all winters since 1896 for this climate division, the driest third had winter season precipitation totals of 7.52 inches to 12.62 inches. It is important to pay particular attention to La Niñas of strong intensity, since that is the anticipated magnitude of this winter's event. Notice in the graph below, for example, that the majority of winters during strong La Niña events since 1896 were among the wettest third. Of the 5 winters during strong La Niñas, three were in the wettest third, and one each in the middle and driest third of all winters since 1896. Thus, while wetter winters appear to be preferred during this mode of La Niña, there is no guarantee that they will even rank among the wettest third of all on record. |
 |
|
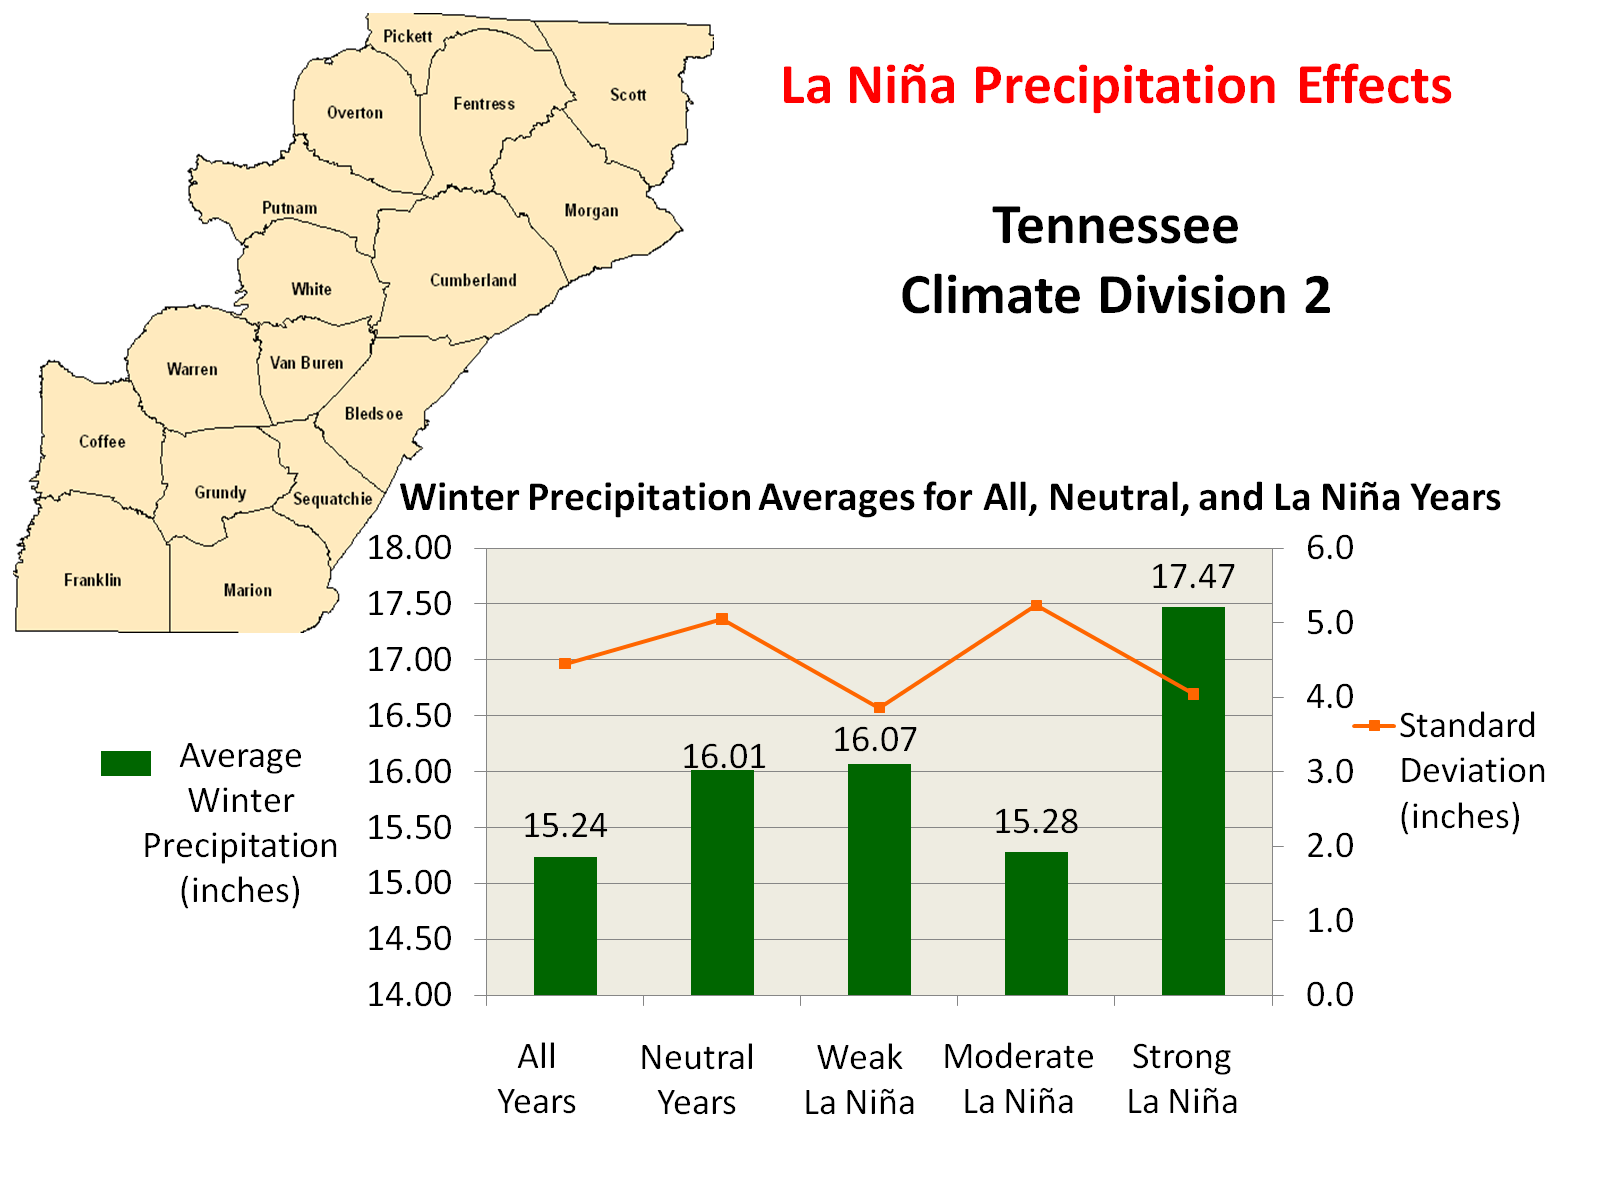
The graph below shows La Niña's effect on average winter precipitation since 1896. Notice that average precipitation decreases fairly markedly during moderate La Niñas, but that an upward trend is noted as La Niña conditions strengthen. Unlike the Alabama climate divisions though, the standard deviation value is relatively low during strong events, especially when compared to moderate La Niña winters. These factors indicate that relatively low variability of precipitation is observed in the Cumberland Plateau region of middle Tennessee during strong La Niña winters and that precipitation is typically higher than average. |
 |


 Local Radar
 Weather Map