|
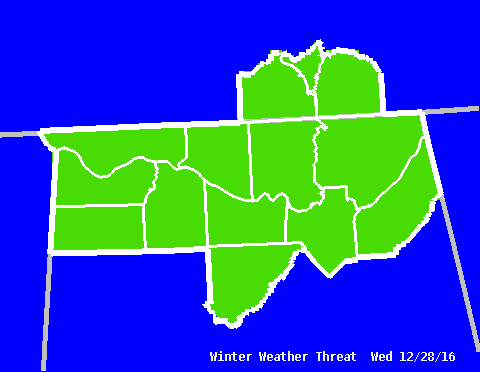
The winter threat categorical graphic shows the worst expected intensity of any wintry precipitation that may develop.
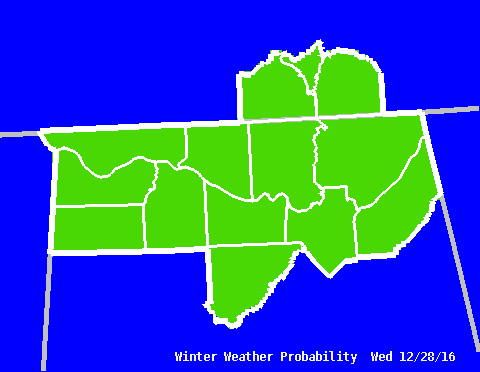
The probability of winter weather graphic reflects the probability of that winter weather occurring.
For example, if the categorical graphic is light orange, which depicts a "minor" threat, and the probability grid says "40", then there is a 40% probability of light accumulations (less than 1/2" of snow, or a trace of ice or sleet, as defined by the category's threshold).
Note to those familiar with the probability of precipitation concept: the winter weather probability graphic may or may not be identical to the normal PoP, which reflects the probability of any precipitation, not just wintry precipitation.
|


 Local Radar
 Weather Map