|
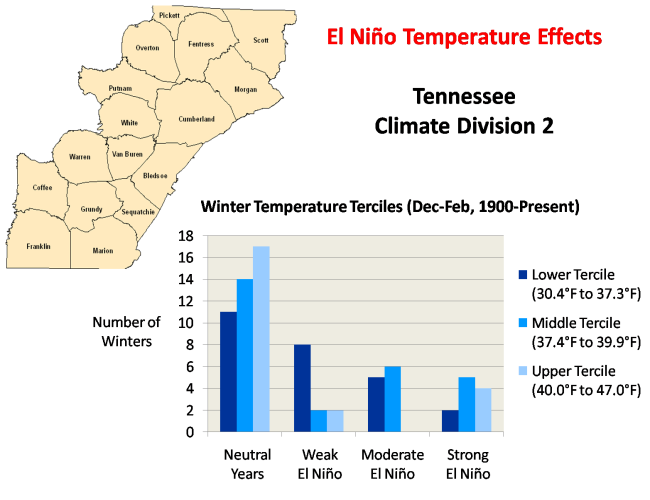
The graph below details impacts during the winter months (December through February) associated with El Niños of the indicated intensity in Tennessee climate division 2. The winter temperatures are divided into terciles, or the coolest third, the middle third, and the warmest third of all winters. The temperatures associated with these groups are indicated on the graph. For example, for all winters since 1900 for this climate division, the coolest third had average temperatures of 30.4°F to 37.3°F. It will be important to pay particular attention to El Niños of moderate intensity, since that is the anticipated magnitude of this winter's event. Notice in the graph below, for example, that not a single winter during all of the moderate El Niño events since 1900 experienced temperatures in the warmest tercile. In fact, of the 11 winters during moderate El Niño events, five were in the coolest third of all winters, and the remaining six were in the middle tercile. This does not necessarily mean that temperatures this winter are guaranteed to be in the lowest or middle third of all winters, but that certainly has been the trend in past.
|
 |
|
The graph below shows El Niño's effect on average winter temperatures since 1900. Notice that average temperatures drop off markedly during weak El Niño events vs. neutral conditions, and that an upward trend in temperatures is noted as El Niño conditions strengthen. Still, average winter temperatures are more than 2.0°F cooler for moderate El Niño events when compared to neutral years. Also, notice that the standard deviation, or variability, of winter temperatures decreases as the El Niño becomes increasingly strong. In fact, winter temperatures during neutral years are nearly one standard deviation above winter temperatures during moderate El Niño years.
|
 |


 Local Radar
 Weather Map