
STORM SIGNALS
Fall 1999, Vol. 53
CONTENTS

This edition of Storm Signals was printed by BP AMOCO, Texas City Site as a service to the citizens of Southeast Texas and the upper Texas coastal area.

1999 HURRICANE SEASON
By Josh Lichter
Through the middle of October, the 1999 Hurricane Season has seen seven hurricanes and three tropical storms. Four of the seven hurricanes were classified as major hurricanes with sustained winds greater than 115 mph. Of particular note was September's Hurricane Floyd which caused tremendous flood damage and numerous deaths in North Carolina and an October tropical depression that caused devastating and deadly floods and landslides in Southeast Mexico. The state of Texas could not escape August's Hurricane Bret. This landfalling hurricane was the first for the state in nearly ten years. The following is a month-by -month description of tropical cyclone activity this year from the National Hurricane Center's monthly tropical weather summaries and from data compiled here at our office.
JUNE...
Tropical Storm Arlene was the only tropical cyclone in the Atlantic basin during the month of June. On average, one tropical storm or hurricane is observed during June every two years. Arlene originated in the subtropical Atlantic about 550 miles southeast of Bermuda from a non-tropical disturbance along the remains of a front on June 11th. It strengthened into a tropical storm the following day while drifting northward. Arlene threatened Bermuda but passed about 100 miles to the east and did not significantly impact these islands. Arlene dissipated on the 18th to the northeast of Bermuda.
JULY...
There were no tropical storms or hurricanes during the month of July. This is not abnormal since, on average, only one tropical storm or hurricane is observed during July every two years.
Tropical Depression Two formed over the extreme southwest Gulf of America on July 2nd from a tropical wave that was tracked from the coast of African on June 20th, into the western Caribbean Sea on June 30th, and across the Yucatan peninsula on July 1st. Soon after developing, the system moved westward and made landfall on the coast of Mexico about 40 miles south-southeast of Tuxpan late on the 2nd. It dissipated over the mountains of Mexico early on the 3rd. There were reports of up to twelve inches of rain over Mexico, but no known casualties or damage.
There was one other significant tropical weather system during July, a very strong tropical wave that nearly became a tropical cyclone. This wave moved off the coast of Africa on July 3rd and moved rapidly westward across the tropical Atlantic basin. It produced winds to tropical storm force in squalls across the Caribbean. As the system neared Honduras late on July 10th, it became better organized, but its development was halted by movement over land. The system ultimately spawned tropical depression #3E in the eastern Pacific.
AUGUST...
Four tropical cyclones formed in the Atlantic basin during the month of August, two of which reached Saffir-Simpson category four strength. Bret formed in the southern Gulf of America on the 18th about 310 miles east-southeast of Tampico, Mexico, and reached tropical storm strength during the afternoon of the 19th. Bret moved on a northward track and became a hurricane late on the 20th. Bret turned toward the west-northwest during the 22nd, and is estimated to have reached its peak intensity of 140 mph - category four on the Saffir-Simpson hurricane scale - on the morning of the 22nd about 100 miles east of the south Texas coast. Bret made landfall later that evening as a category three hurricane with maximum sustained winds of 125 mph in a sparsely populated area midway between Brownsville and Corpus Christi. Bret gradually weakened while producing heavy rains as it moved slowly west-northwest over extreme southern Texas.
The state of Texas had gone nine straight seasons without a landfalling hurricane. 1989 was the last year that Texas saw a hurricane when both Chantal and Jerry stuck the state. Bret was a major hurricane - category three on the Saffir-Simpson hurricane scale - making him the first major hurricane to strike the Lone Star State since Hurricane Alicia slammed into the upper Texas coast in August 1983.
Bret made landfall in Kenedy County, roughly halfway between Corpus Christi and Brownsville, which is one of the most unpopulated and undeveloped counties along the Texas coast. Bret's wind structure was small with hurricane force winds confined to a small area near the eye of the system. This compact structure kept damage costs on the low side. Preliminary estimates place Bret's total damage at $15 million. In comparison, 1998's Tropical Storm Frances caused $287 million damage to the middle and upper Texas coast - nearly thirty times the amount of Bret! If Bret had made landfall a little further north toward Corpus Christi or a little further south toward Brownsville, damage would have undoubtedly been much higher.
Cindy formed in the eastern tropical Atlantic near the Cape Verde Islands late on the 18th, intensified to a tropical storm on the afternoon of the 20th, and became a hurricane late on the 21st. By the 22nd, Cindy began experiencing strong easterly vertical shear and was downgraded to a tropical storm that afternoon. The shear relaxed on the 25th and Cindy regained hurricane status later that day. The hurricane reached its peak intensity of 140 mph - category four - on the morning of the 28th. Cindy moved west-northwest through the 24th, and then northwest from the 25th through the 28th. On the 29th, the system turned northeast and began to accelerate on the 30th. Cindy was declared extratropical on the morning of the 31st as she merged with a mid latitude low over the North Atlantic about 985 miles west of the Azores.
Dennis formed in the western Atlantic a couple hundred miles east of the Turks and Caicos Islands late on the 23rd. The system moved slowly west-northwest to northwest for the next five days, becoming a tropical storm on the afternoon of the 24th, and a hurricane early on the 26th. Dennis reached a peak intensity of 105 mph - category two - on the afternoon of the 28th and maintained this intensity until early on the 30th while paralleling the lower southeast U.S. coast. The hurricane lashed the North Carolina coast on the 30th and part of the 31st with sustained tropical storm force winds (with gusts to hurricane force), large waves and high surf. The hurricane turned northeastward away from the coast on the morning of the 30th, then began to accelerate later that day while moving to the east-northeast. Dennis stalled about 150 miles east of Cape Hatteras, North Carolina on the morning of the 31st and then began to drift westward and weaken. As the month concluded, Tropical Storm Dennis was drifting westward about 100 miles east of Cape Hatteras.
Emily formed about 400 miles east of the Windward Islands on the afternoon of the 24th. The system was upgraded to a tropical storm based on data received from an Air Force reserve reconnaissance aircraft. By the 26th, Hurricane Cindy began to disrupt the small circulation of Emily, and Emily was downgraded to a depression that afternoon while moving northwestward. Emily turned northward on the 27th, and briefly regained tropical storm status. However, the interaction with Cindy continued to take its toll and Emily was absorbed into the circulation of Cindy on the 28th.
Through the end of August, 1999 season activity had been slightly above average with five named storms - three of which became hurricanes. Two of the three hurricanes reached major hurricane status. An average season would have produced four named storms, two hurricanes, and no major hurricanes by September 1st.
SEPTEMBER...
Four tropical cyclones - two hurricanes, one tropical storm and one tropical depression - formed in the Atlantic basin during September 1999. In addition, Tropical Storm Dennis was in progress as the month commenced. After lashing the coast of North Carolina as a hurricane at the end of August, Tropical Storm Dennis meandered about 90 to 100 miles east and southeast of Cape Hatteras, North Carolina through September 2nd. By September 4th, Dennis re-intensified as it turned back toward the coast and made landfall as a 70 mph tropical storm on the North Carolina Outer Banks about 35 miles east-northeast of Morehead City. Dennis weakened to a depression early on the 5th while moving northeastward into north central North Carolina, and dissipated in south central Virginia on September 6th.
Tropical Depression Seven developed in the southwest Gulf of America on September 5th about 80 miles east- southeast of Tampico, Mexico. The system began drifting to the north-northwest, then northwest at 5 to 10 mph before making landfall with 35 mph winds in northeast Mexico on the morning of the 6th about 45 miles east of Ciudad Victoria. Once inland, the depression moved slowly northwestward producing heavy rains over portions of northeast Mexico and extreme South Texas before dissipating over northern Mexico on the 8th.
Floyd formed from a tropical wave which moved off the coast of Africa on September 2nd. The system became a tropical depression on September 7th about 1000 miles east of the Lesser Antilles. It strengthened into a tropical storm early the next day while located about 850 miles east of the Lesser Antilles and into a hurricane about 240 miles northeast of the northern Leeward Islands. Floyd turned from a westward to a northwestward course, and its intensification trend temporarily halted. However, as Floyd turned back to the west, it strengthened into a major hurricane, and then to a strong category four hurricane with 155 mph winds. Weakening only slightly, the hurricane ravaged portions of the central and northwest Bahamas on September 13th-14th, and posed a serious threat to Florida.
Floyd turned to a northwestward and northward course while slowly weakening, eventually making landfall near Cape Fear, North Carolina as a category two hurricane around 230 AM EDT on September 16th. The hurricane moved over the eastern part of that state and accelerated north- northwestward up the coast, weakening to a tropical storm before moving into New England and losing its tropical characteristics early on the 17th. Floyd was responsible for massive inland flooding over portions of the eastern United States - particularly in North Carolina. The current death toll as reported by the media - 75 - would make this the deadliest United States tropical cyclone since Agnes of 1972. The damage toll is incomplete but is at least $6 billion.
Gert formed over the eastern Atlantic about 175 miles south of the Cape Verde Islands on September 11th, and became a tropical storm on the 12th while centered about 560 miles west of the Cape Verde Islands. Gert moved toward the west and strengthened into a hurricane about 1400 miles east of the Lesser Antilles on September 13th. Gert continued to strengthen and became the fourth major hurricane of the season, reaching a peak intensity on the 15th about 750 miles east of the Leeward Islands with winds near 150 mph. Gert maintained major hurricane status for several days. It turned northwest and then northward, and passed 130 miles to the east of Bermuda on the 21st as a strong category two hurricane. Gusts to hurricane force were experienced on Bermuda. Gert then turned north- northeastward and accelerated into the far North Atlantic, passing just east of Newfoundland on September 23rd, where large waves caused some damage.
Harvey formed from a tropical wave which moved through the Caribbean Sea and into the Gulf of America. The system became a tropical depression on September 19th over the central Gulf and began to move toward the east-northeast. Despite hostile upper-level westerly winds, the cyclone became a tropical storm while centered about 315 miles south -southeast of New Orleans. Peak winds reached 60 mph while Harvey was located about 250 miles west-southwest of Tampa, Florida. The storm took an abrupt turn toward the southeast and weakened before moving inland south of Naples, Florida. Harvey produced tropical storm force winds over portions of the Keys and extreme South Florida as it moved across the peninsula. The cyclone was then absorbed by a frontal system just off the southeast Florida coast.
Through the end of September, eight named storms, five hurricanes, and four major hurricanes had developed. In an average season, there would have been seven named storms, four hurricanes, and two major hurricanes.
OCTOBER...
Through the last week of October, two more tropical depressions and Hurricanes Irene and Jose developed. Tropical Depression Eleven developed from a westward moving tropical disturbance that tracked from the western Caribbean westward across the Yucatan peninsula and into the southwestern Gulf of America. The system reached depression status on October 4th in the southwestern Gulf of America and took a general northwest drift for the next two days. The system never intensified to tropical storm status, and was declared dissipated on the 6th about 150 miles northeast of Veracruz, Mexico. Despite remaining a tropical depression, this system produced extremely heavy rains across southeast Mexico, and as of this date is the deadliest tropical system this year. As many as 400 people in Southeast Mexico were killed as a result of the rains that washed out bridges and roads and caused deadly landslides. At least 111 of the fatalities were in Veracruz, Mexico. Final totals on deaths and damage are still being determined.
Tropical Depression Twelve had a short three day life out in the Atlantic Ocean about half way between the Lesser Antilles and the Cape Verde Islands. The depression formed on October 5th from a westward moving tropical wave, moved in a general west-northwest direction for the next several days, and dissipated on the 8th about 915 miles east of the Lesser Antilles after coming under the influence of a hostile upper level environment.
Irene became the sixth hurricane of the 1999 season. The system was first declared a tropical storm on October 13th after being monitored for several days. It developed from an area of disturbed weather in the northwest Caribbean Sea about 160 miles west-southwest of Grand Cayman Island. Irene slowly intensified as it moved on a general north to north- northeast track through the 14th and reached hurricane status while in the Florida Straits. Irene remained a hurricane as it moved over Key West, Florida and continued on a northeast course across the southern Florida Peninsula. The storm emerged off the east coast of Florida late on the 15th near Jupiter. Irene then turned northward and approached the South Carolina coast before veering to the northeast. The system paralleled the southeastern US. coast, remaining offshore, and accelerated out into the Atlantic Ocean on the 18th. Irene became extratropical on the 19th. Irene's slow movement across the southern Florida peninsula lead to drenching rains across the region. At least five fatalities were attributed to downed power lines in South Florida. An additional two deaths were attributed to the storm as it crossed Cuba. The hurricane passed close enough to the already devastated state of North Carolina to produce additional flooding on already very saturated grounds.
Jose was the seventh hurricane to develop during the 1999 season. The system formed from a tropical wave just to the east of the southern Leeward Islands and moved to the northwest. Jose reached depression status on the 17th, tropical storm status on the 18th, and hurricane status on the 19th. The system moved across the northern Leeward Islands and caused some damage to the region. Jose eventually took a turn to the north after passing just north of Puerto Rico, and then turned to the northeast into the Atlantic Ocean in response to a storm system exiting the east coast of the United States. Jose passed well to the east of Bermuda, and the last advisory on the tropical cyclone was issued by the National Hurricane Center on the 25th.

| Name | Dates | Highest Wind | Deaths | U.S. Damage |
|---|---|---|---|---|
| TS Arlene | Jun 11-18 | 50 mph | 0 | 0 |
| TD Two | Jul 2-3 | 35 | 0 | 0 |
| H Bret | Aug 18-23 | 140 | * | $15 M |
| H Cindy | Aug 19-31 | 140 | 0 | 0 |
| H Dennis | Aug 24-Sep 5 | 105 | 7 | $43 M |
| TS Emily | Aug 24-28 | 65 | 0 | 0 |
| TD Seven | Sep 6-7 | 35 | 0 | 0 |
| H Floyd | Sep 7-17 | 155 | 75 | $6 B |
| H Gert | Sep 11-23 | 150 | 0 | 0 |
| TS Harvey | Sep 19-22 | 60 | 0 | * |
| TD Eleven | Oct 4-6 | 35 | 400+ | 0 |
| TD Twelve | Oct 5-8 | 35 | 0 | 0 |
| H Irene | Oct 13-19 | 105 | 7 | * |
| H Jose | Oct 17-25 | 100 | * | * |
| TD = tropical depression | TS = tropical storm | H = hurricane |
| * = yet to be determined |
| B - Billion | M - Million |
| The NWS is the primary source of weather forecasts for the nation, and the only official source for severe weather watches and warnings. |
Summer 1999 Climate Review
By Matt Moreland
Summer 1999 in southeast Texas will be remembered for severe weather in May, wet and mild conditions in June and July, one of the hottest and driest months ever recorded in August, and worsening drought conditions in September.
May was typical of late spring, with several bouts of thunderstorm activity and severe weather across southeast Texas. Early in the morning of May 10 a bow echo (strong band of winds along a squall line) swept across the Houston, Galveston, and Baytown areas, producing widespread wind damage, including roofs ripped off several apartment complexes and schools. On May 17, another squall line pushed through the northern counties of southeast Texas with wind damage there. On May 30, a strong storm system pushing across southeast Texas generated several severe thunderstorms which produced golfball to baseball-sized hail across Harris, Austin, and Colorado counties and a tornado in Ft. Bend county. Temperatures were slightly above normal throughout southeast Texas in May, with precipitation slightly below normal.
Throughout most of June and July, a weak upper-level trough and deep tropical moisture predominated the weather pattern in southeast Texas, with scattered to numerous afternoon and evening showers and thunderstorms observed on most days. Funnel clouds, waterspouts, and small, short-lived tornadoes occurred on several occasions in the counties nearest the coast in June and July, including an F1 tornado which hit an apartment complex in Texas City on July 12. Heavy rainfall also resulted from the wet weather pattern, most notably on June 25 when flash flooding occurred in Trinity, Polk, Walker and San Jacinto counties and in the Clear Lake and Dickinson areas in Harris and Galveston counties. The clouds and widespread afternoon and evening thunderstorms kept temperatures mild in June and July, and rainfall generally above normal. Galveston recorded 7.54 inches of rainfall in July, more than twice the normal monthly amount. The first temperature of 95 degrees or higher in Houston did not occur until July 22, the latest first occurrence of 95 degrees or higher observed in the last 50 years. College Station reported only one 100-degree or higher day through the end of July, compared to forty 100-degree or higher days through the end of July in 1998.
A strong high pressure system developed over southeast Texas in late July bringing an end to the wet and mild weather. Temperatures across southeast Texas were above normal by the end of July...and stayed that way through the first half of September. August 1999 was the third warmest and fourth driest August ever recorded in Houston. The high temperature of 105 degrees on August 20 was the highest temperature recorded in Houston since 1980. The 10 days of 100 degree or higher temperatures at Houston Intercontinental in August was the second highest number ever recorded in the month of August and the fourth highest ever recorded for an entire season. High temperatures reached 95 degrees or higher 30 out of 31 days during the month. The August monthly average temperature of 86.8 degrees was the third warmest observed for any month since records have been kept at Houston. Only 0.50 inch of rain fell the entire month in Houston, almost three inches below the monthly normal. Only 0.26 inch of rain was observed in Galveston during August, making it their second driest August in the last 50 years. College Station observed their 10th warmest August on record, and suffered through 17 days of 100-degree or higher temperatures during the month, including a temperature of 107 degrees on the 20th. Severe weather on August 31 provided a temporary break to the hot, dry weather along the coastal plains, as a squall line moved from the Houston area southwestward to near El Campo producing widespread wind damage, including a collapsed motel in Houston.
Dry weather continued through most of September, normally one of the wettest months of the year in southeast Texas. Temperatures remained above normal for the first half of the month, but a series of cool fronts brought low humidities and cooler weather for most of the last half of the month, including a record low of 49 degrees on the 23rd at Intercontinental Airport. Some heavy rainfall occurred near the coast on the 29th of the month with a frontal passage, but it was not near enough to relieve the fast worsening drought across southeast Texas. Rainfall for September at Houston Intercontinental Airport was only 1.37 inches, well below the monthly normal of 4.89 inches. In College Station, the 1.50 inches of rain in August and September were the 6th driest August/ September period on record. As of October 14, rainfall for the year is running only about 60 to 70 percent of normal for most of southeast Texas.
Temperatures at Houston Intercontinental Airport - Summer 1999
| Month | Avg High | Avg Low | Avg Monthly Temp |
Departure from Normal |
|---|---|---|---|---|
| May | 87.4 | 65.8 | 76.6 | +2.1 |
| June | 90.5 | 73.2 | 81.9 | +1.6 |
| July | 92.6 | 73.6 | 83.1 | +0.5 |
| August | 98.5 | 75.1 | 86.8 | +4.5 |
| September | 91.6 | 64.3 | 78.0 | -0.2 |
Precipitation at Houston Intercontinental Airport - Summer 1999
| Month | Total Precipitation | Departure from Normal |
|---|---|---|
| May | 4.13 | - 1.11 |
| June | 5.26 | +0.30 |
| July | 5.11 | +1.51 |
| August | 0.50 | - 2.99 |
| September | 1.37 | - 3.52 |
Total rainfall at Houston Intercontinental through October 21:
24.15 inches...or 13.38 inches below normal
Temperatures at Galveston Scholes Field - Summer 1999
| Month | Avg High | Avg Low | Avg Monthly Temp |
Departure from Normal |
|---|---|---|---|---|
| May | 82.7 | 72.3 | 77.5 | +1.7 |
| June | 87.7 | 78.1 | 82.9 | +1.8 |
| July | 87.9 | 78.3 | 83.1 | - 0.2 |
| August | 91.9 | 80.2 | 86.1 | +2.6 |
| September | 87.0 | 73.8 | 80.4 | +0.4 |
Precipitation at Galveston Scholes Field - Summer 1999
| Month | Total Precipitation | Departure from Normal |
|---|---|---|
| May | 3.56 | - 0.03 |
| June | 2.35 | - 2.09 |
| July | 7.54 | +3.58 |
| August | 0.26 | - 4.21 |
| September | 3.95 | - 1.98 |
Total rainfall at Galveston Scholes Field through October 21:
26.10 inches...or 8.56 inches below normal
Temperatures at College Station Easterwood Field - Summer 1999
| Month | Avg High | Avg Low | Avg Monthly Temp |
Departure from Normal |
|---|---|---|---|---|
| May | 85.3 | 64.5 | 74.9 | +0.3 |
| June | 90.3 | 72.6 | 81.5 | +0.9 |
| July | 92.9 | 72.4 | 82.7 | - 0.9 |
| August | 100.2 | 73.3 | 86.8 | +2.8 |
| September | 92.9 | 65.4 | 79.2 | +0.6 |
Precipitation at College Station Easterwood Field - Summer 1999
| Month | Total Precipitation | Departure from Normal |
|---|---|---|
| May | 4.16 | - 0.64 |
| June | 4.61 | +0.93 |
| July | 2.38 | +0.09 |
| August | 0.77 | - 1.65 |
| September | 0.73 | - 4.14 |
Total rainfall at College Station Easterwood Field through October 21:
21.33 inches...or 10.67 inches below normal

SKYWARN 2000
By Gene Hafele
1999 started out with a bang with seven tornadoes touching down in the Houston/Galveston National Weather Service County Warning Area (CWA) on January 1. Seven people were injured by these storms but luckily no one was killed. In fact we have had only one weather related death this year in our CWA with the exception of heat related deaths this summer. This one death was a young man struck by lightning on Galveston Island. Heavy rains in excess of 8 inches caused flash flooding in portions of Polk and San Jacinto Counties on April 2 and 3. These floods caused over $250,000 worth of damage. Overall 1999 was a fairly quiet year for severe weather. We can hope, with the La Nina conditions expected to continue into the Spring of 2000, to have another relatively quite spring severe weather season. We, however, must be prepared for the possibility of severe weather affecting our area in the year 2000. One of the best ways to make your county and or community better prepared is to establish or enhance your SKYWARN program in 2000.
What is Skywarn? Skywarn is a program sponsored by your National Weather Service Office in conjunction with your local Emergency Management Organizations. It is a group of trained volunteers that watch the skies during severe weather and relay reports back to the local Emergency Management Official, the local law enforcement agency, and/or the National Weather Service. These volunteers provide valuable information to their local community and to the National Weather Service which helps improve the warning program, thus possibly saving lives and property in the community.
The Skywarn program helps the individual identify the varying types of thunderstorms and what type of severe weather to expect from each type of thunderstorm. But of more importance...you will learn what valuable information should be passed on to the National Weather Service and/or your Emergency Management Office and also what method to use to get that information relayed. You will learn about the NWS operations and how we disseminate information to your community.
This year's Skywarn program will emphasize the dangers of heavy rain and the eventual floods and flash floods produced by these rains. Floods and Flash Floods continue to be the number one producer of weather related deaths. With your help we will try to identify flash flood prone areas and also develop a better rainfall reporting network.
If you or your community is interested in sponsoring a Skywarn Program, now is the time to reserve your training session. The Houston/Galveston National Weather Service will be conducting Skywarn classes during the months of January, February, and March to help the Skywarn spotters be prepared for the 2000 Spring Severe Weather Season. The training sessions last 2-3 hours and can be scheduled during the day... in the evening...or even on Saturday to best meet you or your group's schedule.
If your group or community is interested in sponsoring a Skywarn Program in early 2000, please make your reservations now. Call Gene Hafele at 281-337-5074 x223. Regardless of past history, Mother Nature can always throw a curve. We must be prepared for any severe weather outbreak.
|
MYTH: If it is not raining. then there is no danger from lightning. FACT: Lightning often strikes outside of heavy rain and may occur as far as 10 miles away from any rainfall. MYTH: The rubber soles of shoes or rubber tires on a car will protect you from being struck by lightning. FACT: Rubber-soled shoes and rubber tires provide NO protection from lightning. However, the steel frame of a hard-topped vehicle provides increased protection if you are not touching metal. Although you may be injured if lightning strikes your car, you are much safer inside a vehicle than outside. MYTH: People struck by lightning carry an electrical charge and should not be touched. FACT: Lightning-strike victims carry no electrical charge and should be attended to immediately Contact your local American Red Cross chapter for information on CPR and first aid classes. MYTH: "Heat lightning" occurs after very hot summer |

Marine Weather Tidbits
By Brian Kyle
The National Weather Service Houston/Galveston is responsible for forecasting marine weather and seas from High Island to the Matagorda Ship Channel out to 50 nautical miles, including Galveston and Matagorda Bays. Currently our forecasts include wind and seas out 36 hours with an outlook to 5 days. Sometime in the year 2000, forecasted wind and seas will likely go out to 5 days. Listed below are some definitions/terms you may run across in our forecasts, statements, and warnings.
Fetch: The marine area in which waves are generated by winds having an approximately constant direction and speed.
Gale Warning: A warning of sustained winds in the range of 34 to 47 knots and NOT associated with tropical cyclones.
Knot: Unit of speed equal to 1 NM per hour or about 1.15 statute miles per hour.
Marine Weather Statement: A product to provide mariners with details on significant or potentially hazardous conditions not otherwise covered in existing marine warnings or forecasts.
Nautical Mile: Unit of distance equal to 1.15 statute miles (length of 1 minute latitude).
Period: Period of time elapsed between consecutive wave crests passing a single point.
Predominate Wind: Wind that, in the forecasters judgement, generates the local component of the significant sea conditions across the forecast area.
Seas: Used to describe the combination or interaction of wind waves and swells in which the separate components are not distinguished.
Significant Wave Height: The average height (trough to crest) of the one-third highest waves. An experienced observer will report heights equivalent to the average of the highest one-third of all waves observed.
Small Craft Advisory: An advisory in the coastal waters when winds exceed, or are forecast to exceed, 20 knots and/or seas 7 feet or higher.
Special Marine Warning: A warning of potentially dangerous weather conditions usually of short duration (2 hours or less) and producing wind speeds of 34 knots or more.
Storm Warning: A warning of sustained winds of 48 knots or more and NOT associated with tropical systems.
Sustained Wind: The wind speed obtained by averaging observed values over a period of at least one minute.
Swell: Wind-generated waves that have traveled out of their generating area. Swells characteristically exhibit smoother and more regular and uniform crests and a longer period than wind waves.
Waterspout: A rotating column of air, usually pendant from a cumulus or cumulonimbus cloud, that forms over water and whose circulation extends to the surface. More or less a tornado over water.
Wind Waves: Local, short period waves generated from the action of wind on the water surface (as apposed to swell).
We would like to hear feedback on our marine forecasts. If for some reason conditions are not representative of what you actually observe, give us a call so we can amend the forecast. This will help other mariners who have not yet ventured into the water. Of course, we'd also like to know if our forecast was right on the money as well!
| Winter Safety in Southeast Texas By Steven Taylor |
Winter weather, although rare in southeast Texas, does occasionally occur. Although winter weather can occur at anytime during the winter and early spring months, January is the month our area is most likely to observe snow, sleet or freezing rain. The Houston/Galveston National Weather Service would like to review some safety information to help you and your family prepare for the upcoming winter season.
It is very important for you to stay informed about the possibility of winter weather in your area. This can be done by tuning into NOAA Weather Radio, commercial radio or your local television station. For more information concerning winter weather in southeast Texas, please contact the Houston/Galveston National Weather Service Office. In addition, additional safety information can be found on the world wide web at the following web address:
ttp://www.nws.noaa.gov/om/wntrstm.htm
Co-Op Corner
By Don Oettinger
For over a century the weather data gathered by Cooperative Program Observers has formed the cornerstone of climatological data in the United States. Literally billions of dollars have been made or lost based on temperatures and rainfall amounts logged by Cooperative Observers and considered "official". As we approach the next century new and exciting uses are being planned for this important data.
With so many of our observers reporting weather data in near real-time, using touch tone telephones and computer modems, a wealth of data is now available to use in our forecast processes. In the next few years a procedure will exist to incorporate near real-time cooperative data with the computer forecast models to produce high and low temperature guidance for our forecasters to use. Currently the majority of the data used for these forecasts comes from airport and Weather Service Office locations. The incorporation of cooperative program observations will significantly increase the database available to the computer forecast models.
Over the last ten years most of the airport weather observations that are relied on for forecasts and climatology have been automated. These automated systems, while providing excellent data, are subject to breakdown. Many of these locations no longer have a human observer to provide weather information when the automated systems are not functional. Data from our cooperative observers allows us to fill in the gaps when these systems fail.
Your data is very important to us. I hope this has helped to shed some light on how valuable your observations are. Please keep those daily reports coming!
 |
|---|
| Joe Earl Thomas (left) receiving a 15 year Service Award from Tom Fountain. Mr. Thomas has been taking weather observations for Tomball, Tx since January 1984. |
 |
|---|
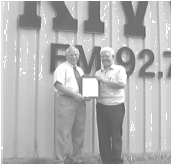
| Leroy S. Dabney (left) receiving a 45 year Service Award from Tom Fountain. Mr. Dabney has taken weather observations for Coldspring, Tx since May 1954. |
 |
|---|
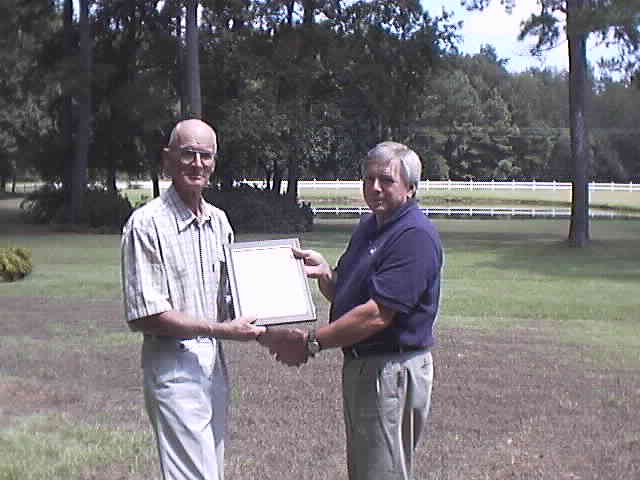
| J. H. Gibbs (right) receiving a 45 year Service Award from Jim Maxwell. Mr. Gibbs has taken weather observations for Crockett, Tx since October 1953. |

American Meteorological Society
By Cecilia Sinclair, Houston AMS President
The Houston Chapter of the American Meteorological Society is an organization which promotes sharing and studying the science of meteorology. Annual dues are only $10. And, you need not be a meteorologist to be a member. We usually have meetings on the third Thursday of each month. However, modifications are made if necessary to accommodate speakers. Most meetings are held in the evening. However, we usually have a couple lunch time meetings each year. Meeting locations vary.
We began the year on a tropical note. Normally, our first meeting would be held in September. This year, we had an August meeting to help get us in storm preparation mode. There were two speakers. Lonny Farmer of Plylox demonstrated the Plylox clip, which is used with plywood to protect windows and doors. James R. Bailey of EQE International talked about ways to mitigate wind damage to homes, business, and industry. The hurricane season theme continued through the September meeting with two more speakers. Miguel Gonzales of R.H. Tamlyn and Sons presented a construction mockup which illustrated the application of clips and strips which help homes handle high winds. Ted Parker of T.M. Parker Products talked about Merlin, a hurricane tracking and forecasting model.
In October, Sue Runco of the Earth Observations group at NASA presented Earth pictures taken during various space shuttle missions. In November, Brian Lambeth, a meteorologist from the Texas Natural Resource Conservation Commission will discuss the role of meteorology in solving air pollution problems.
In December, the organization will visit KHOU and Dr. Neil Frank to see their weather facility. In January or February, a team of weather professionals will visit Madison High School to talk to students about careers in meteorology. Some time in the spring, a team of weather professionals will also visit Texas A & M to conduct a job seminar. In March or April, we will give out special awards honoring outstanding meteorological and environmental projects at the annual Houston Regional Science Fair.
We are also busy putting together a poster for presentation at the upcoming national AMS meeting, which will be held early in January 2000. The poster will highlight special topics that relate to our local chapter.
In addition to learning at our meetings, we also try to have fun. There is usually a door prize of some sort at each meeting. And, this year, one of the first 25 people to pay dues won a $25 gift certificate to Ninfa's Restaurants. We're a low key group that just loves to talk about the weather. If interested, we hope you'll join us. To find out more, please email me, madam president, Cecilia Sinclair at foxwxgal@hotmail.com or call me at (713) 479-2852. Whatever the weather, hope to see you at the next meeting.

EMWIN HOUSTON TO TEST 9600 Baud
By Gene Hafele
EMWIN Houston has been designated as a test site for the new 9600 baud re-transmission of EMWIN data using National Weather Service donated frequencies. The broadcast will be on a frequency of 163.325 MHz with a 100 watt transmitter. The new 9600 broadcast will contain the entire EMWIN data stream for the entire United States. In Houston it will allow for the insertion of additional radar images so you will have access to radar imagery every 10 minutes instead of the current every 20 minutes on the 1200 baud re-broadcast. The NWS will provide three frequencies to re-broadcast the EMWIN data stream. These three frequencies will allow for greater expansion of the EMWIN rebroadcast across the United States. This new broadcast should be on the air in the Houston area before the end of 1999.
EMWIN Houston 1200 baud re-broadcast will continue to broadcast with a 200 watt transmitter and antenna located atop the Exxon building in downtown Houston. The effective range of the current EMWIN is about a 50 mile radius from downtown Houston.
A new lightning display, added to the local EMWIN broadcast in October, provides users with enhanced information concerning cloud to ground lightning strikes within a 300 mile radius of Houston. Boxes representing the calculated location of active thunderstorms are plotted in an "analysis" window, with smaller boxes depicting stronger storms. Strike flags from actual strokes appear in a "raw lightning data" window and give the user a graphical representation of direction of the storm from Houston and the relative frequency of lightning. The display also includes a counter window which records the number of strikes and random noises in the last minute as well as the number that day. More information is available on the EMWIN Houston website at http://emwin.hcad.org. The lightning image updates twice hourly in the VHF radio broadcast and every two minutes on the Internet website.
For additional information on EMWIN Houston send Email to emwin-houston@emwin.hcad.org.
For additional information about EMWIN in general go to the following web site. http://iwin.nws.noaa.gov/emwin/index.htm.
|

Staff Spotlight
...Steve Taylor...
Full Name: Steve Taylor
Position: Meteorological Intern
Favorite TV Show: "That 70's Show"
PERSONAL INFO
Hometown: New Bern, NC
Birthday: 11/14/75
Other: Single, white, male, available
NWS BACKGROUND
1994-1998............ Volunteer, NWSO Morehead City, NC
1998....................... Meteorological Intern, NWSFO Austin/San Antonio, TX
1999 to present.... Meteorological Intern, NWSO Houston/Galveston, TX
HIGHLIGHTS/DUTIES/OTHER TIDBITS
Most memorable weather events?
The tornado outbreak in 1984 in North Carolina. My mother just missed an F4 tornado by 5 minutes. The other was in Texas - the flooding along the Guadalupe in October of 1998. It was very odd seeing a house floating down the river from my apartment window in New Braunfels.
Biggest difference between Texas and North Carolina?
The food...especially the BBQ. I prefer pork over beef, sour over sweet, and spicy over bland.
Tell the truth, how many hurricane pictures do you have hanging on your wall at home?
Three... Two of Fran and one of Bertha...
Try these interesting Internet weather links..
History of the National Weather Service
http://tgsv5.nws.noaa.gov/pa/special/history/index.html
The Great 1900 Galveston Hurricane
http://www.galvnews.com/NF/omf/freedaily/1900storm/
Billion Dollar U.S. Weather Disasters (1980-1999)
http://www.ncdc.noaa.gov/ol/reports/billionz.html
La Nina
http://www.elnino.noaa.gov/lanina.html
Global Warming
http://www.ncdc.noaa.gov/ol/climate/globalwarming.html
Hurricanes, Typhoons, and Tropical Cyclones
http://www.aoml.noaa.gov/hrd/tcfaq/tcfaqHED.html
Texas Forest Service
http://txforestservice.tamu.edu
Operational Significant Event Imagery Server (Satellite Pictures)
http://www.osei.noaa.gov
Winter Storms Information
http://www.nws.noaa.gov/pm/wntrstm.htm
National Climatic Data Center
http://www.ncdc.noaa.gov/
Texas Division of Emergency Management
http://www.txdps.state.tx.us/dem/
Texas Skywarn
http://www.skywarn-texas.org/
| Early, accurate warnings don't mean anything if they aren't received by those in harms way. Be prepared and listen to NOAA Weather Radio. The newest models of NOAA Weather Radio receivers can sound an alert for the county in which you live, and give you a warning even if you are asleep! |

