A powerful kona low positioned northwest of the main Hawaiian Islands produced widespread heavy rainfall and gusty winds in early December 2021, leading to flash flooding as well as wind damage in numerous locations across the state. The Big Island was impacted by the rain band first on December 5, followed by Maui and Oʻahu on December 6 through 7. The strongest winds were accompanied by heavy rain and embedded thunderstorms. The Big Island summits also received heavy snow and powerful winds.
The kona low followed a cold front that moved across the islands December 2 through December 4, and stalled east of the Big Island. The cold front brought heavy showers and widespread rain to all the islands and snow to the Big Island summits. However, it did not bring much flooding because it moved too quickly. The forecast seven days ahead of the event showed the kona low following the front to be the primary flooding concern.
After the front passed, the parent upper low to the northwest moved south and became cut off from the polar jet. The upper low also brought a pool of cold air at middle and upper levels of the atmosphere. The cold temperatures aloft, associated with the upper level low, interacted with abundant low level moisture and created conditions favorable for a heavy rain event. The heaviest rain started on the island of Hawaiʻi on December 5, then as a surface high moved in from the east, the high pushed the rain band west over the other islands during the next two to three days.
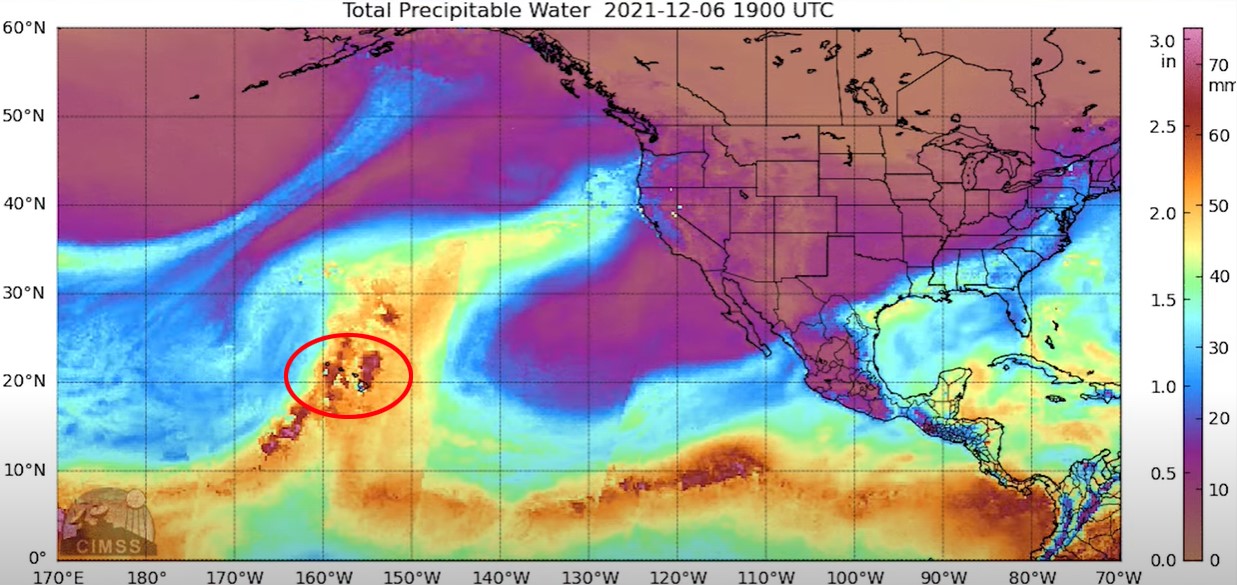
(Image from NESDIS)
The image above displays the total precipitable water (TPW) on December 6, 2021 at 9:00 AM HST. The orange-red colors indicate very moist air with TPW values in the 2.0-2.5 inch range. This shows the deep tropical moisture being drawn over the main Hawaiian Islands which are circled in red. It also shows drier air associated with high pressure east of the state shown as blue and purple colors indicating TPW values less than 1 inch. This high pushes the kona low and associated convergence band westward.

(Image from Mauna Kea Weather Center)
This is the GOES-17 water vapor image captured on December 5, 2021 at 2:32 PM HST. It depicts the kona low centered to the west of Kauaʻi while drawing deep tropical moisture over the Hawaiian islands which are circled in red. The blue, white, and green colors on the image indicate the location of the rain band of the kona low with embedded deep convection and heavy rainfall.
Rainfall Details
Below are three radar loops depicting the heavy rain bands moving through the islands. The heavy rain producing cells generated flooding and contributed to the strong, damaging winds that caused numerous impacts from the Big Island to Oʻahu.

(Loop from Mauna Kea Weather Center)
Hawaiʻi: The figure above is a composite reflectivity image loop from the Naʻalehu and Kamuela radars on December 6 from 8:00 AM HST to 10:00 AM HST as rainfall increased in intensity and coverage. Several normally dry gulches in the Kaʻu District flooded, and Highway 11 closed at Kawa Flats for a few hours. Strong southerly winds also accompanied the kona low, causing damage and power outages. Winds were strongest on the Big Island on December 5, with reports of large trees blown down blocking roads. There were power outages from Volcano to the lower Puna District, with the greatest impacts in lower Puna.

(Loop from Mauna Kea Weather Center)
Maui: The figure above is a composite reflectivity image loop from Kamuela and MolokaÊ»i radars on December 5 from 2:00 PM HST to 4:00 PM HST as rainfall intensified over Maui. Persistent heavy rainfall initiated over Maui on the afternoon of December 5 as a north to south oriented rain band hit the slopes of HaleakalÄ. Large flash floods filled the normally dry gulches west of KaupÅ and closed PiÊ»ilani Highway. Severe flooding also occurred in the areas southwest of HaleakalÄ in the Maui Meadows subdivision, causing damage to homes and washing away several vehicles. Roads in the Kula area were also closed due to flooding. On the evening of December 5 and into the morning of December 6, trees and power lines were blown down in Kula and KÄ“Åkea on Maui due to the strong winds.

(Loop from Mauna Kea Weather Center)
OÊ»ahu: The figure above is a composite reflectivity image loop from the KauaÊ»i and MolokaÊ»i radars on December 6 from 2:00 PM HST to 4:00 PM HST. Thunderstorms with heavy rainfall moved over OÊ»ahu from the south, causing flooding in numerous locations across the south side of the island and especially from Pearl City to Kahala. One notable impact was flooding damage to the Iwilei power substation which cut electrical service to Downtown Honolulu businesses and residents. Also, a section of the H-1 Freeway westbound through Honolulu was closed due to waist-deep water near the Vineyard off ramp. On the windward side of OÊ»ahu, flooding closed Kamehameha Highway from WaiÄhole to WaikÄne. The Honolulu Fire Department responded to multiple reports of downed trees, downed power lines, and damaged roofs. At Honolulu Airport, two planes were damaged when strong winds blew an empty storage container into them.
The island of Kauaʻi managed to avoid significant flooding and wind impacts during the entire event.

(Loop from Kevin Kodama-hydrologist at Honolulu Forecast Office)
The figure above shows the Coupled Routing and Excess Storage (CREST) model output loop on December 6 from 7:00 PM to 10:00 PM HST. CREST is a distributed hydrologic model that is run every 10 minutes using radar-only Multi-Radar/Multi-Sensor System (MRMS) quantitative precipitation estimates (QPE) (no bias adjustment from rain gauges). The loop depicts CREST maximum unit streamflow. Unit streamflow is the maximum total surface water flow over a specific point normalized by a basin/drainage area at every grid cell. This product provides guidance on areas that may have significant flooding from heavy rainfall. The blue and white colors show areas of high runoff and where significant flooding risk is elevated. The highest runoff responses were seen in the areas of Pearl City stretching to the ‘Ä€ina Haina area. This correlates well with the leading edge of the rain band which reached OÊ»ahu from the south as well as flooding reports from emergency managers.

(Loop from Kevin Kodama-hydrologist at Honolulu Forecast Office)
The figure above shows the running 72-hr QPE accumulation loop from December 4 through December 7. The red and purple colors indicate high rainfall accumulations above 10 inches. The loop shows the rain event initiating over the southeast half of the Big Island on the morning of December 5. This resulted in about 10 to 15 inches along the upper slopes of the KaÊ»u District. Rainfall started to affect the west side of the Big Island but this did not last long as the main rain band continued to shift west and the low level flow shifted from southerlies to southeasterlies. The main rain event in Maui County started on the afternoon of December 5 and peaked that night along the south- and southwest-facing slopes of HaleakalÄ. OÊ»ahu had light to moderate stratiform rainfall during the late night hours of December 5 and through the day on December 6. A band of intense rainfall moved over OÊ»ahu from the south during the evening of December 6. This produced most of the event rainfall with many 5-10 inch totals and peak amounts of 10-13 inches.
Wind and Snow

(Image from Liam Tsamous-Intern at Honolulu Forecast Office)
Higher elevations received their strongest winds on Saturday, December 4. The strongest gusts measured on Mauna Kea summit were at the Canada-France-HawaiÊ»i Telescope, where an anemometer measured multiple gusts over 100 mph midday Saturday; the highest was 105 mph at 1:49 PM HST. On Maui, rangers at HaleakalÄ National Park measured a gust to 93 mph around 11:00 AM HST Saturday.
Additional rainfall and wind gust observations are available here.

(Image from earthobservatory.nasa.gov)
Here is an image of the snowfall on the Mauna Kea summit following the heavy snow. Road crews on Mauna Kea reported snow drifts of 3 to 5 feet when they were able to return to the summit on December 7, and estimated that 6 to 10 inches of snow fell during the event.
Damage and Impacts
On December 5, HawaiÊ»i County mayor, Mitch Roth, signed a Severe Emergency Proclamation, followed by Maui County mayor, Michael Victorino. On December 6, Mayor Rick Blangiardi of the City and County of Honolulu signed an Emergency Proclamation and Governor David Ige signed the “Heavy Rains and Flooding Proclamation for the State of HawaiÊ»i” due to the ongoing severe weather damaging public and private property. The timing of the emergency proclamations coincided with the arrival of the north to south oriented heavy rain band.


(Damage location data from the Hawaiʻi County Civil Defense Agency and Maui Emergency Management Agency)
The two images above show reported damage as blue pins (the first image is East Big Island, the second image is Maui County). The majority of the damaged areas on the Island of HawaiÊ»i were caused by the high winds. This is because the Puna District on the east side of the Big Island is more vulnerable to the heavy winds when the direction of the large scale wind becomes southerly. Most of the damage on Maui County was caused by flooding. The west slope of HaleakalÄ in particular was hit hard when heavy rain fell on the upper slopes of the mountain and drained down to the Maui Meadows subdivision. MÄÊ»alaea also had significant flooding from runoff draining the central valley and the southeastern slope of the West Maui Mountains.
Damage Images from Around the State

Ninole Stream flash flood in Kau, Big Island, December 6. (Gavin Freitas/KITV4)

Kekaulike Avenue near Mile Marker 8 in Kula remained closed due to fallen trees and a landslide at approximately 7 AM HST, Monday, Dec. 6 (Hawaiʻi DOT/MauiNOW)
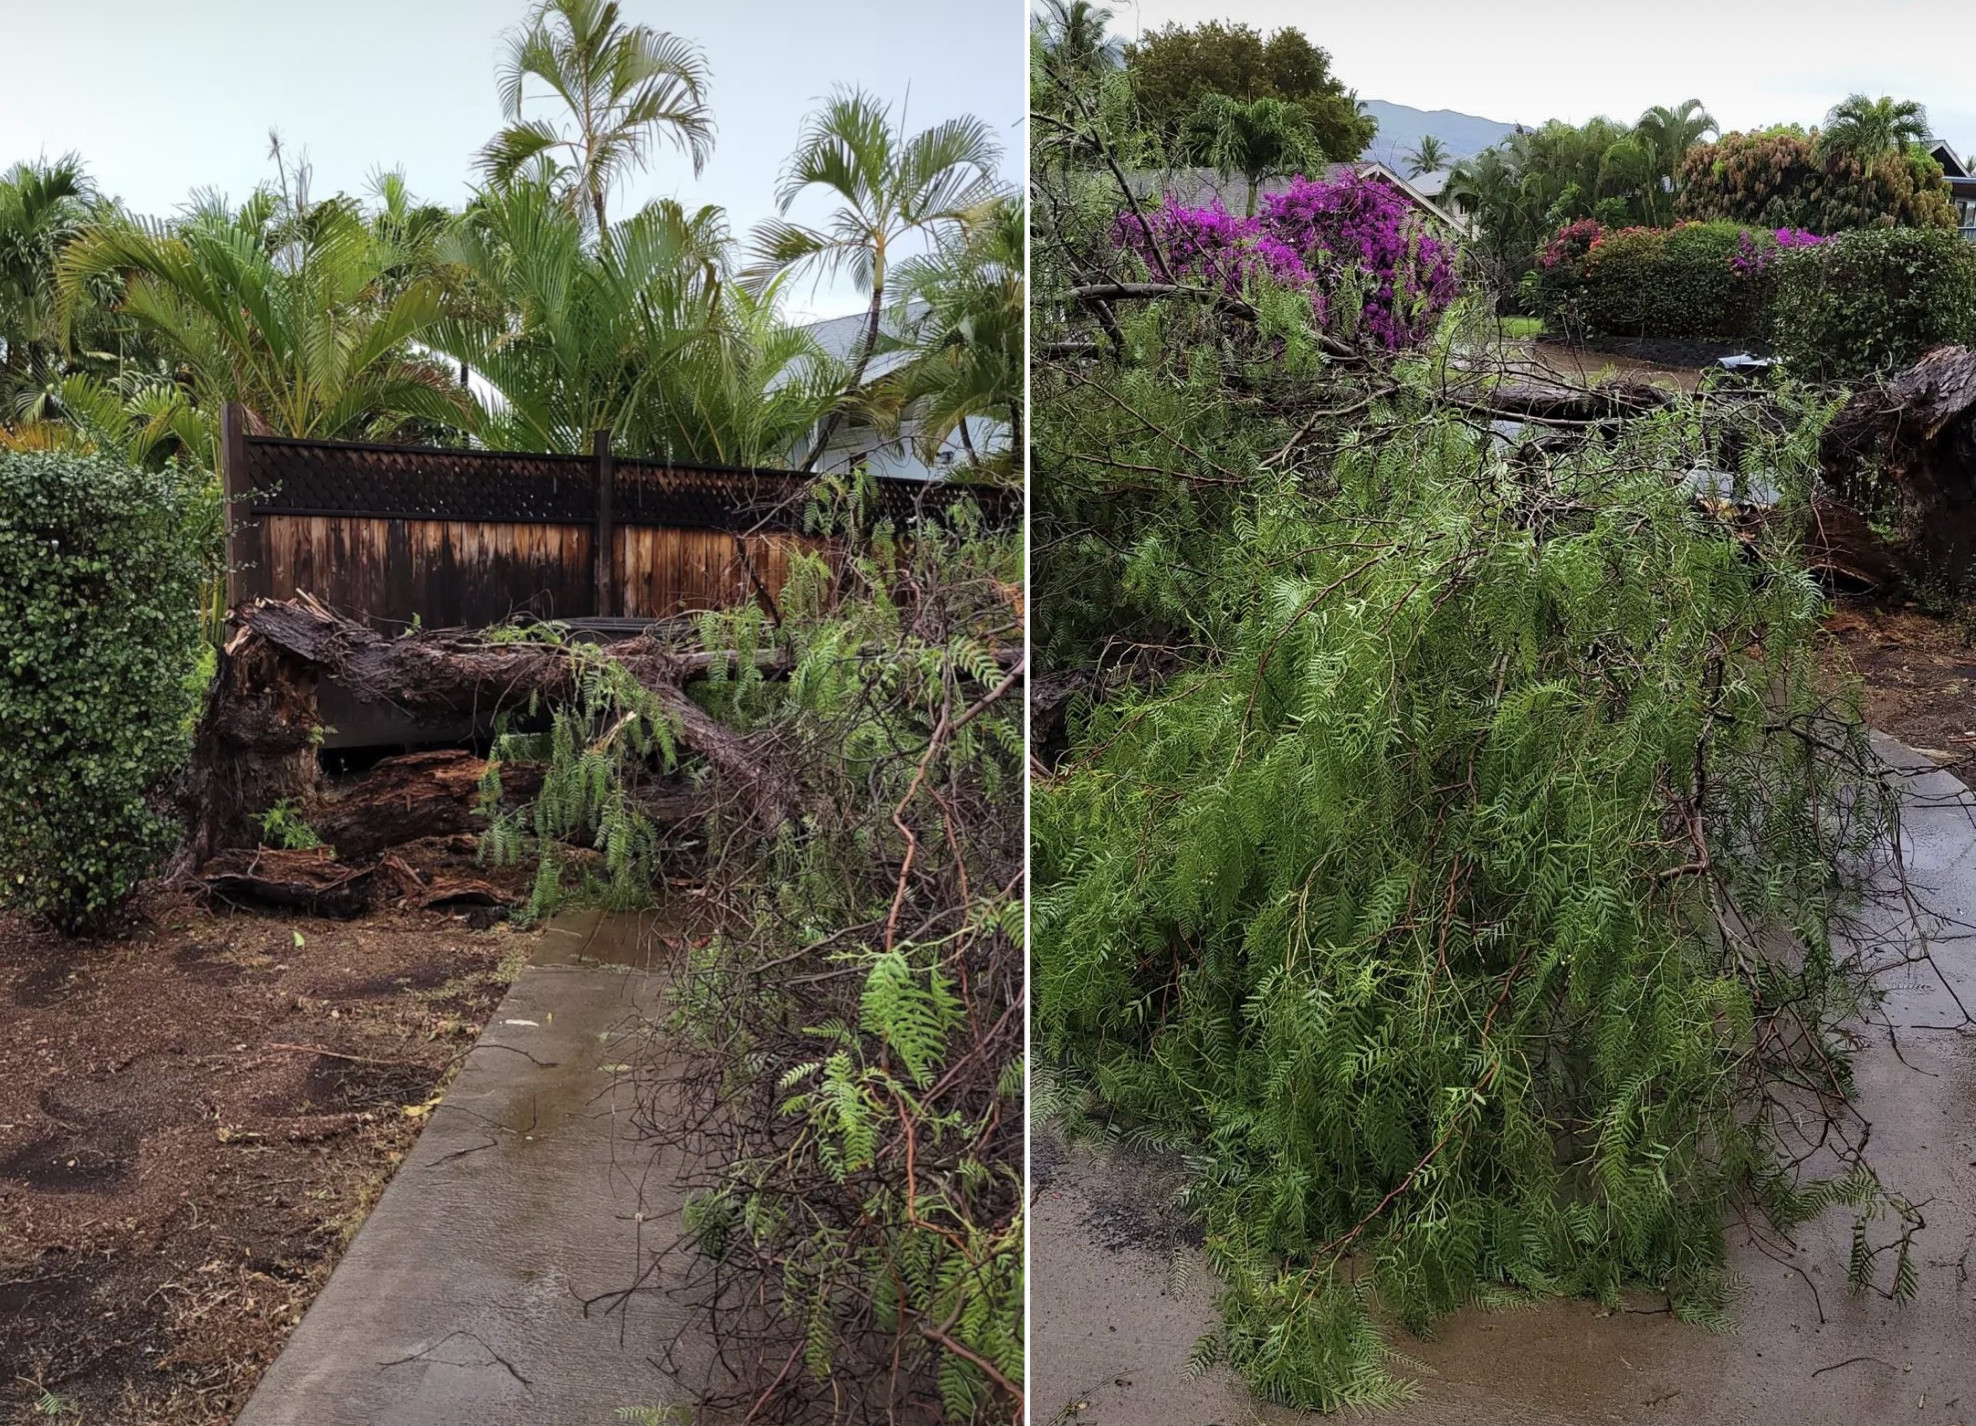
Trees down in KÄ«hei (along the southwest coast of HaleakalÄ, Maui), December 6. (Tracey Doucett/KITV4)

Manawainui Gulch (southeast coast of Maui), December 6 @ 1:30PM HST. (Malika Dudley/KITV4)

Flood damage in Kula, Maui (Serena Fukushima/KITV4)

Flooded campground at Hulopoe Beach at Manele Bay, LÄnaÊ»i (KITV4)

Pearl City Road Maintenance Division helping to clear storm drains in Pearl City, Oʻahu, Monday December 6. (Honolulu Mayor/Honolulu DEM)
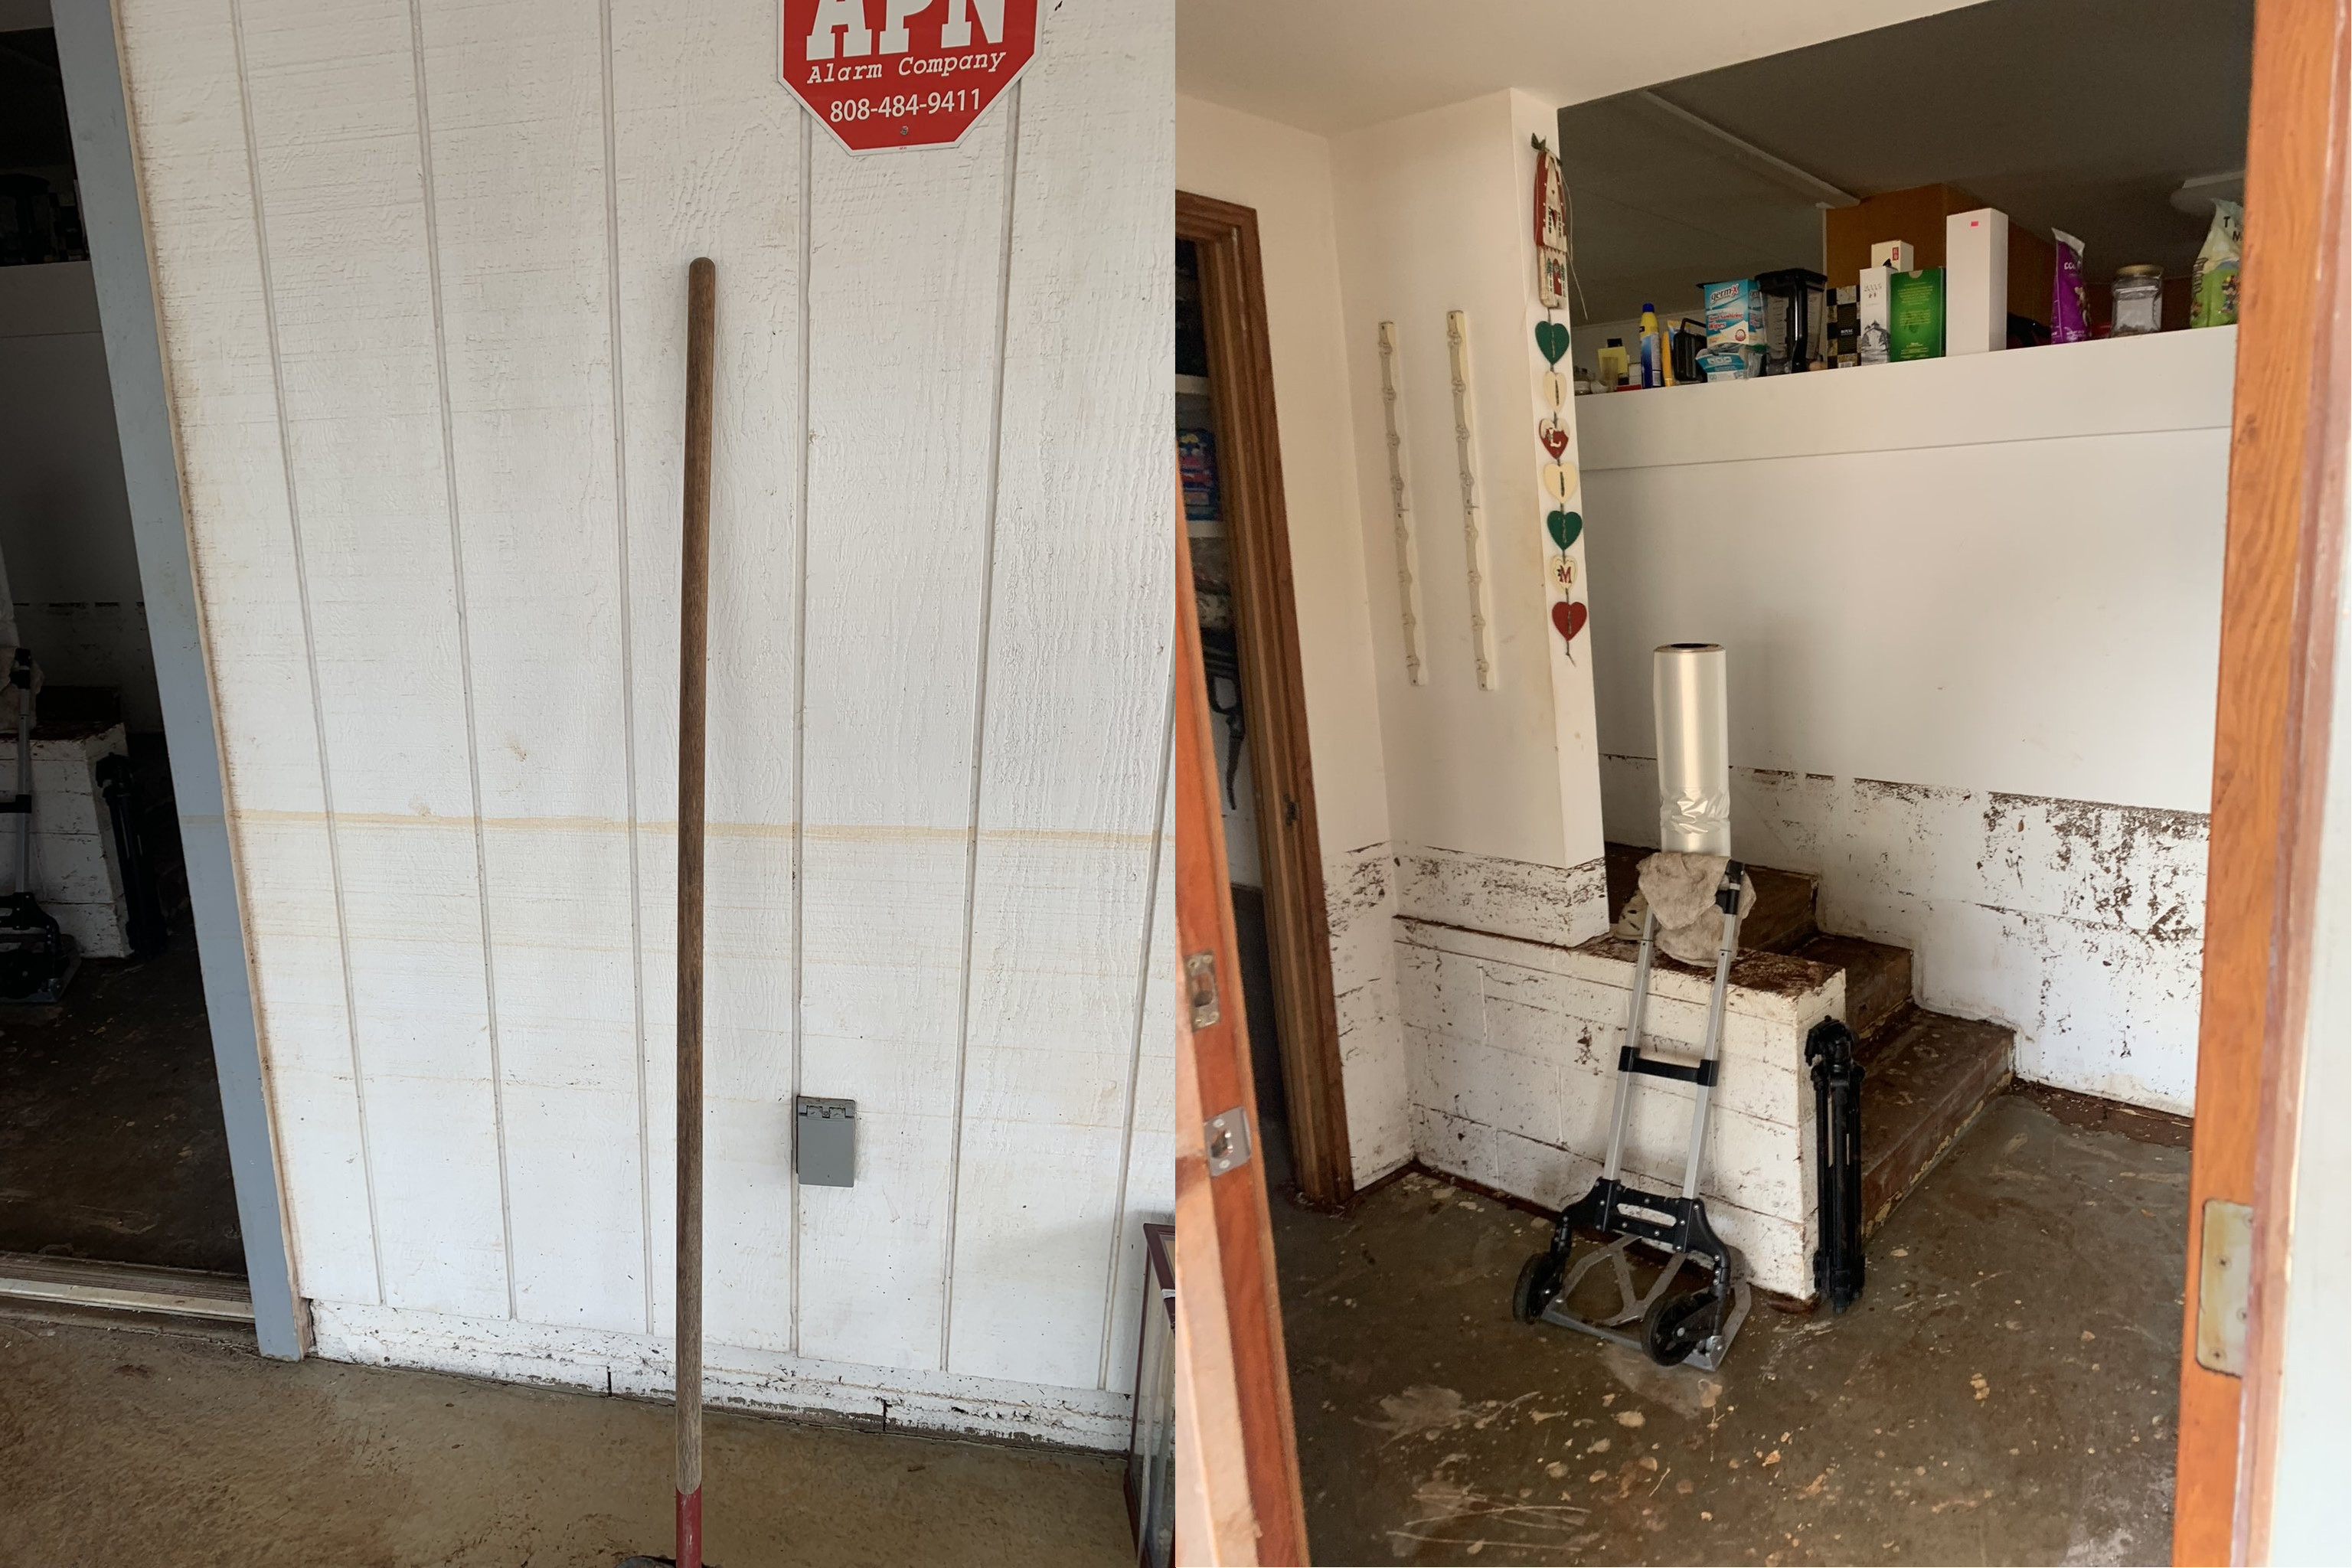
Waterline from flooding in a home along Noelani Street in Pearl City, Monday, December 6. (KITV4/Laryn Bardenas)

