| Previous Month | Next Month |
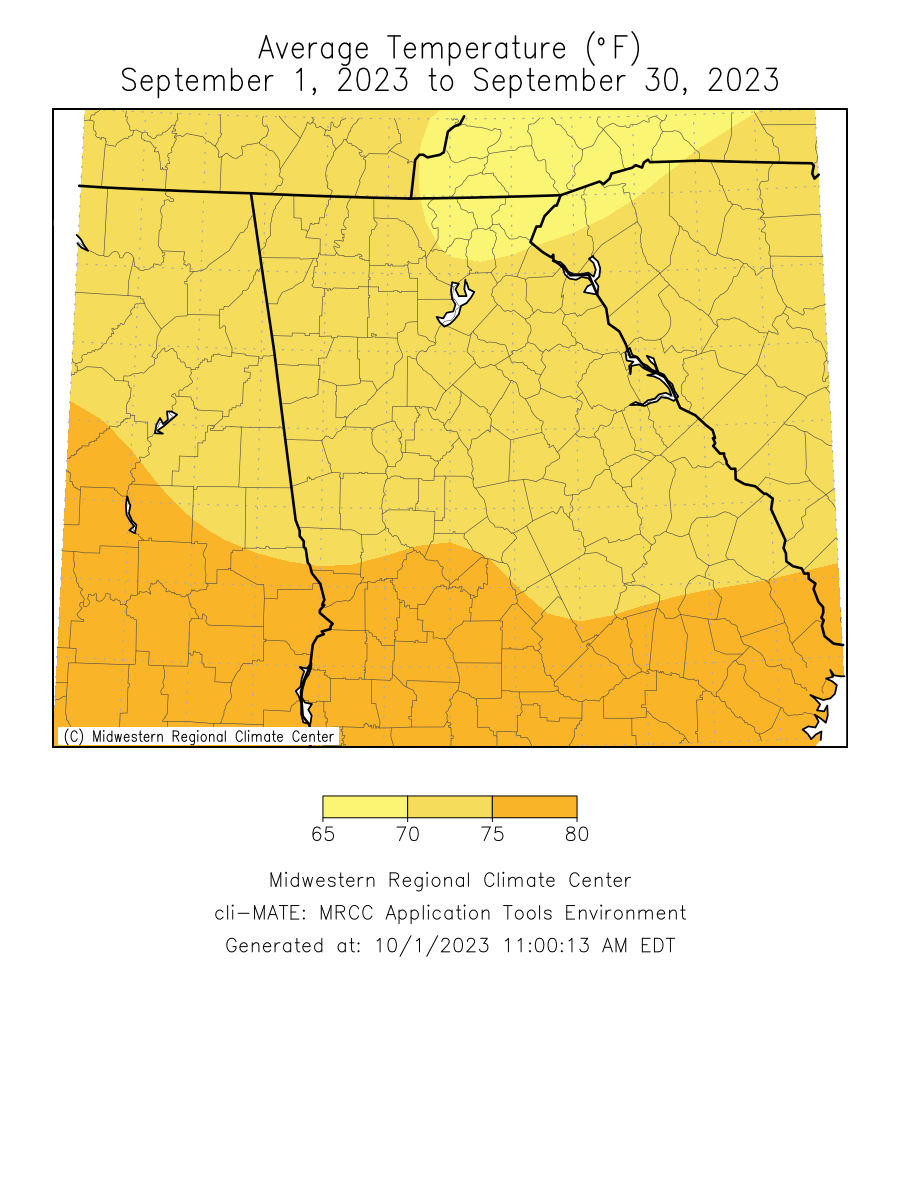
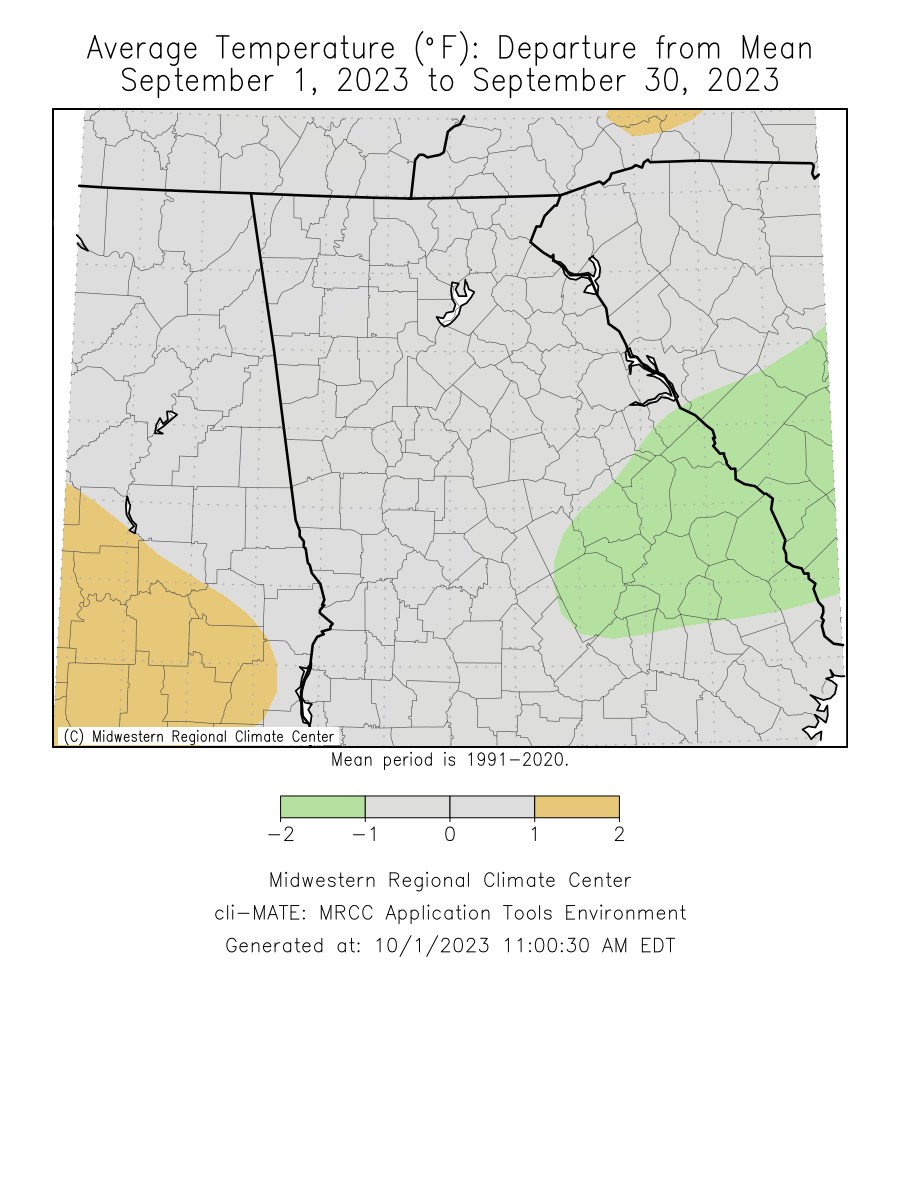
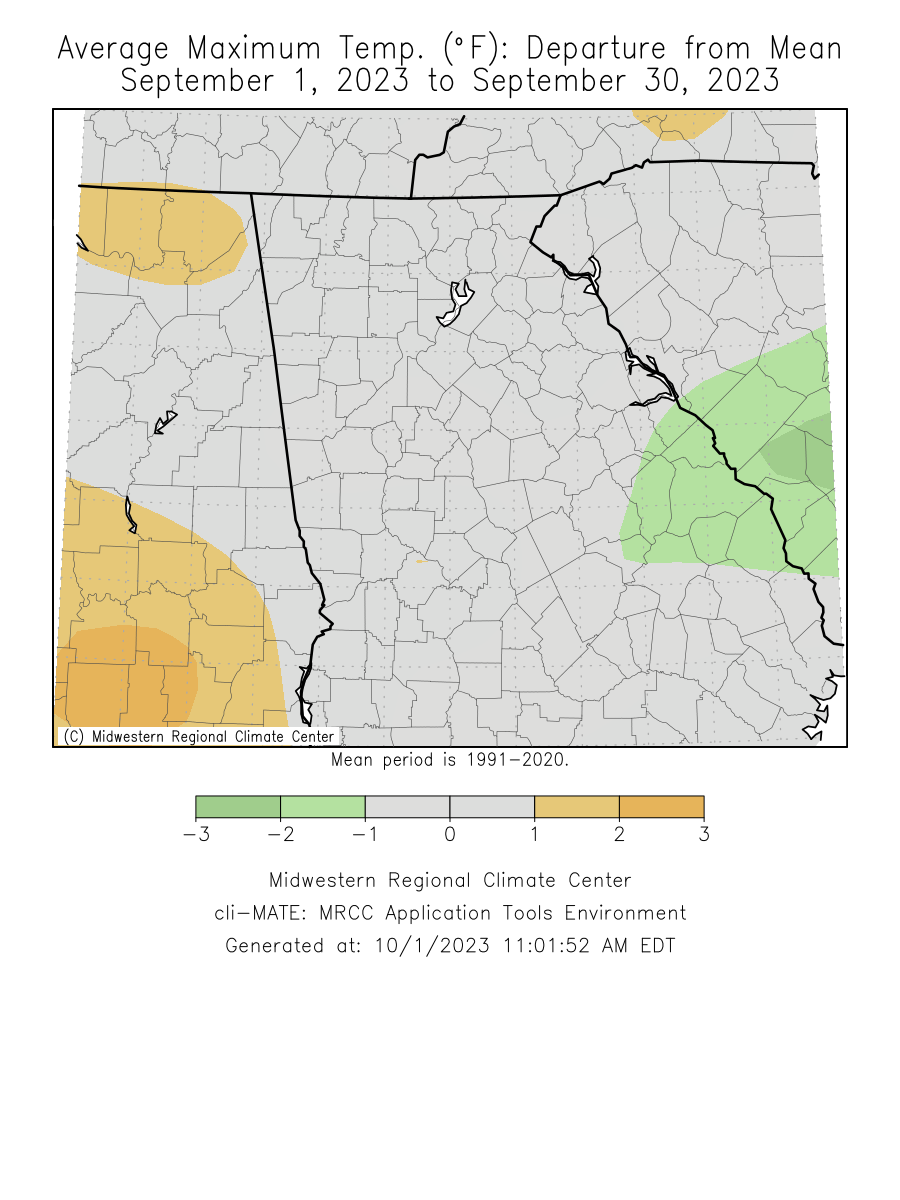
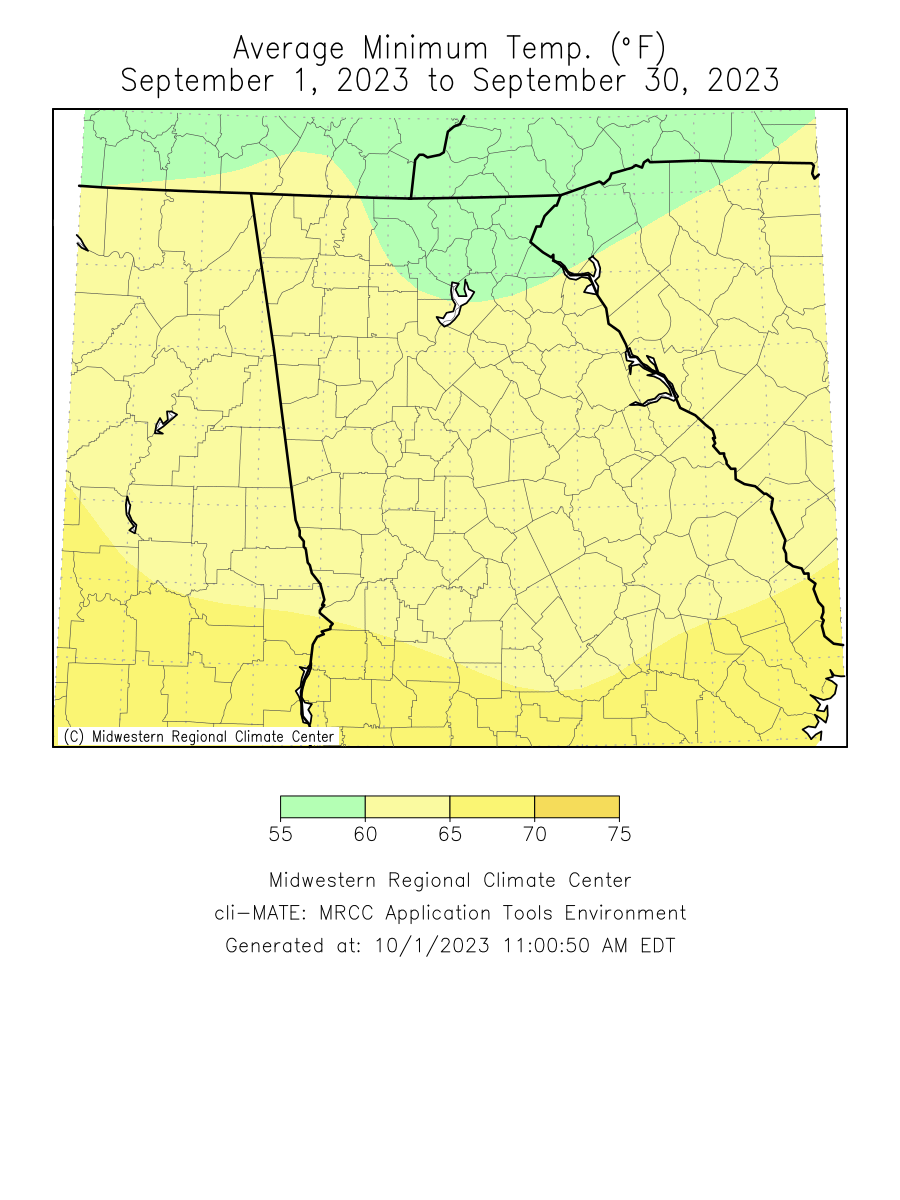
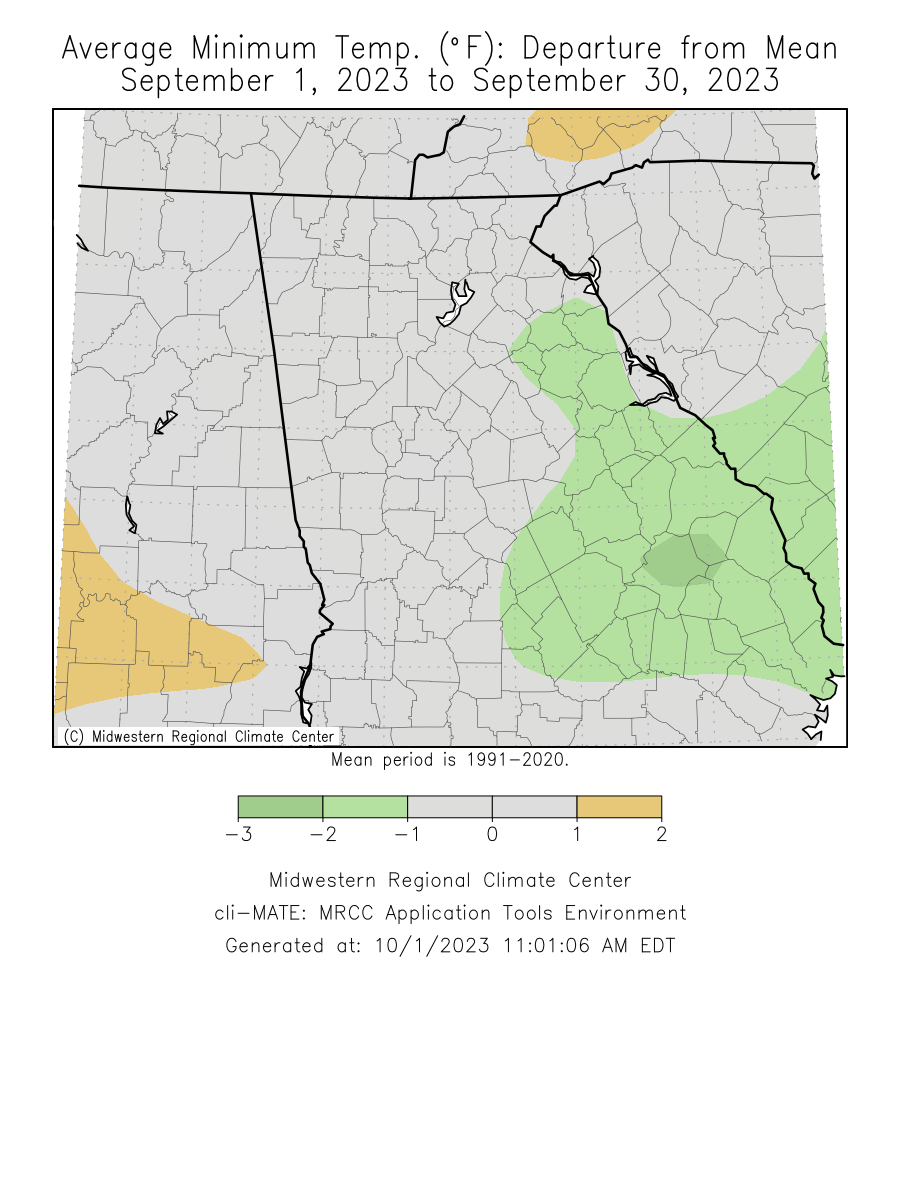
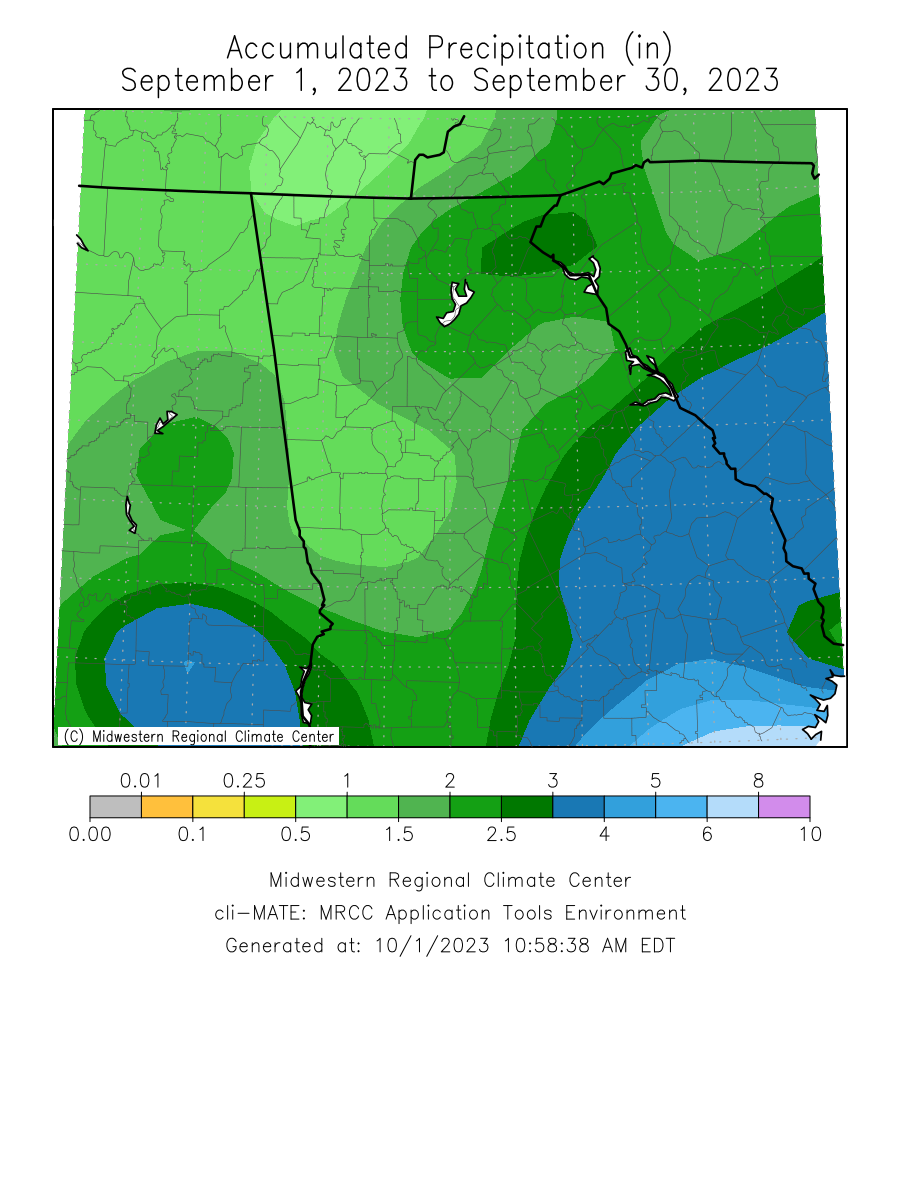
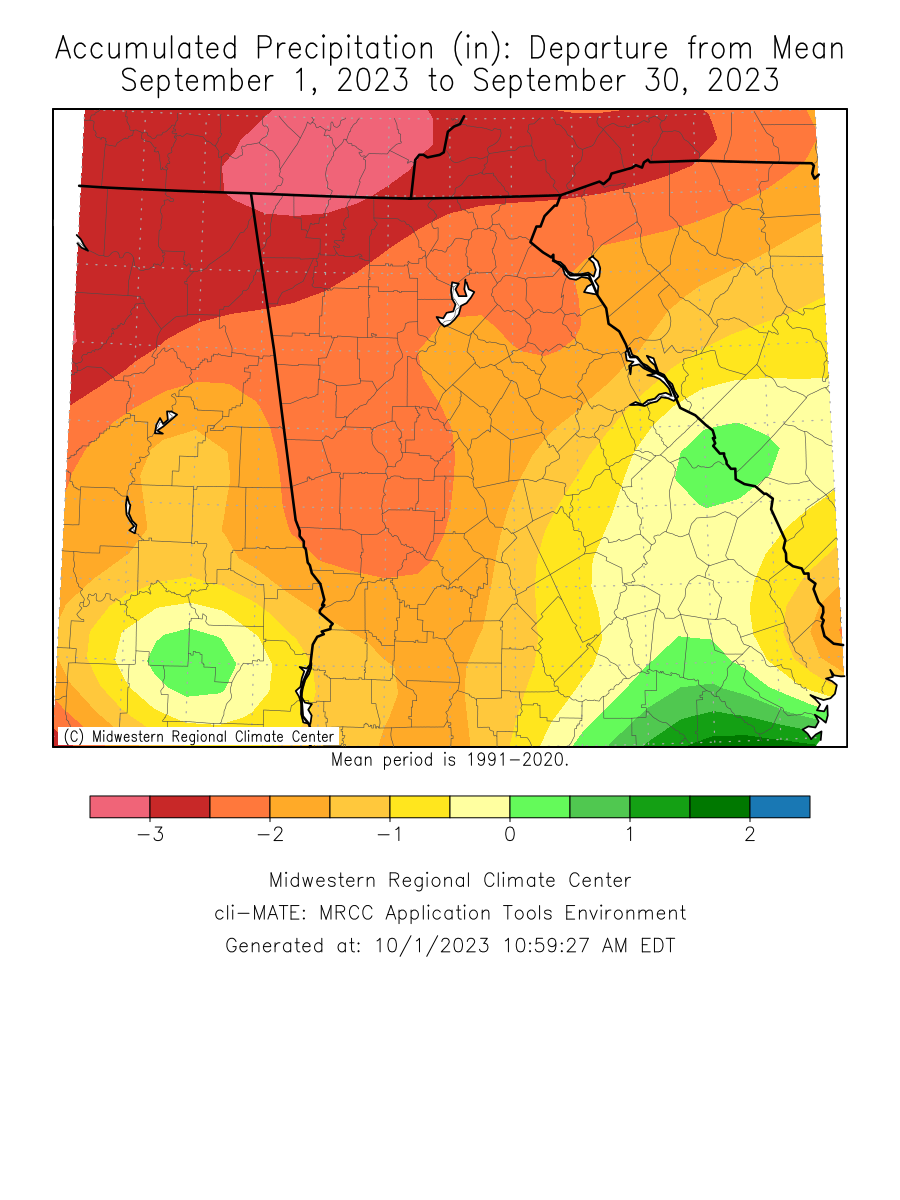
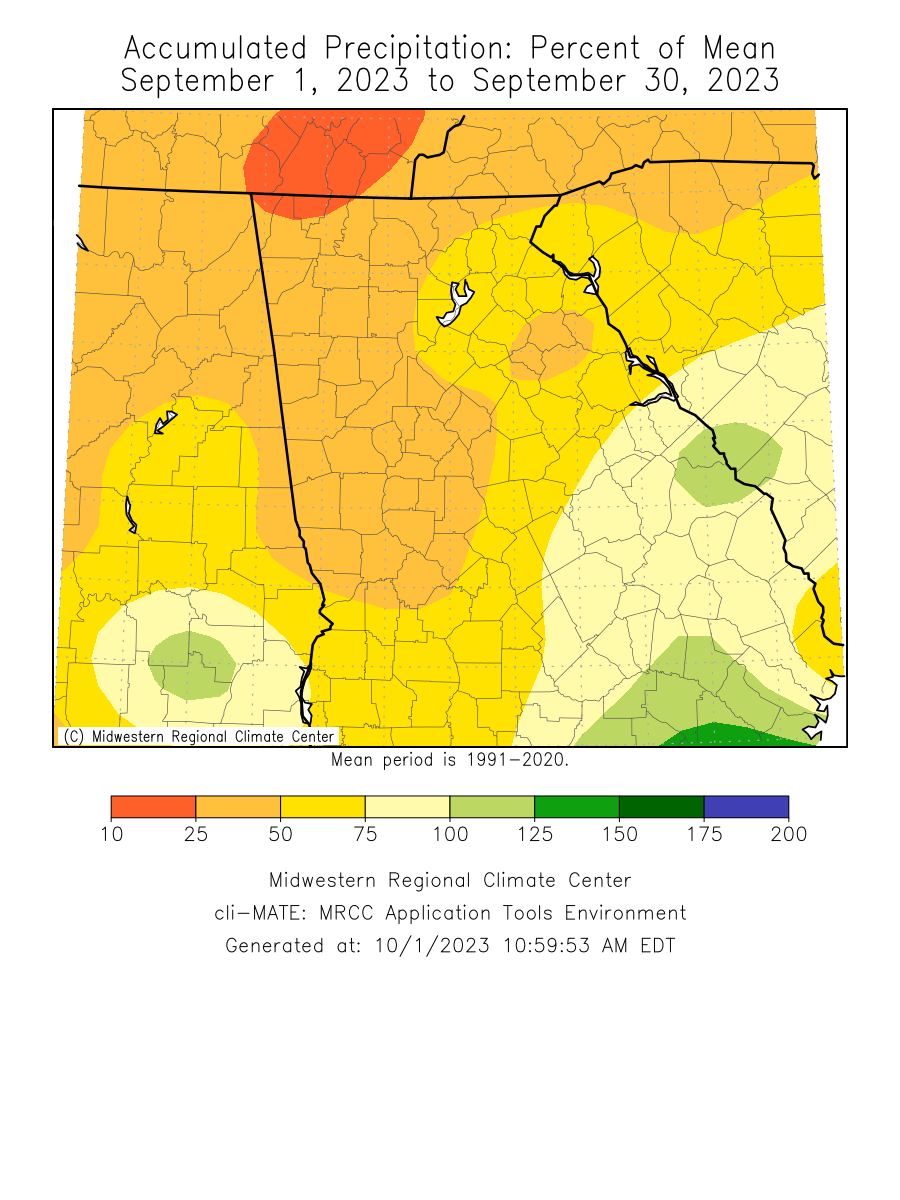
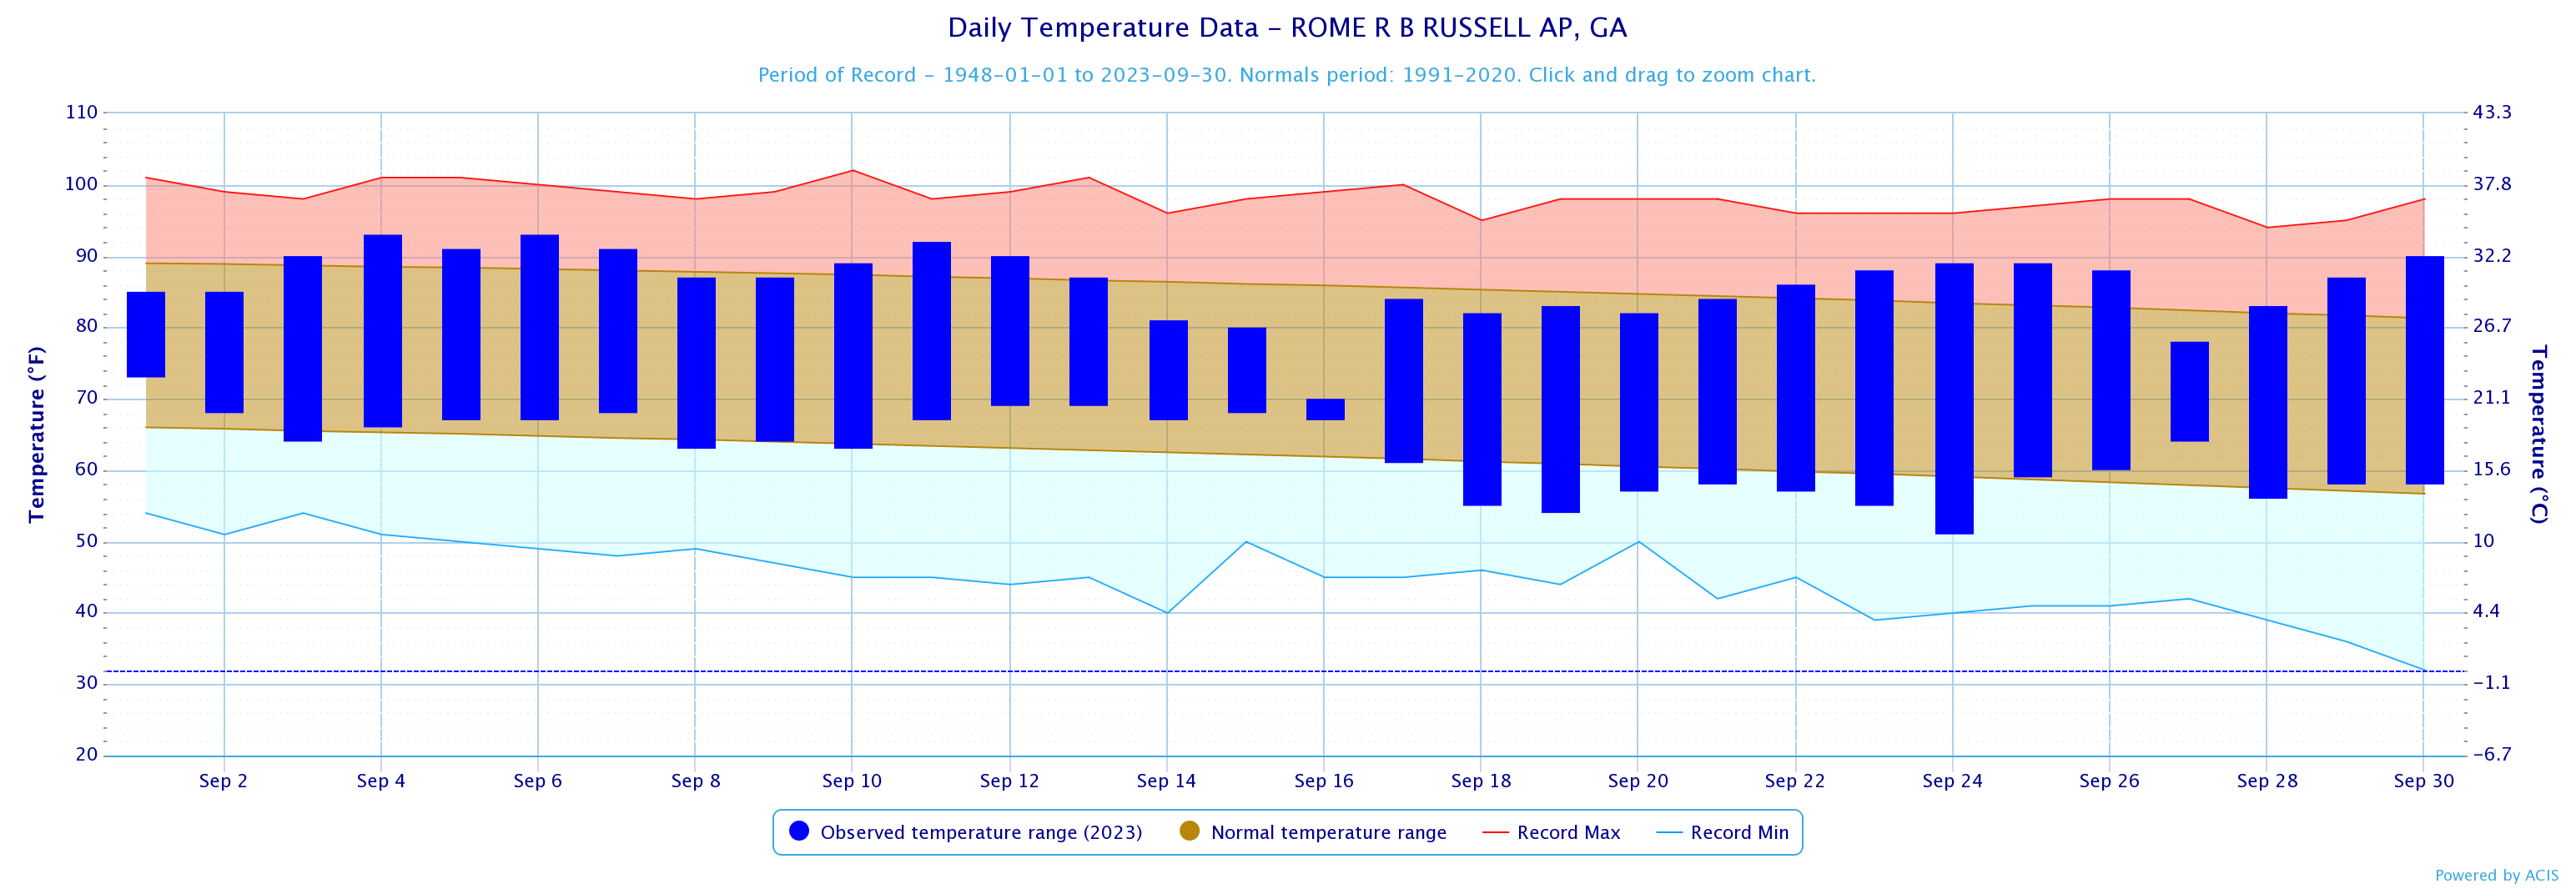
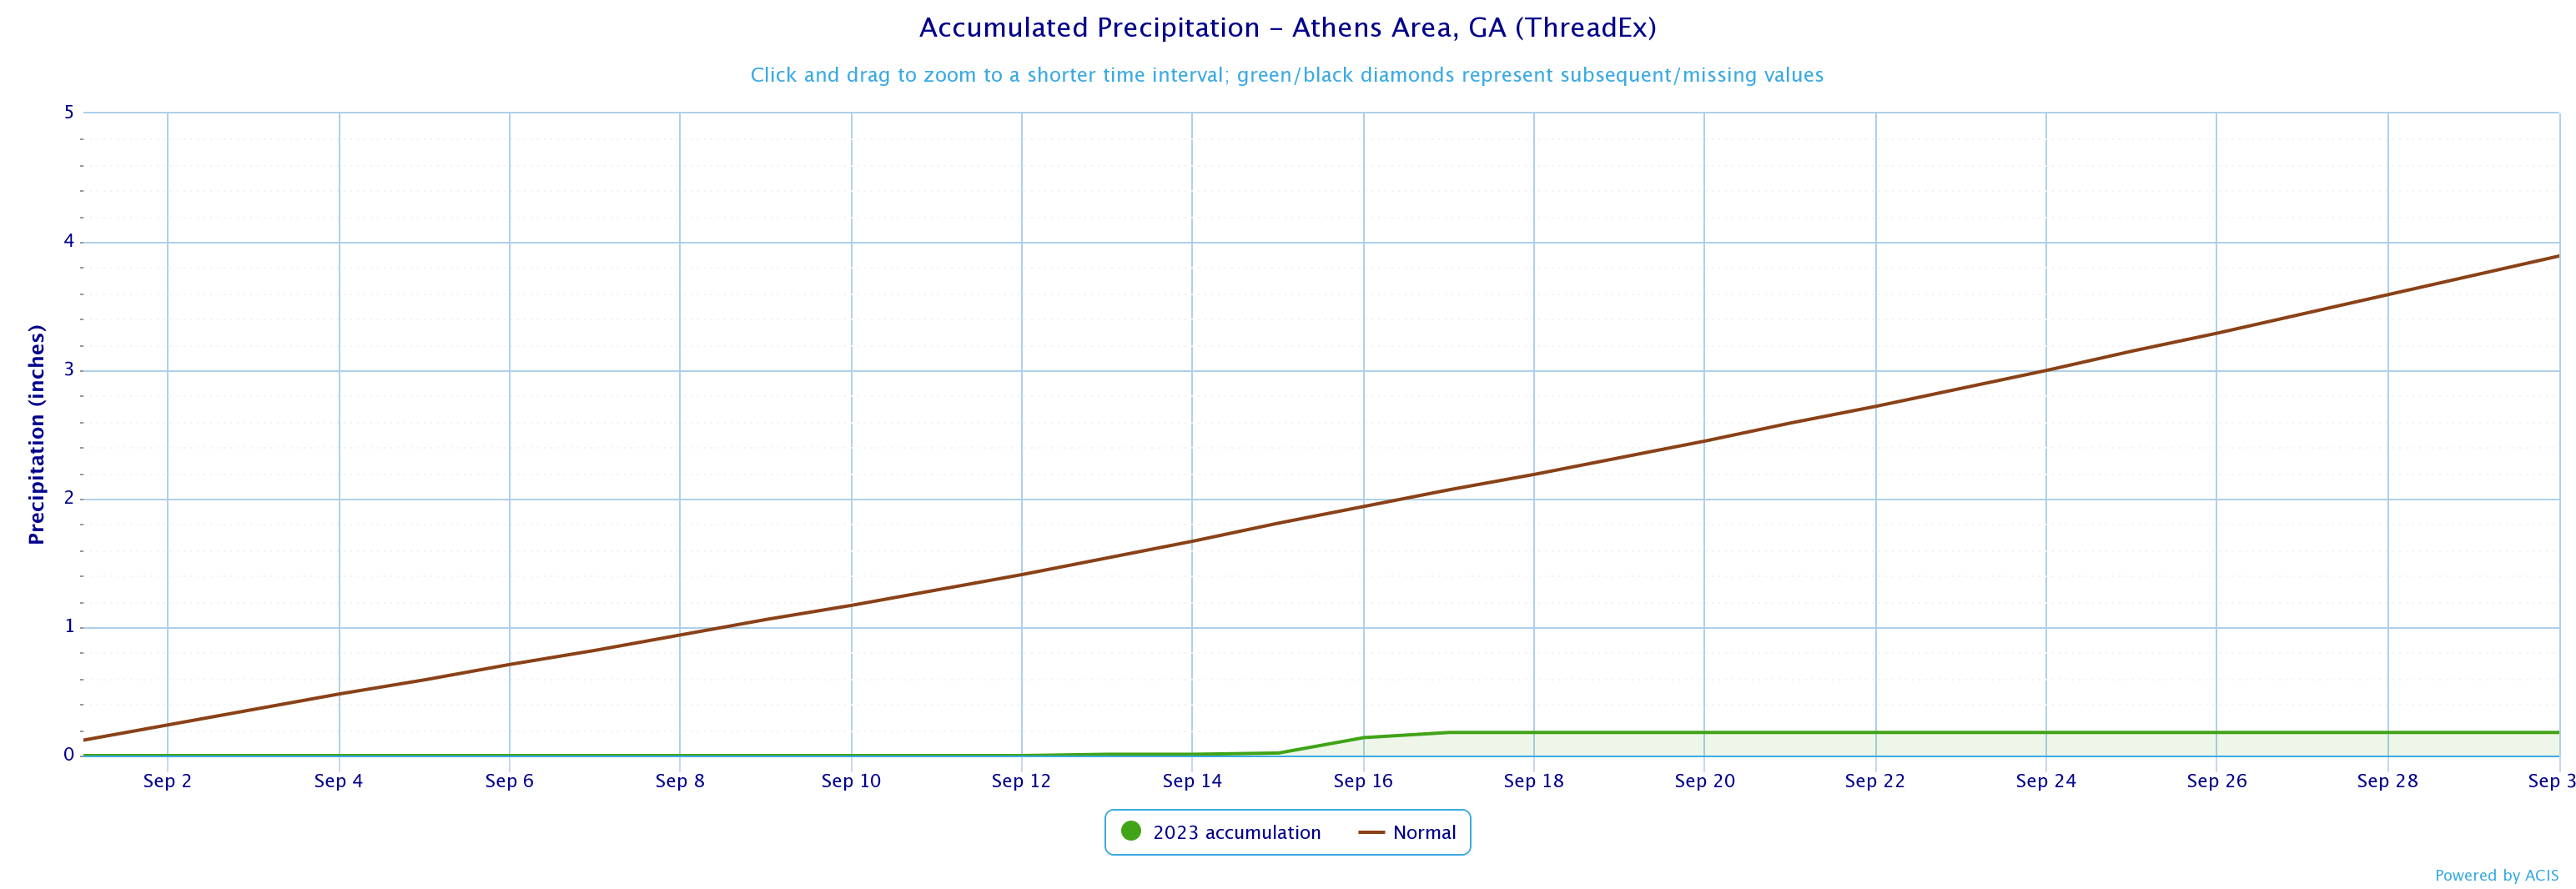
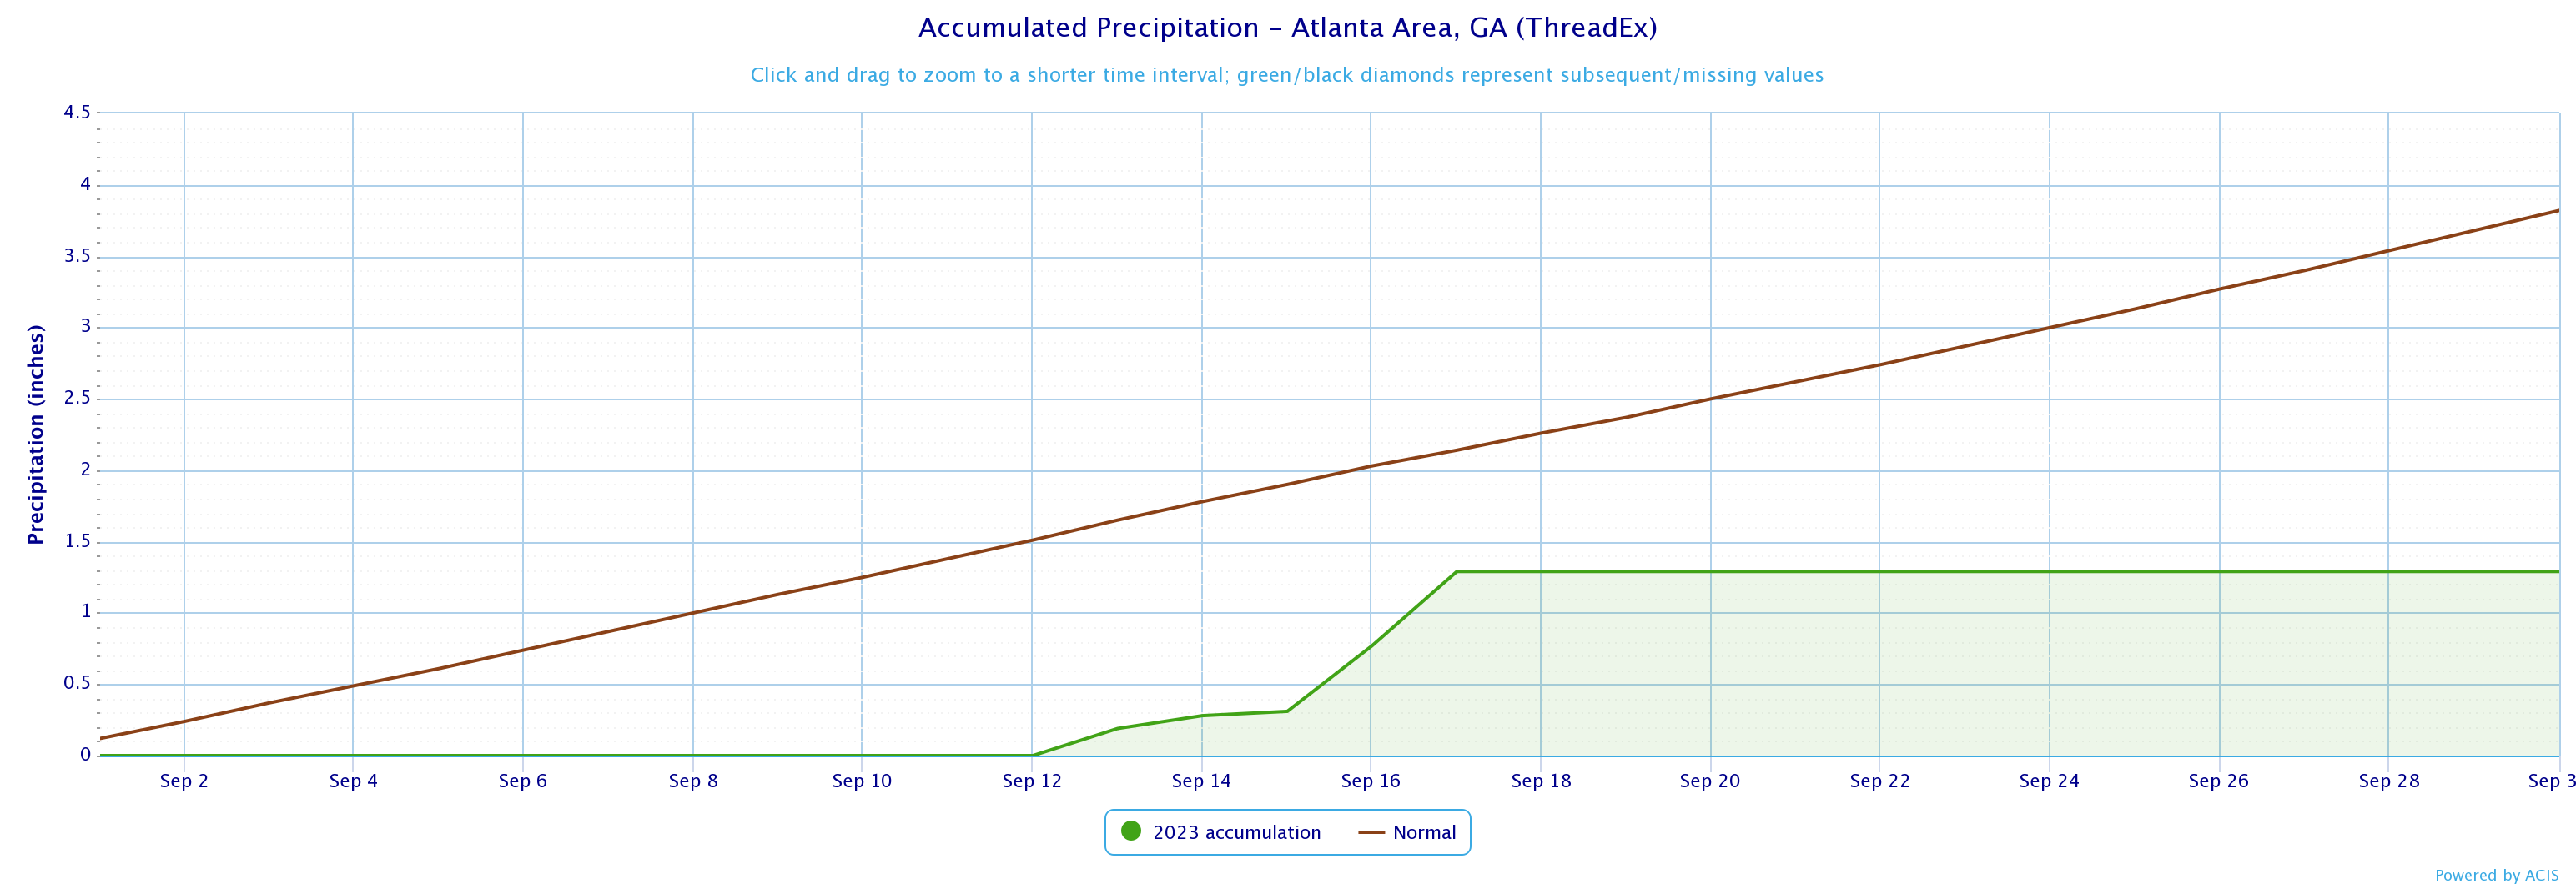
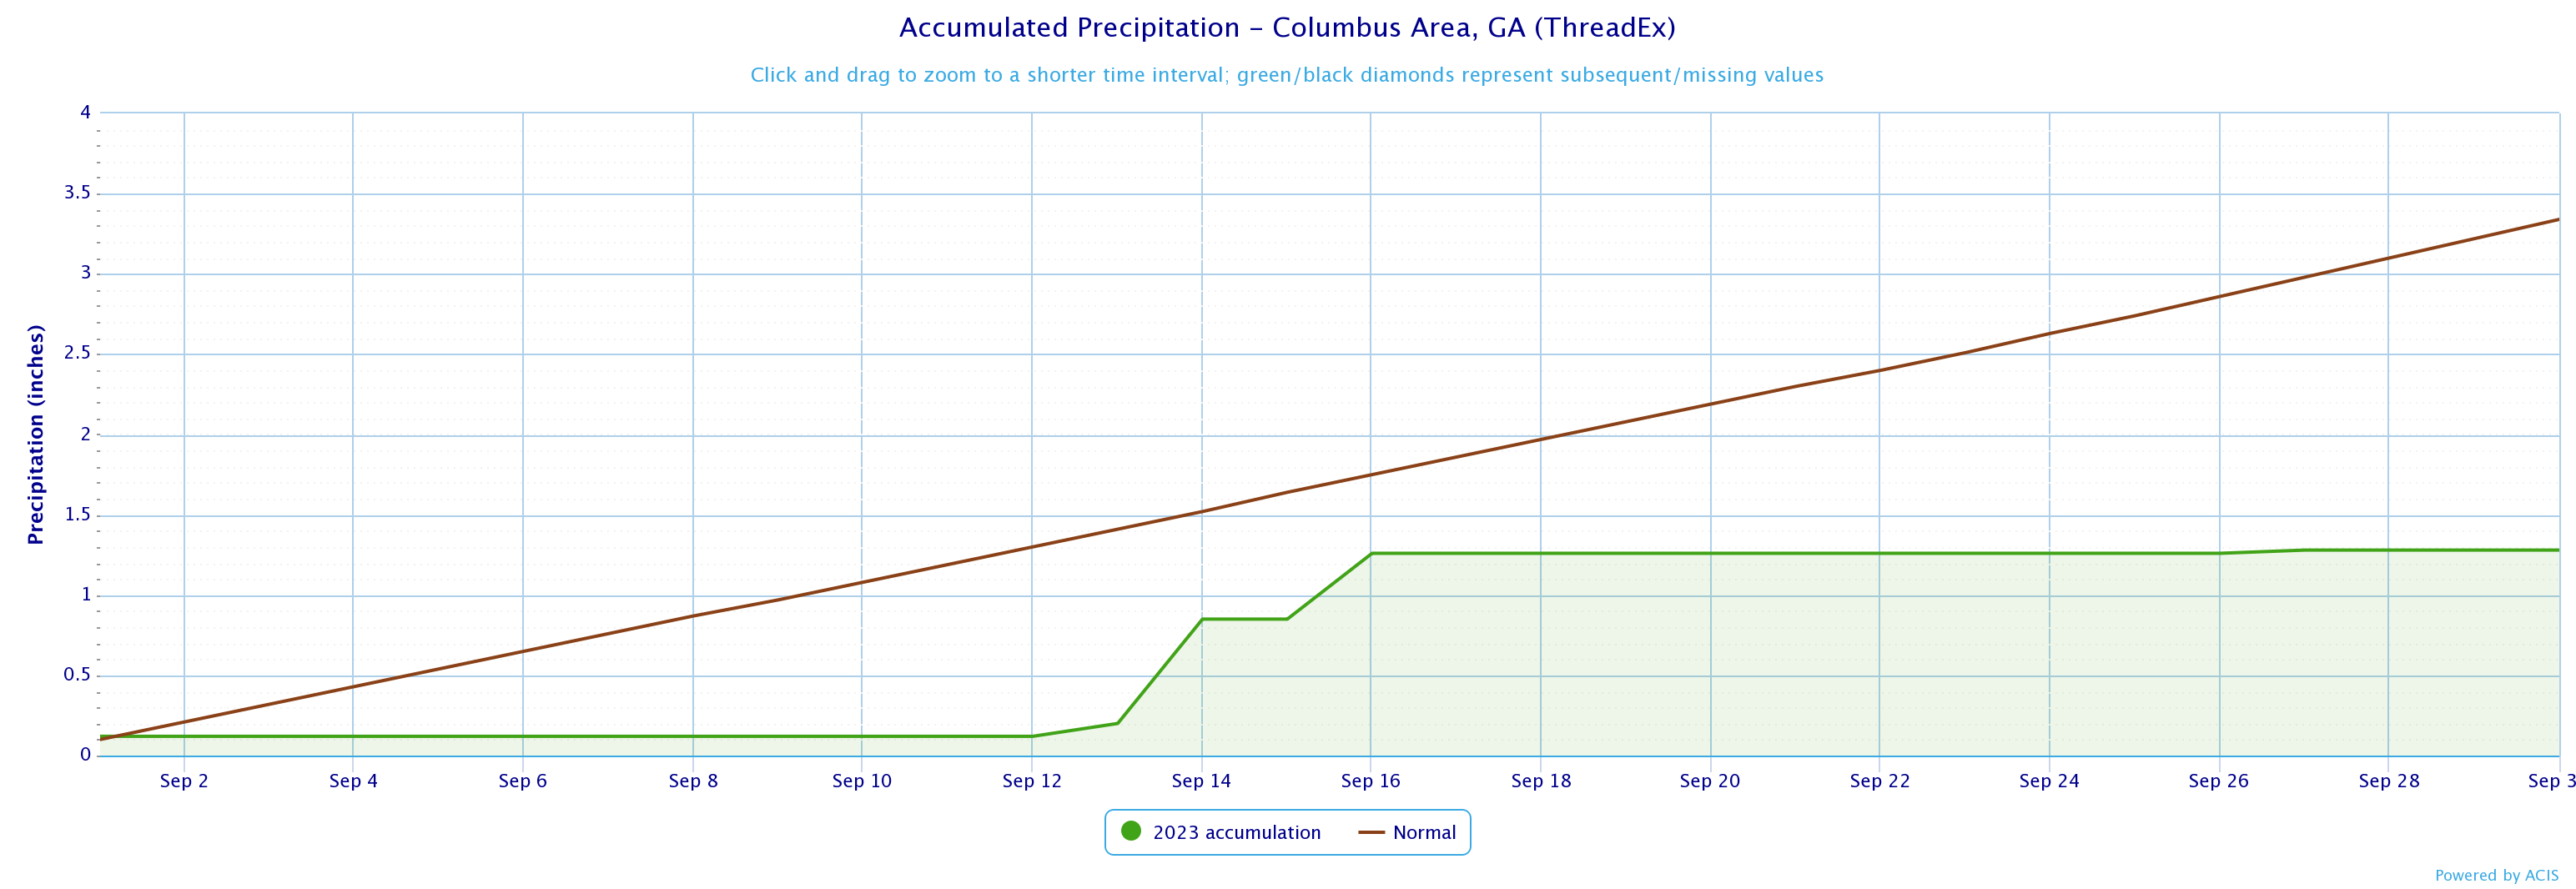
Temperatures through the month of September was within one degree of normal. Precipitation through the month of September was around two inches below normal.
|
September 2023 Monthly Rankings
|
||||
|
Climate Site |
Temperatures |
Precipitation |
||
|
Athens
|
52nd Warmest
|
3rd Driest
|
||
|
Atlanta
|
24th Warmest
|
27th Driest
|
||
|
Columbus
|
51st Coolest
|
30th Driest
|
||
|
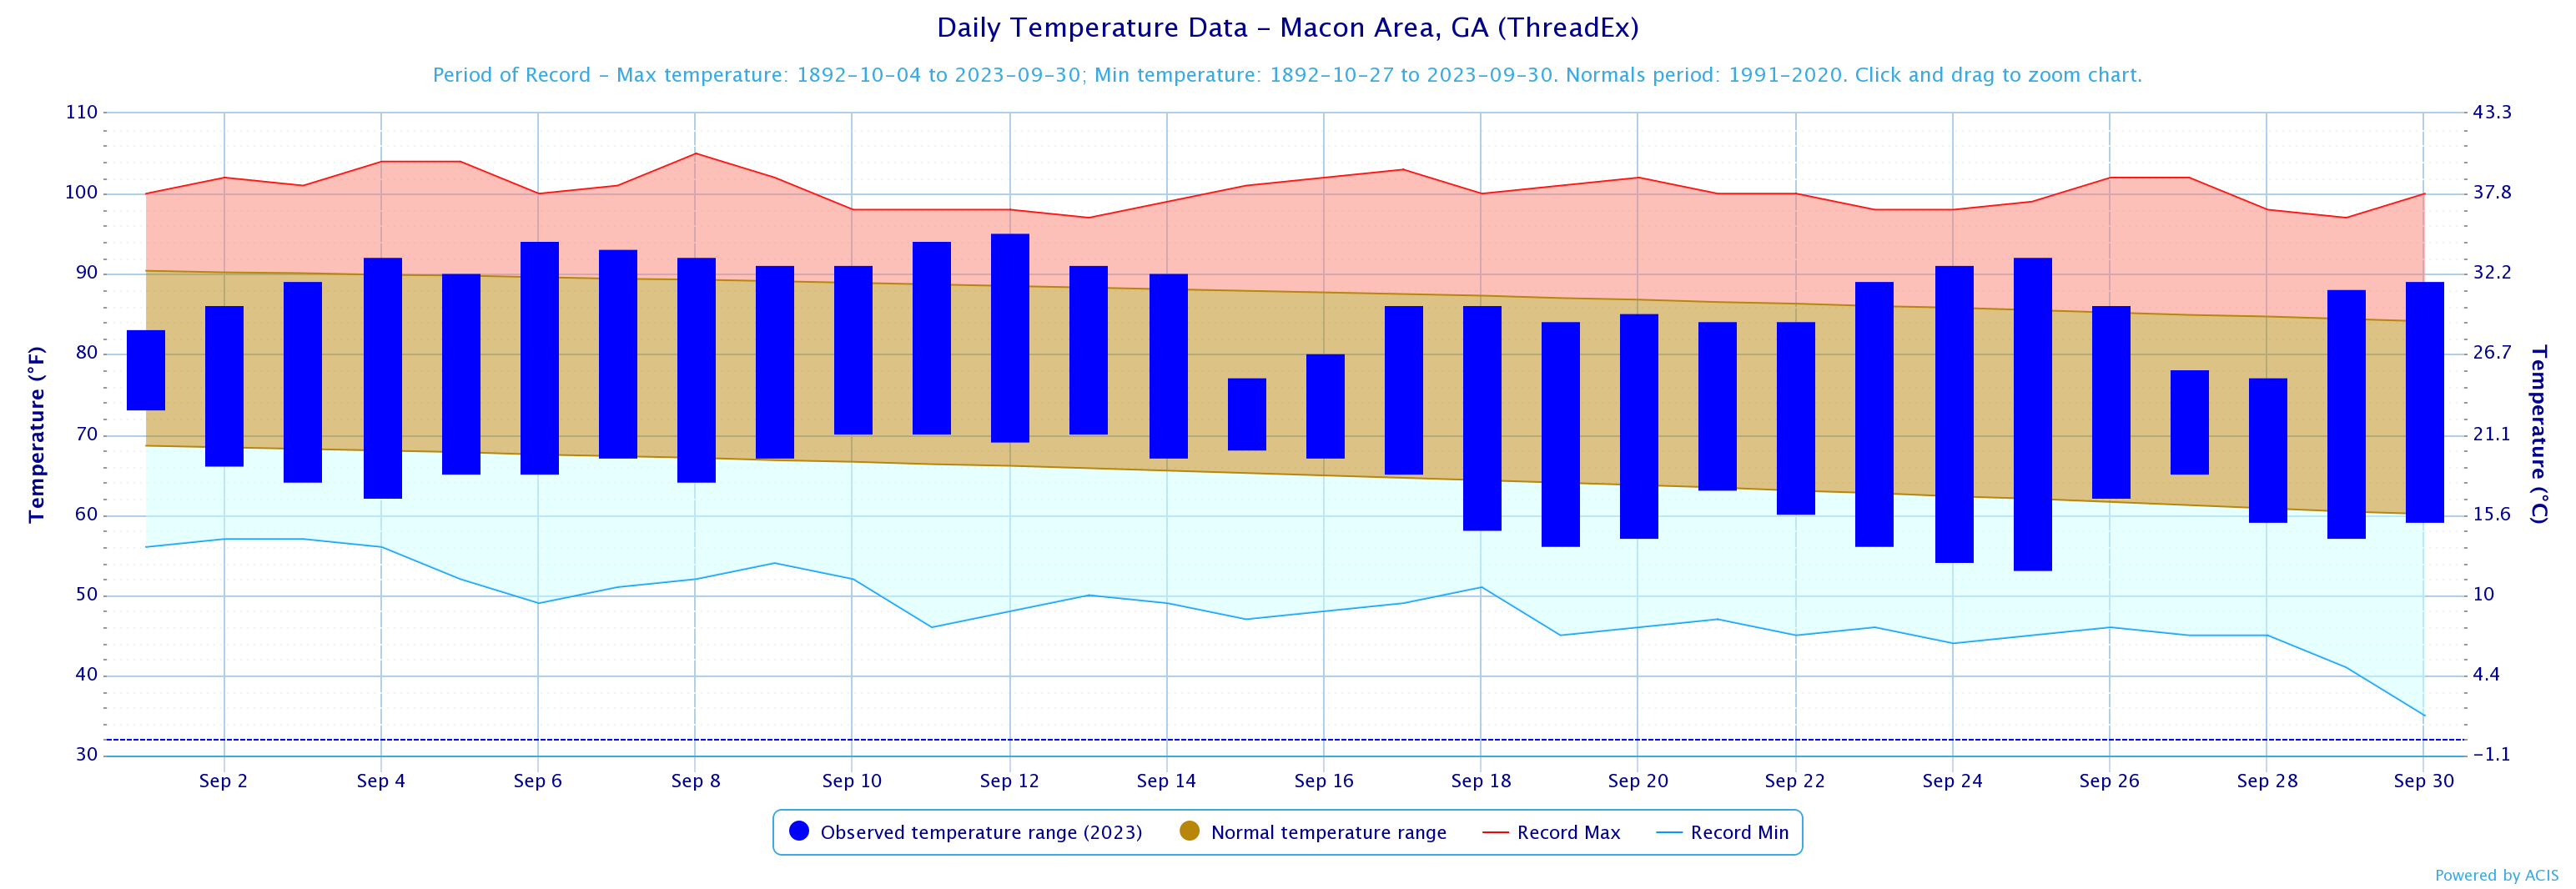
Macon
|
61st Coolest
|
16th Driest
|
||
|
Sep 2023 Climate Averages
|
|||
|
Climate Site
|
Sep Temp (°F)
|
Average Temp
|
Departure from Normal
|
|
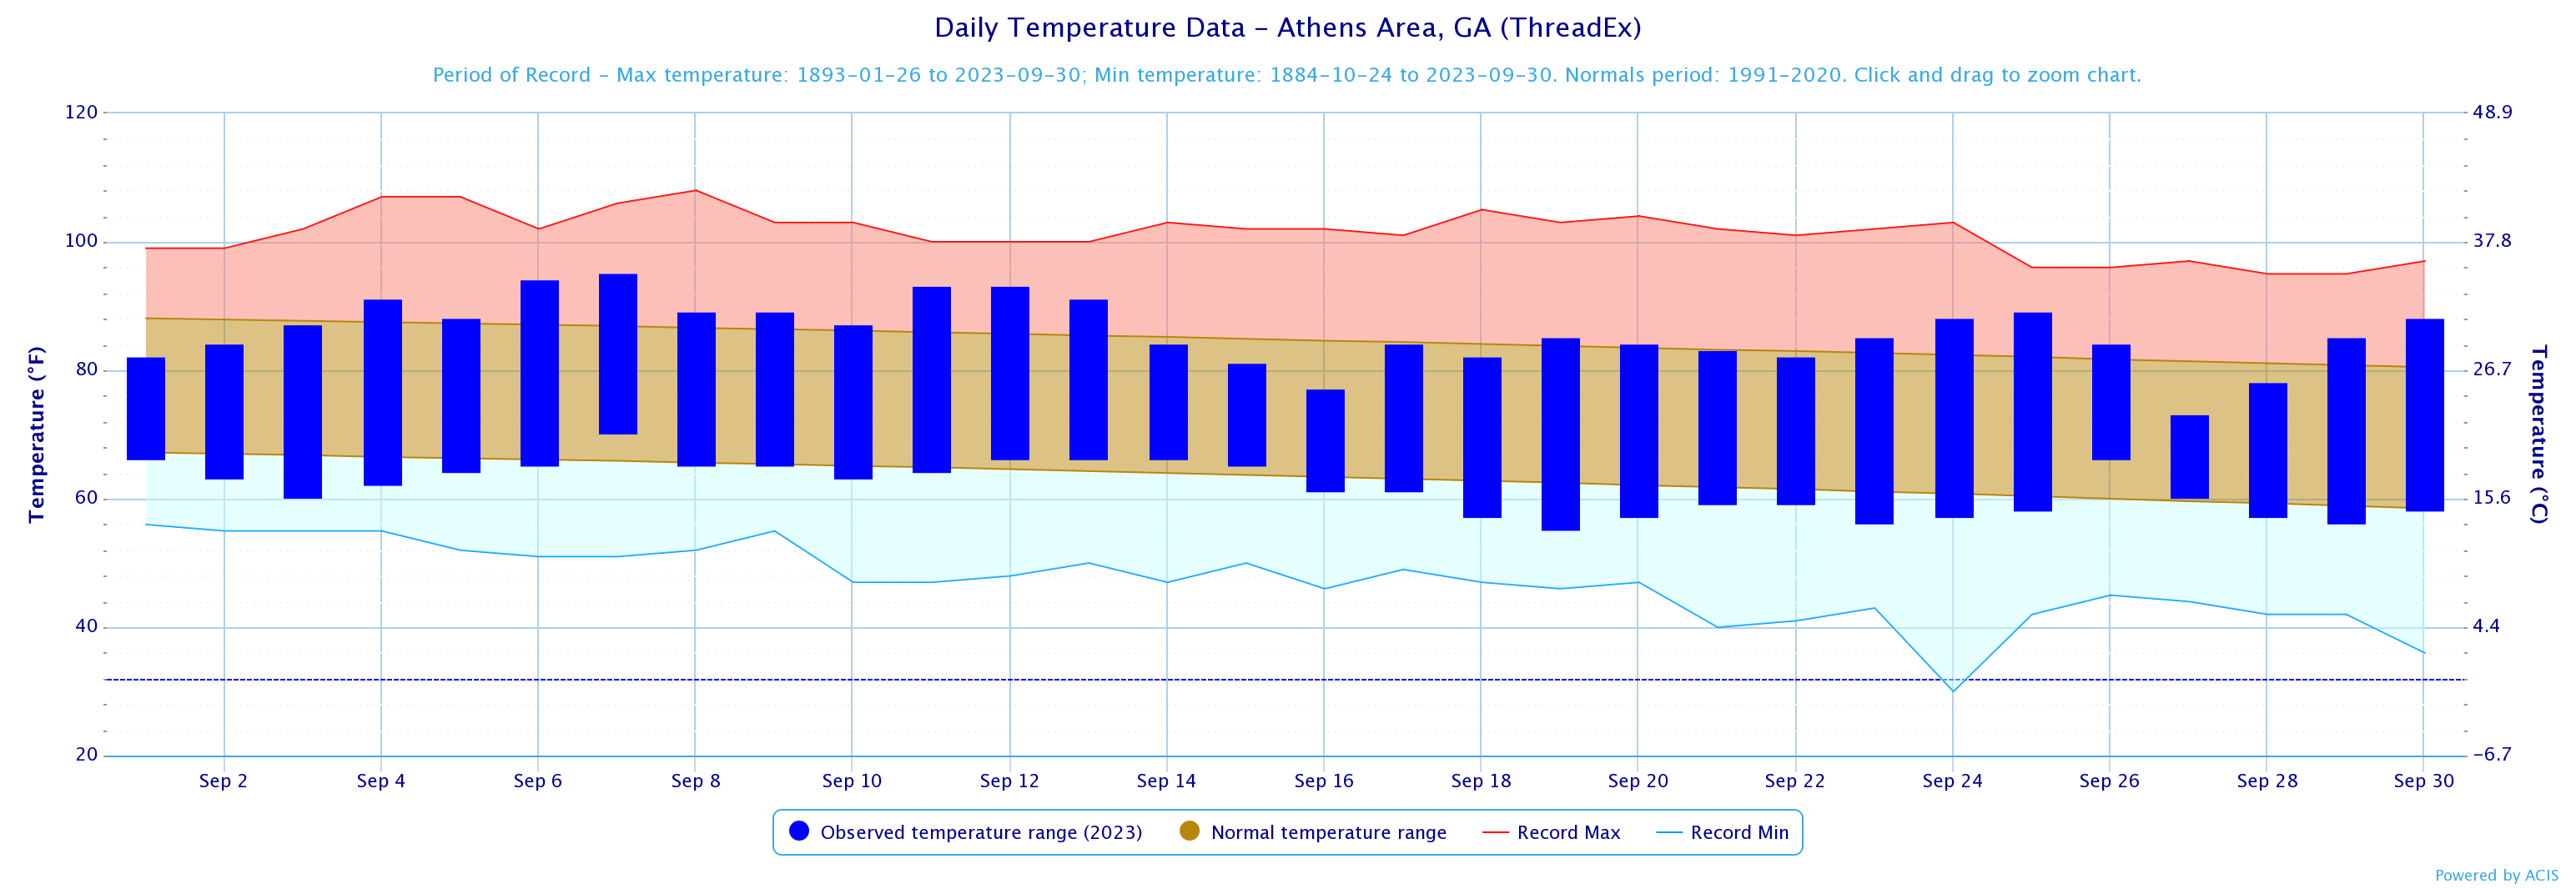
Athens
|
73.7
|
73.9
|
-0.2
|
|
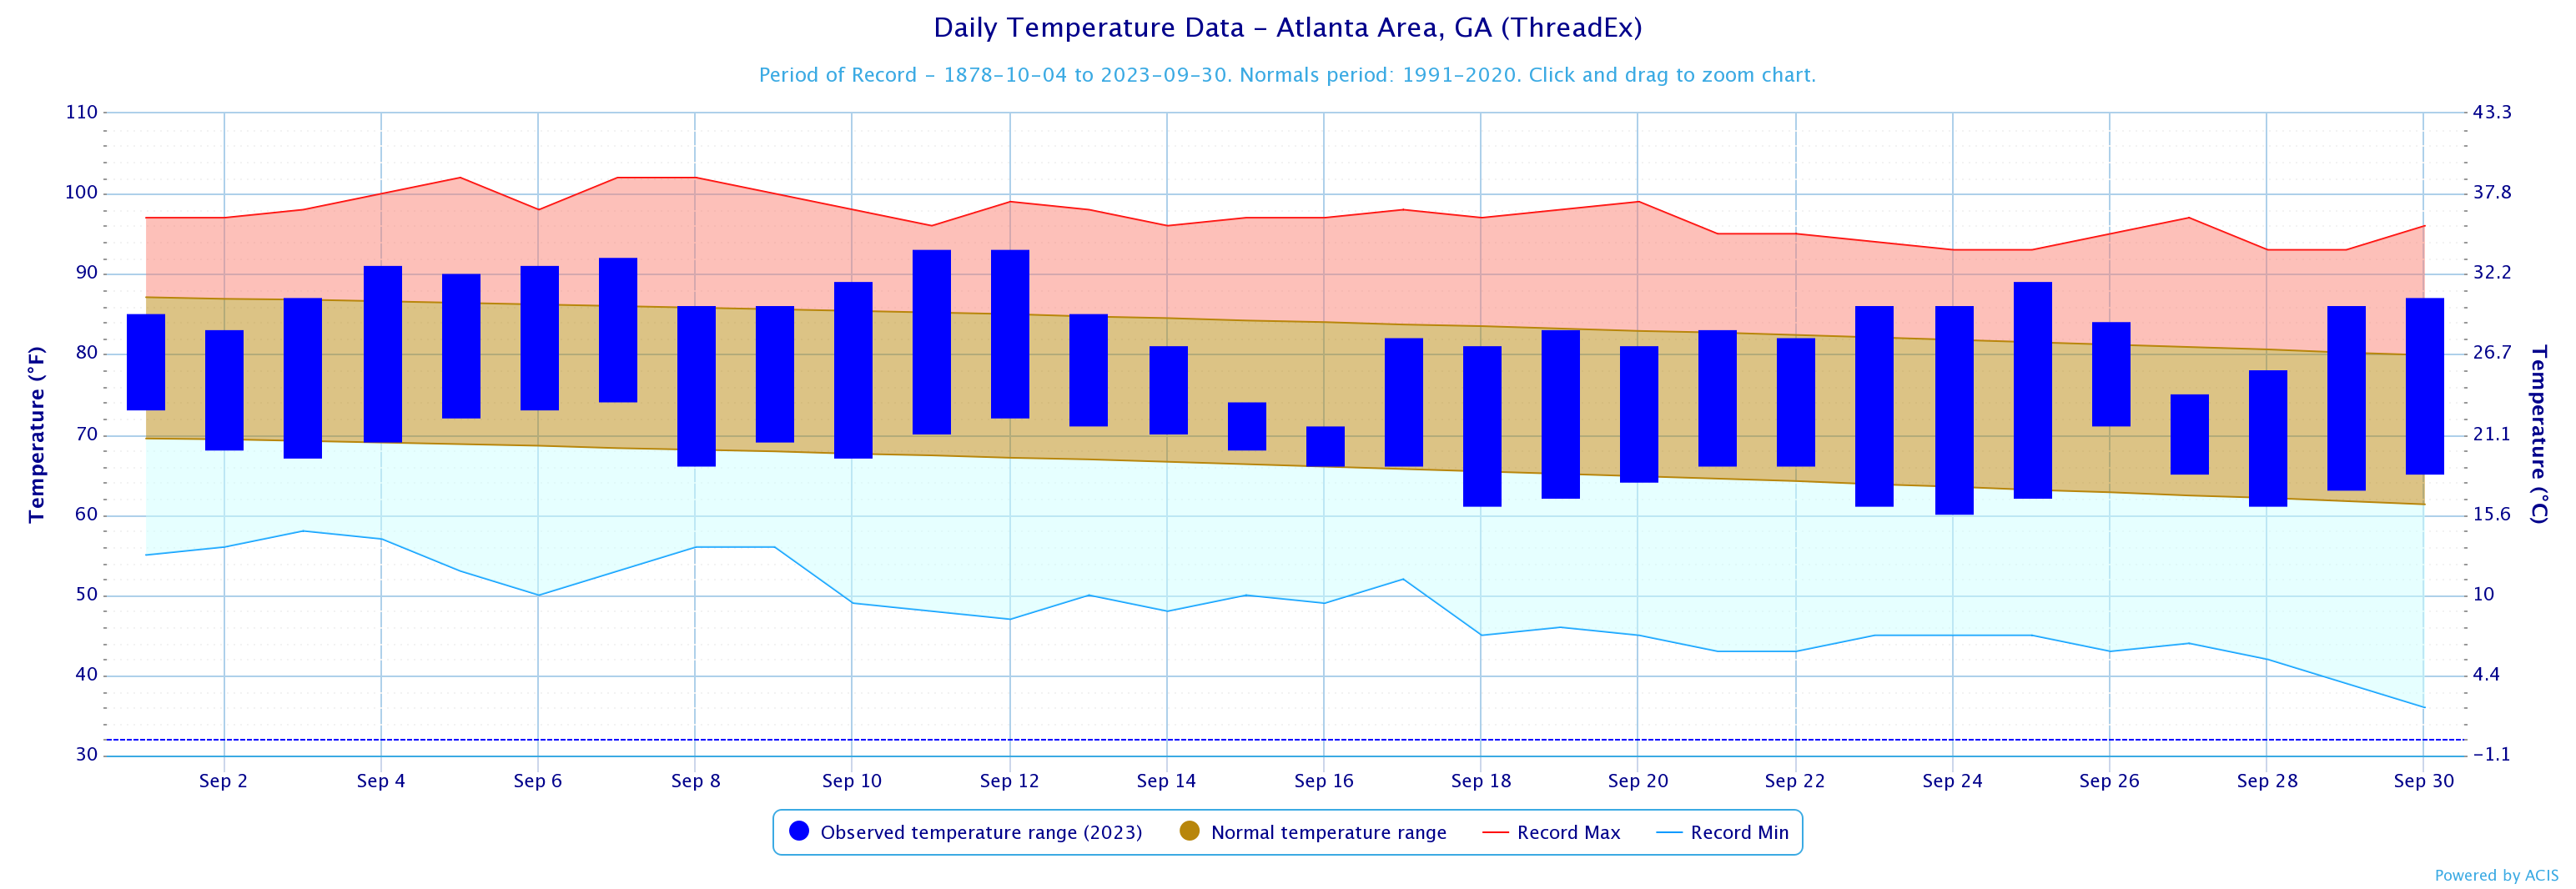
Atlanta
|
75.8
|
74.9
|
0.9
|
|
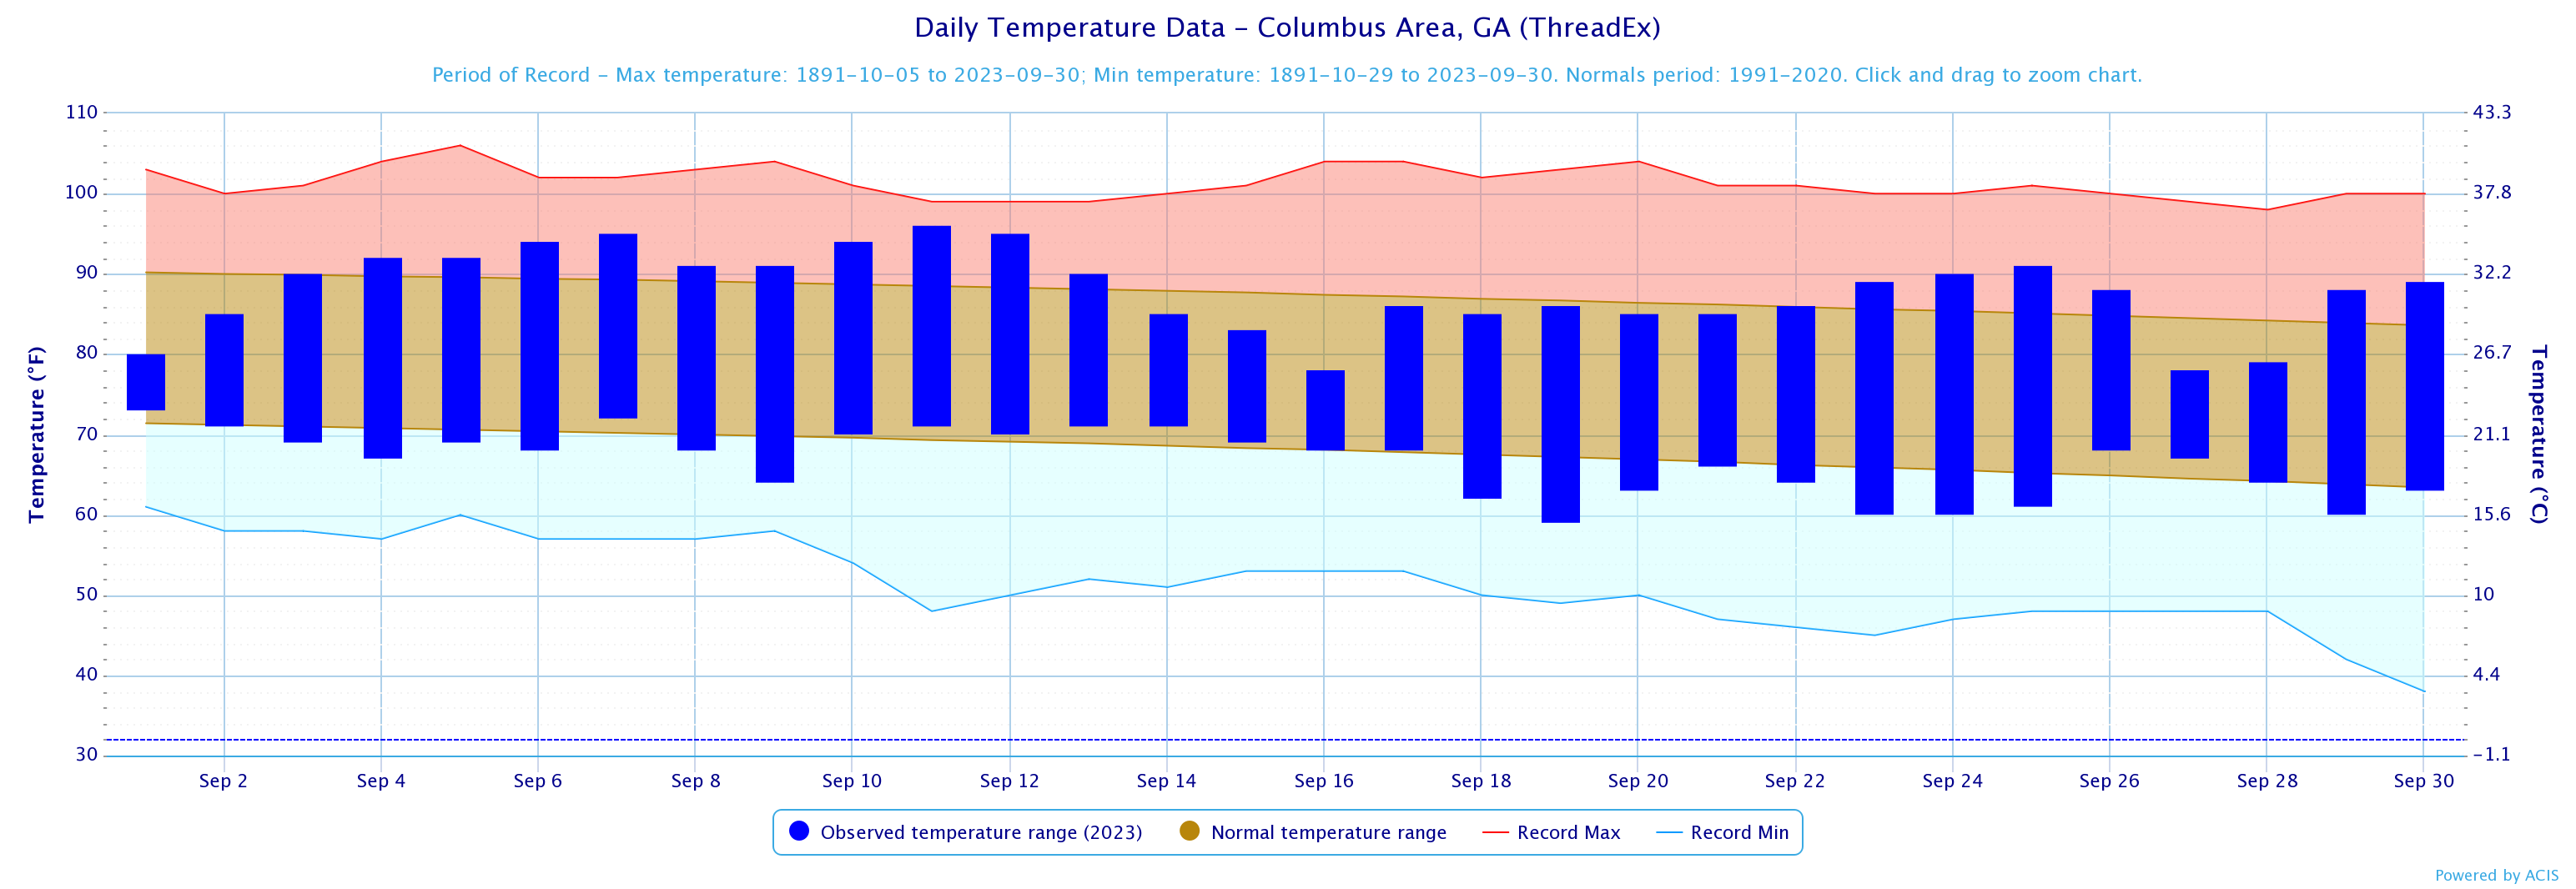
Columbus
|
77.2
|
77.6
|
-0.4
|
|
Macon
|
75.4
|
76.2
|
-0.8
|
|
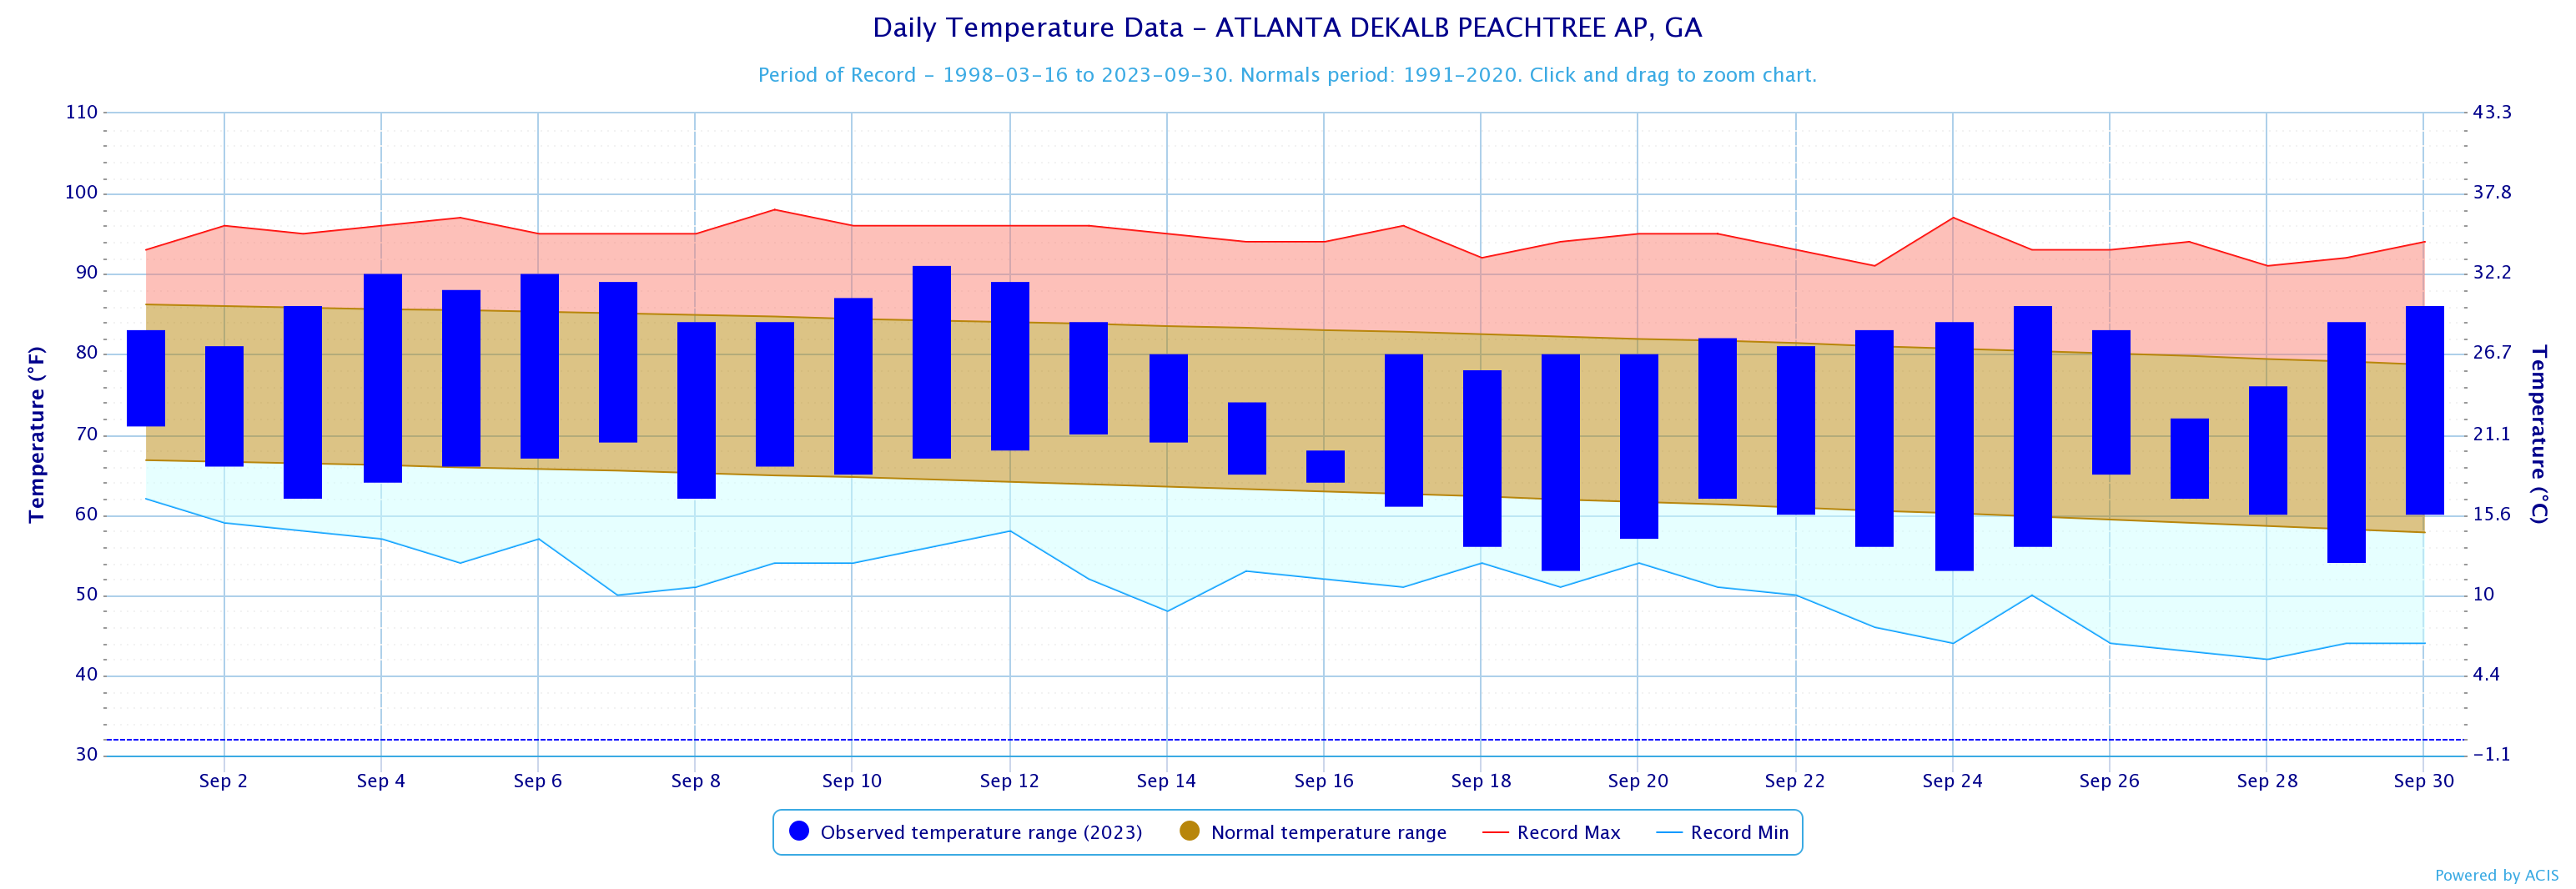
Dekalb Peachtree Arpt
|
72.7
|
72.9
|
-0.2
|
|
Fulton Co Arpt
|
73.4
|
73.5
|
-0.1
|
|
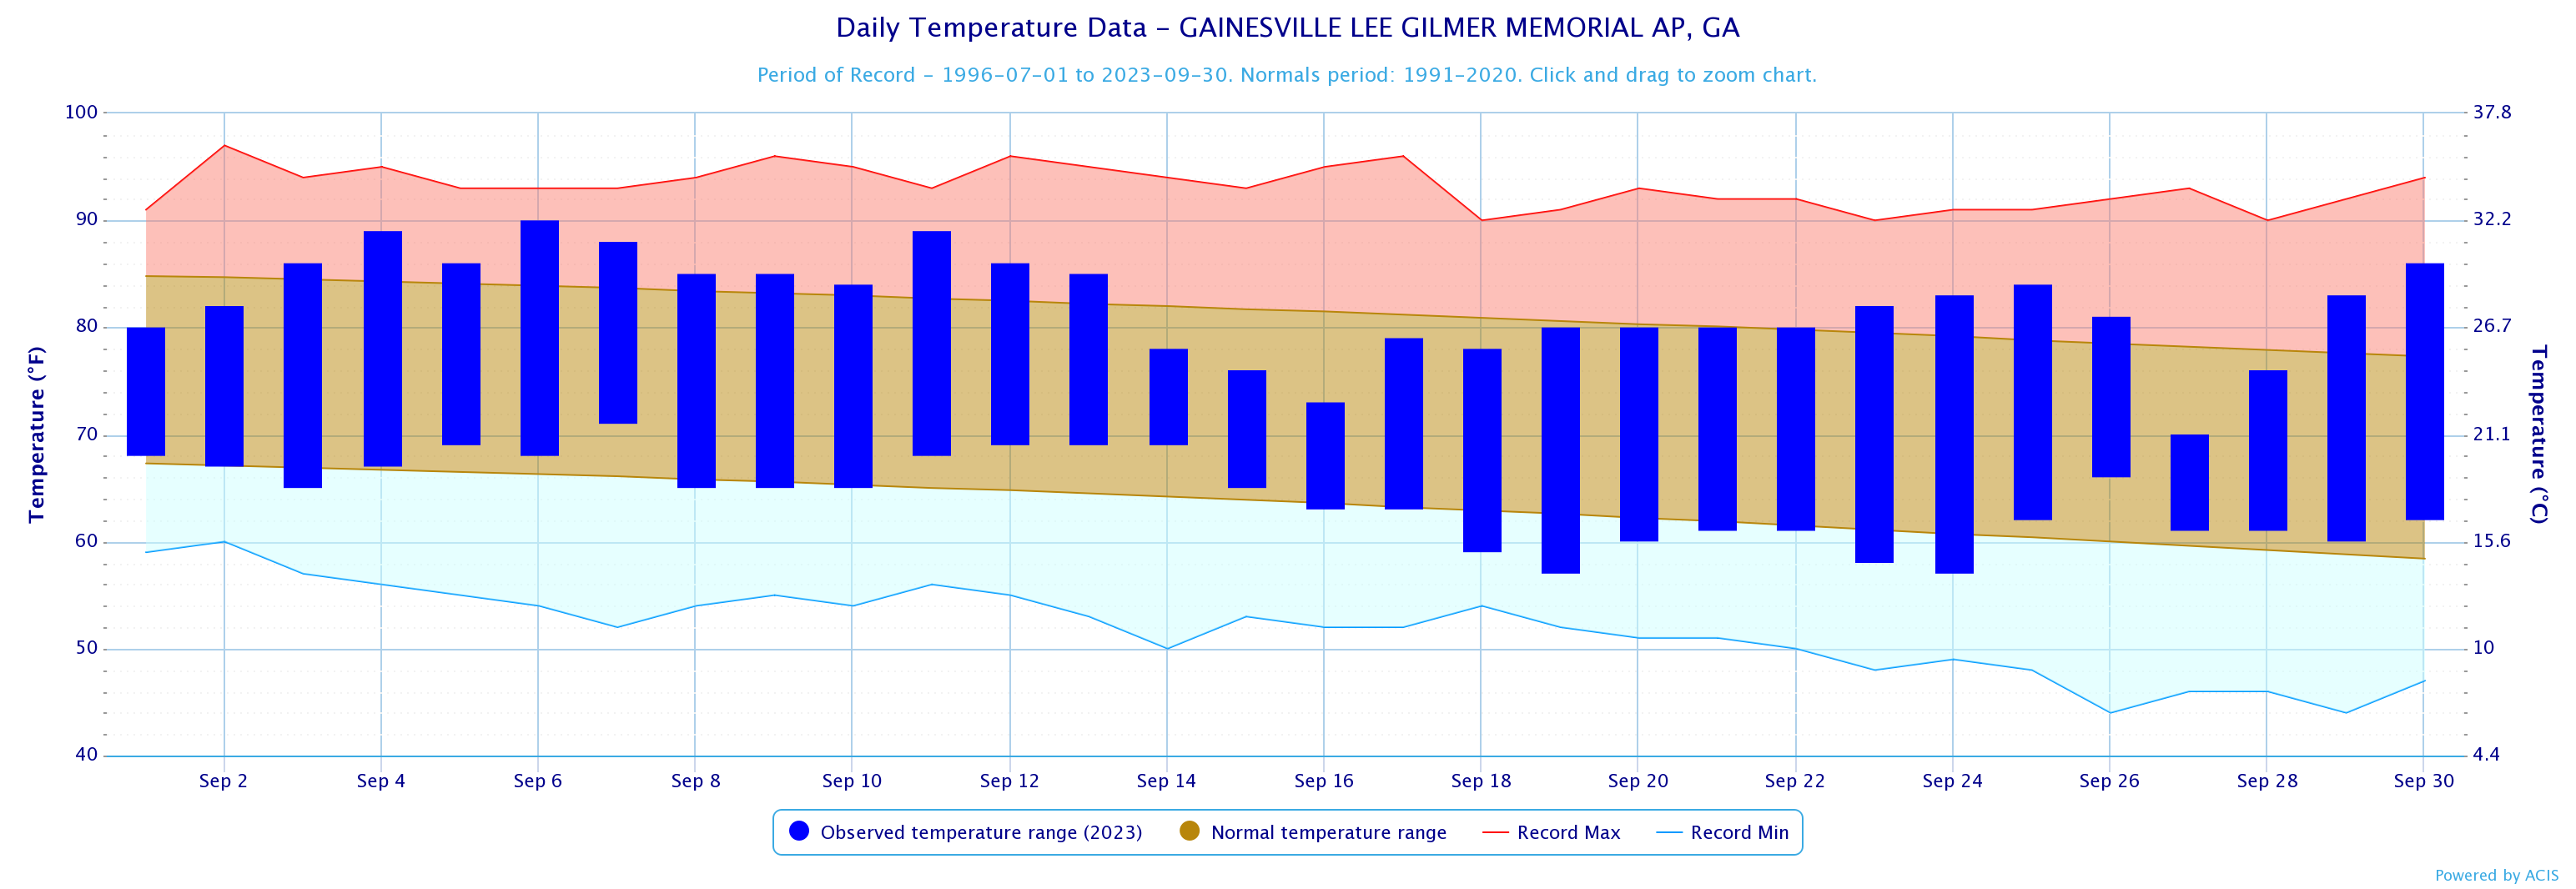
Gainesville
|
73.1
|
72.4
|
0.7
|
|
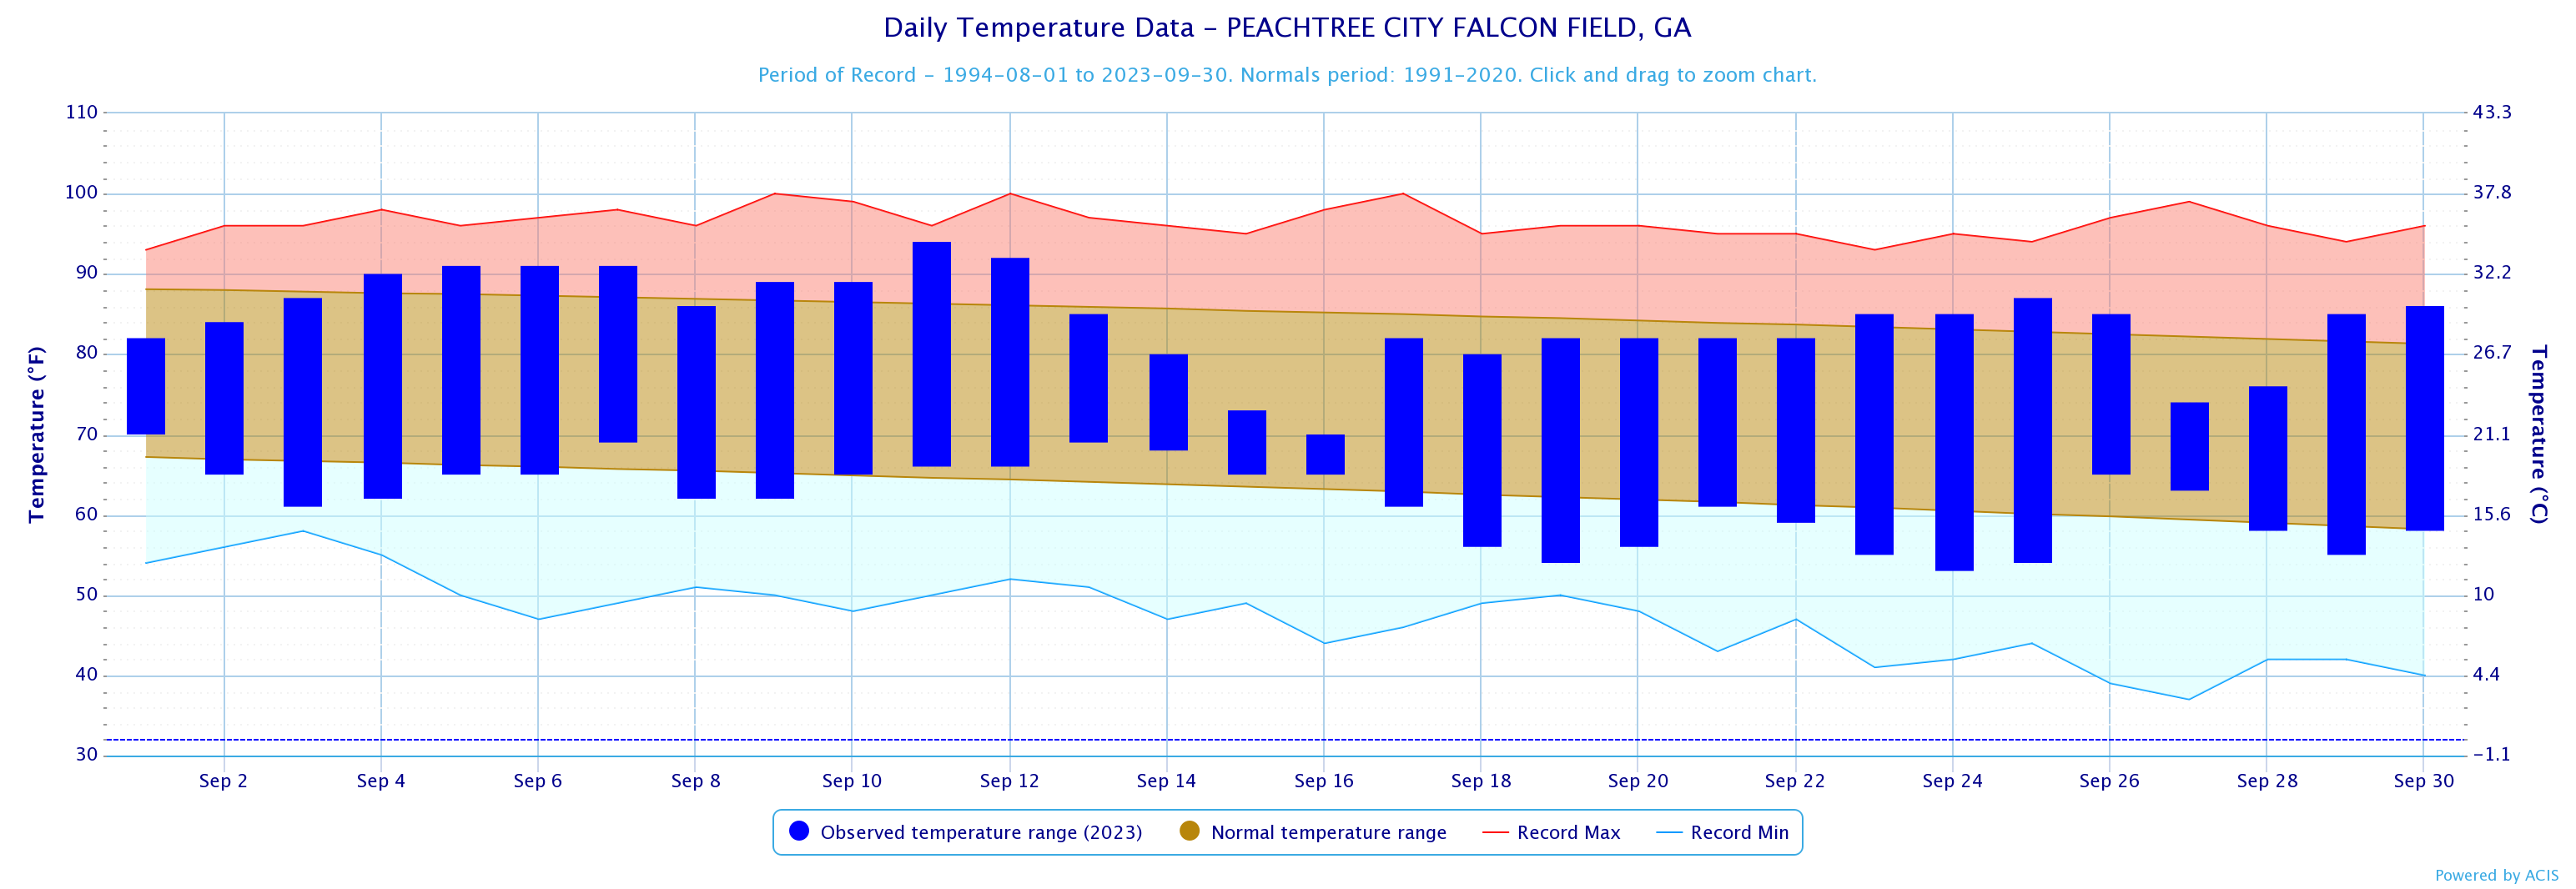
Peachtree City
|
73.0
|
74.1
|
-1.1
|
|
Rome
|
74.3
|
73.8
|
0.5
|
|
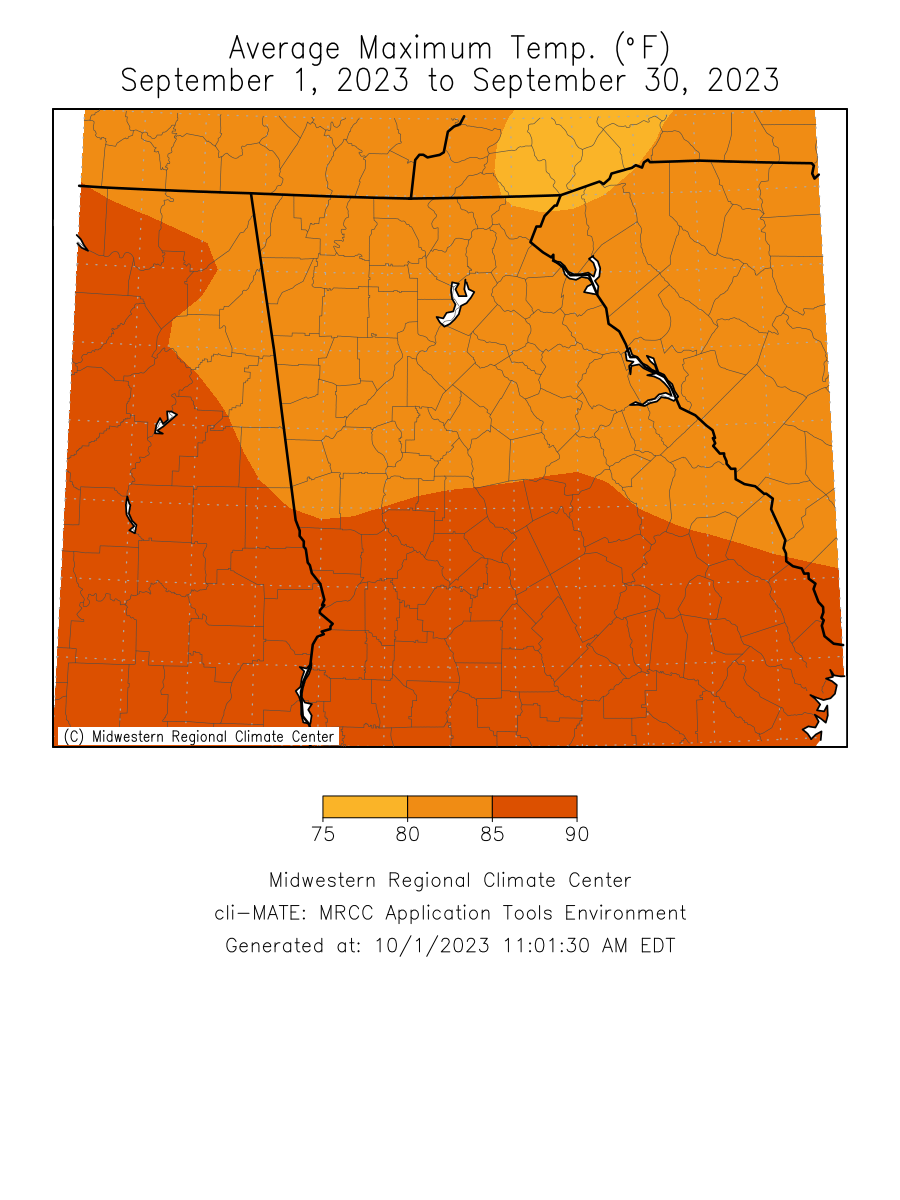
Sep 2023 Temperature Climate Statistics
|
||||
|
Climate Site |
Maximum Temperature |
Max T Date |
Minimum Temperature
|
Min T Date
|
|
Athens
|
95
|
9/7
|
55
|
9/19
|
|
Atlanta
|
93
|
9/11, 12
|
60
|
9/24
|
|
Columbus
|
96
|
9/11
|
59
|
9/19
|
|
Macon
|
95
|
9/12
|
53
|
9/19, 24
|
|
Dekalb Peachtree Arpt
|
91
|
9/11
|
53
|
9/19, 24
|
|
Fulton Co Arpt
|
91
|
9/11, 12
|
55
|
9/19, 24
|
|
Gainesville
|
90
|
9/6
|
57
|
9/19, 24
|
|
Peachtree City
|
94
|
9/11
|
53
|
9/24
|
|
Rome
|
93
|
9/4, 6
|
51
|
9/24
|
|
Sep 2023 Precipitation Climate Statistics
|
|||
|
Climate Site |
Total Precipitation |
Average Precipitation
|
DFN (Departure From Normal)
|
|
Athens
|
0.18
|
3.89
|
-3.71
|
|
Atlanta
|
1.29
|
3.82
|
-2.53
|
|
Columbus
|
1.28
|
3.34
|
-2.06
|
|
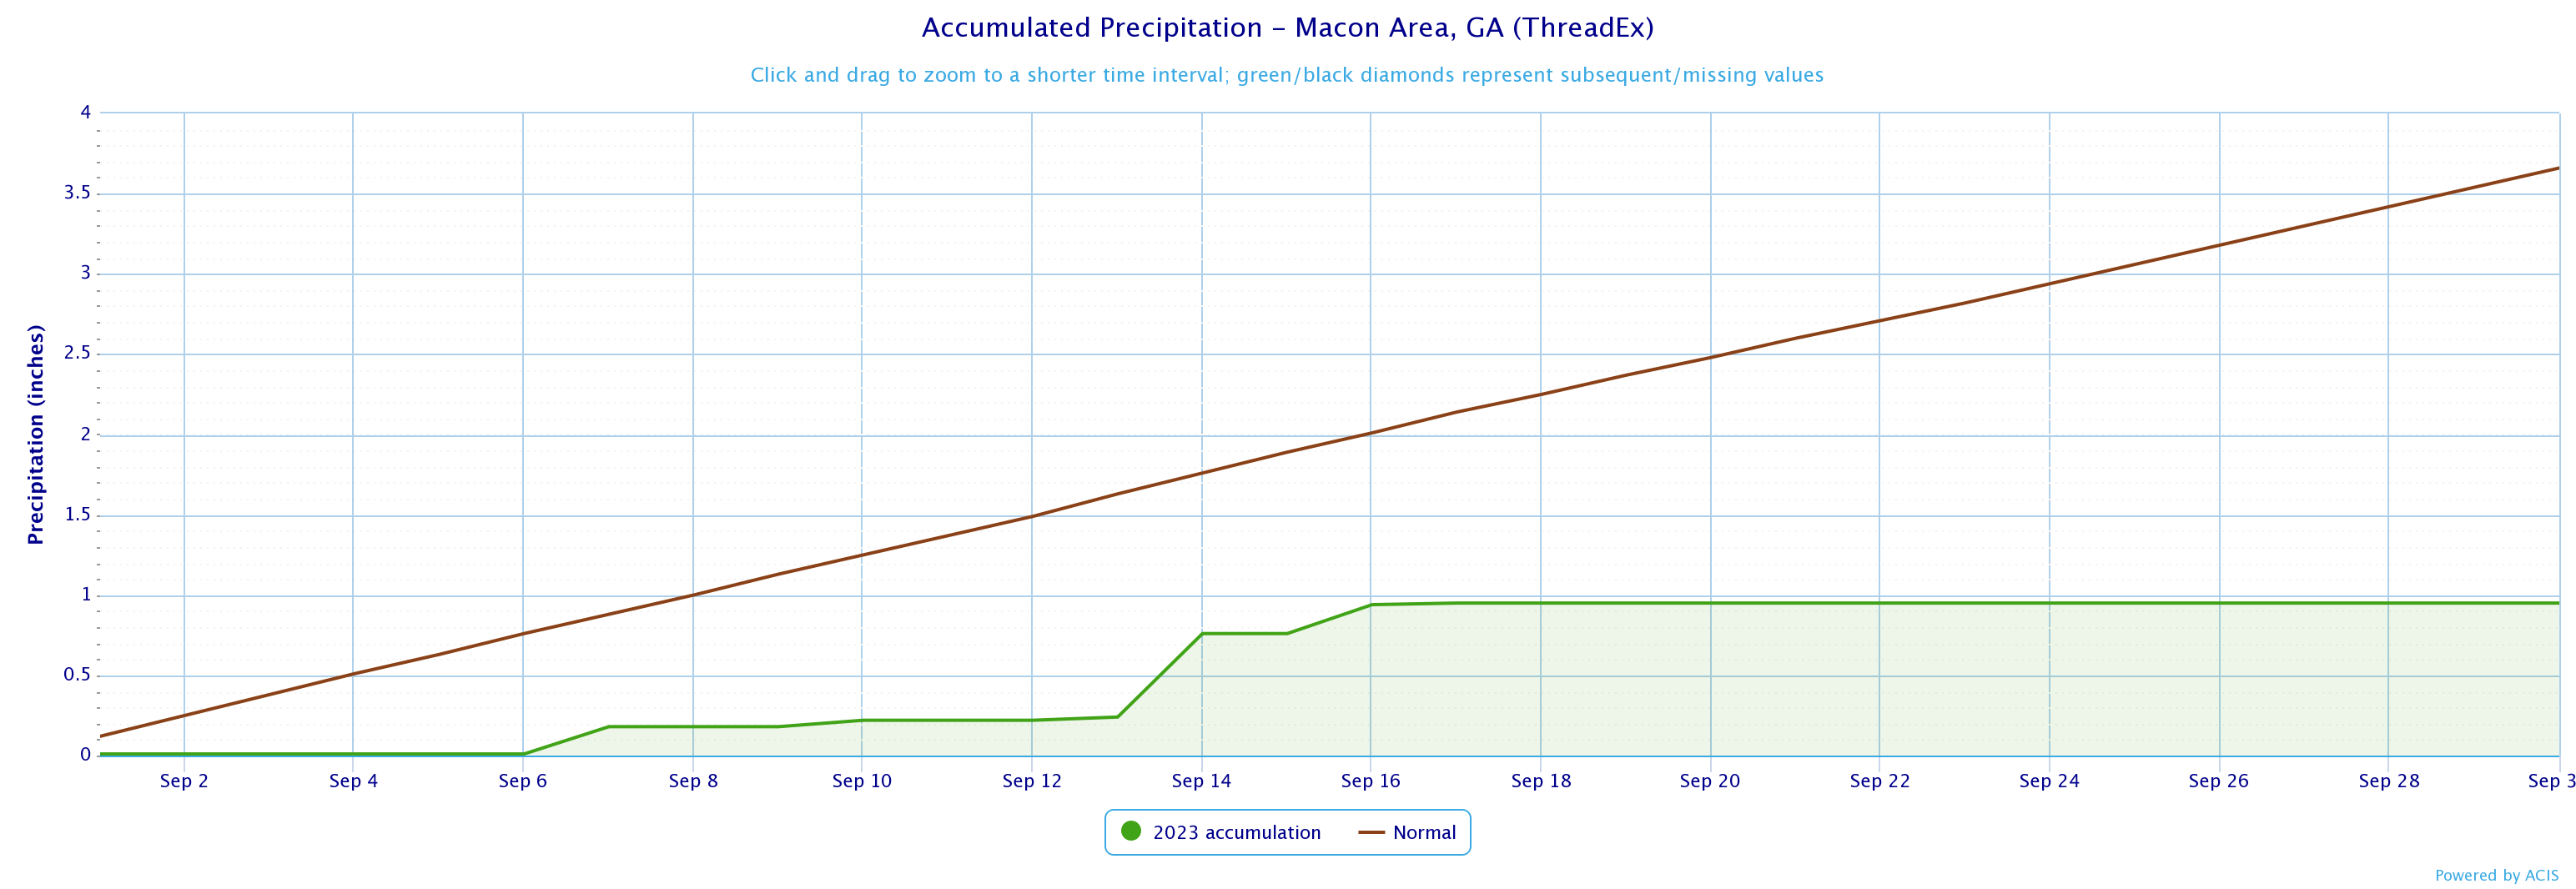
Macon
|
0.95
|
3.87
|
-2.71
|
|
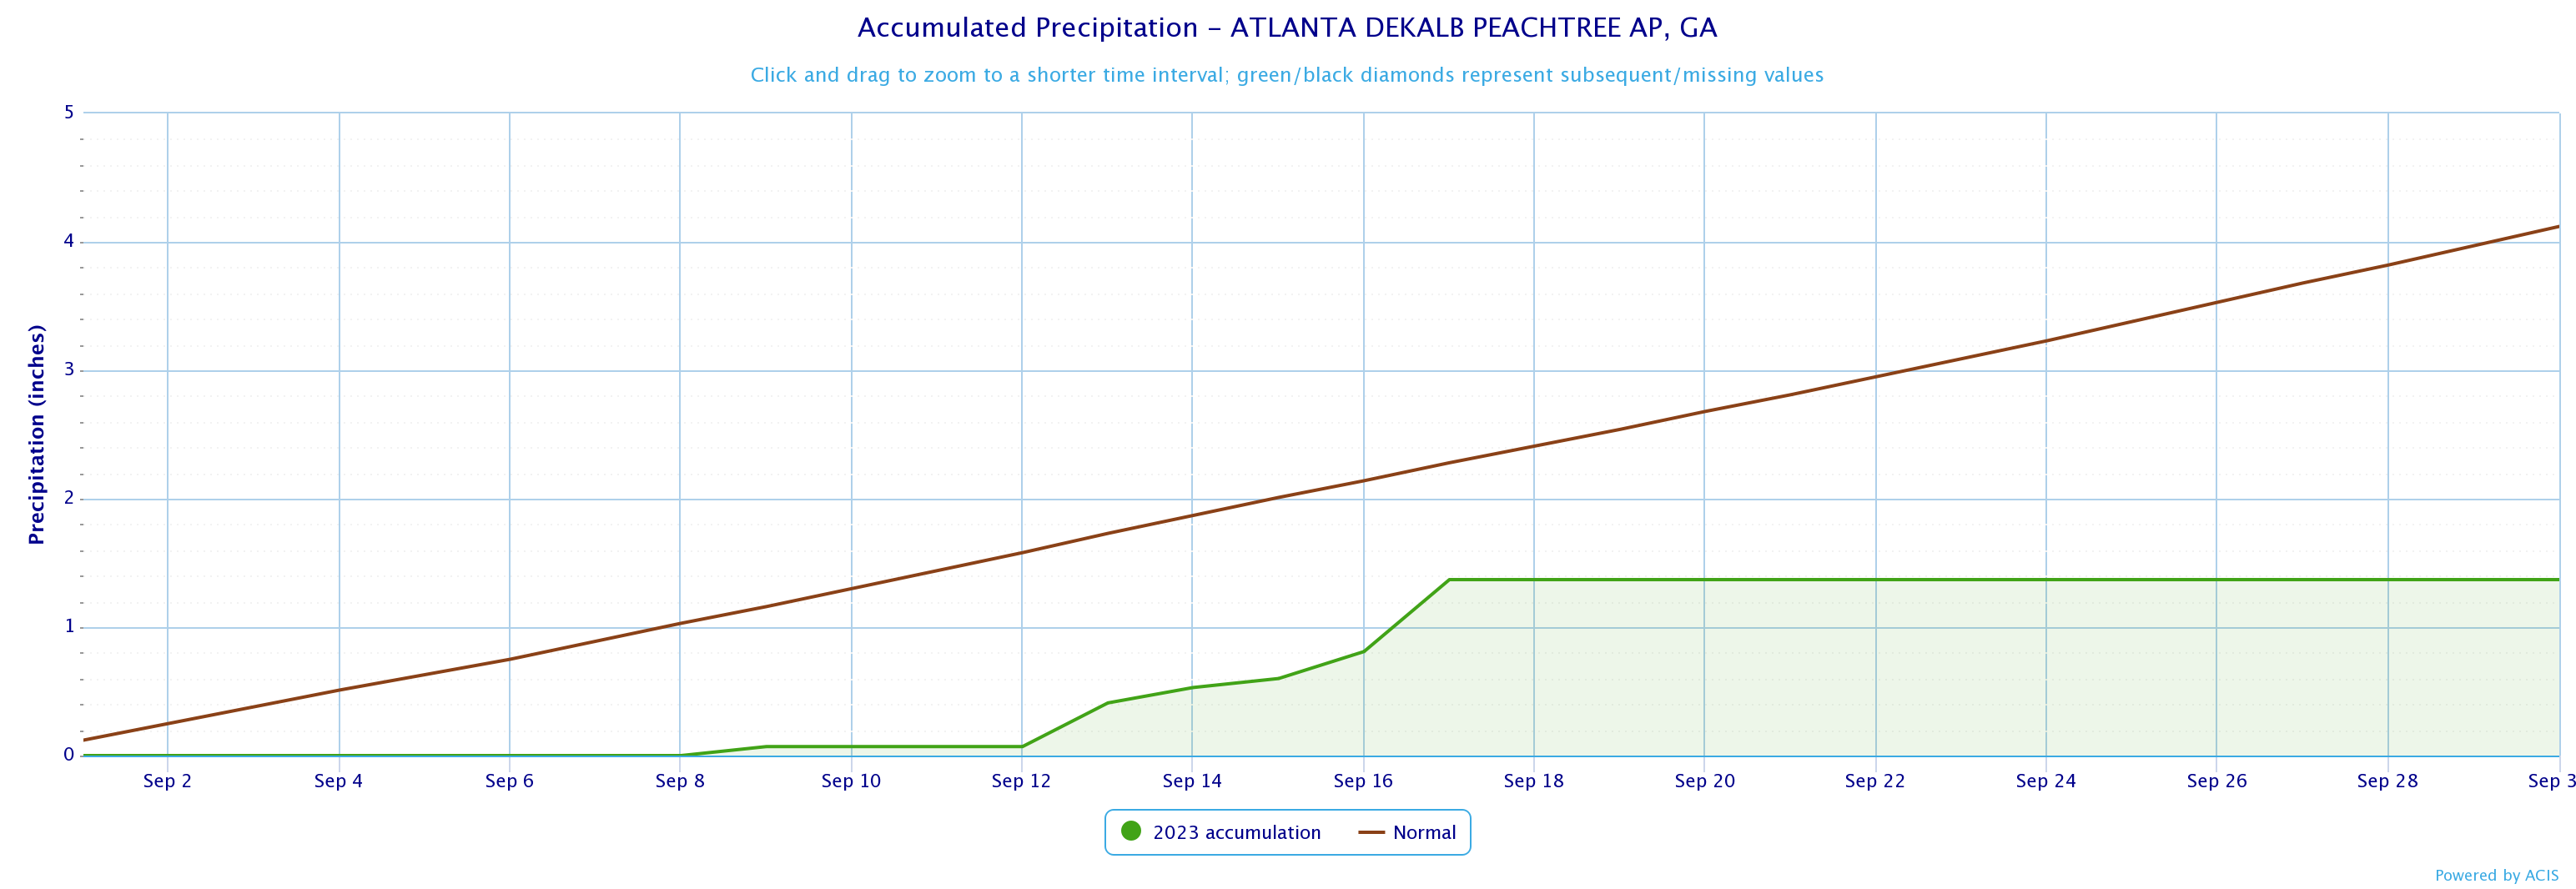
Dekalb Peachtree Arpt
|
1.37
|
4.12
|
2.75
|
|
Fulton County Arpt
|
2.69
|
3.36
|
-0.67
|
|
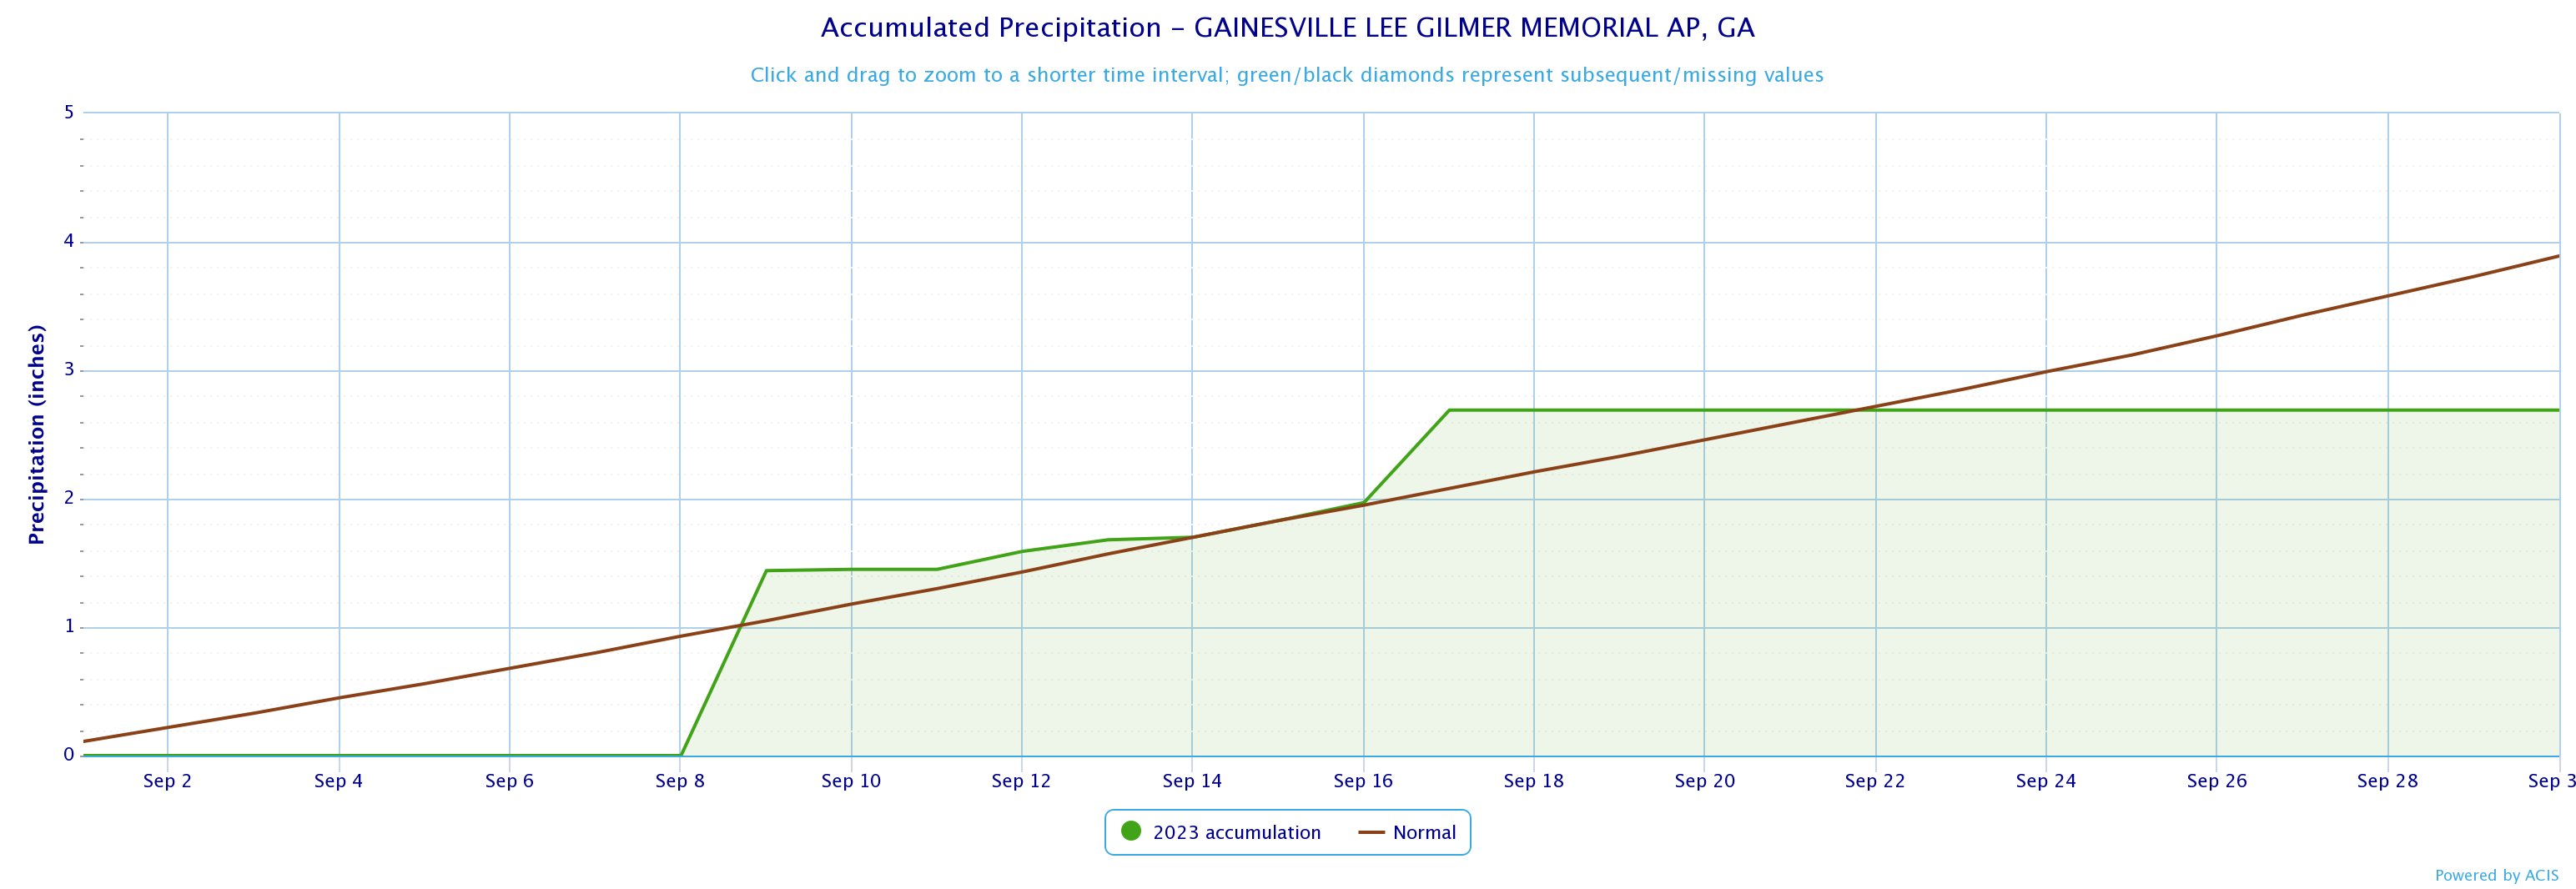
Gainesville
|
2.69
|
3.89
|
-1.20
|
|
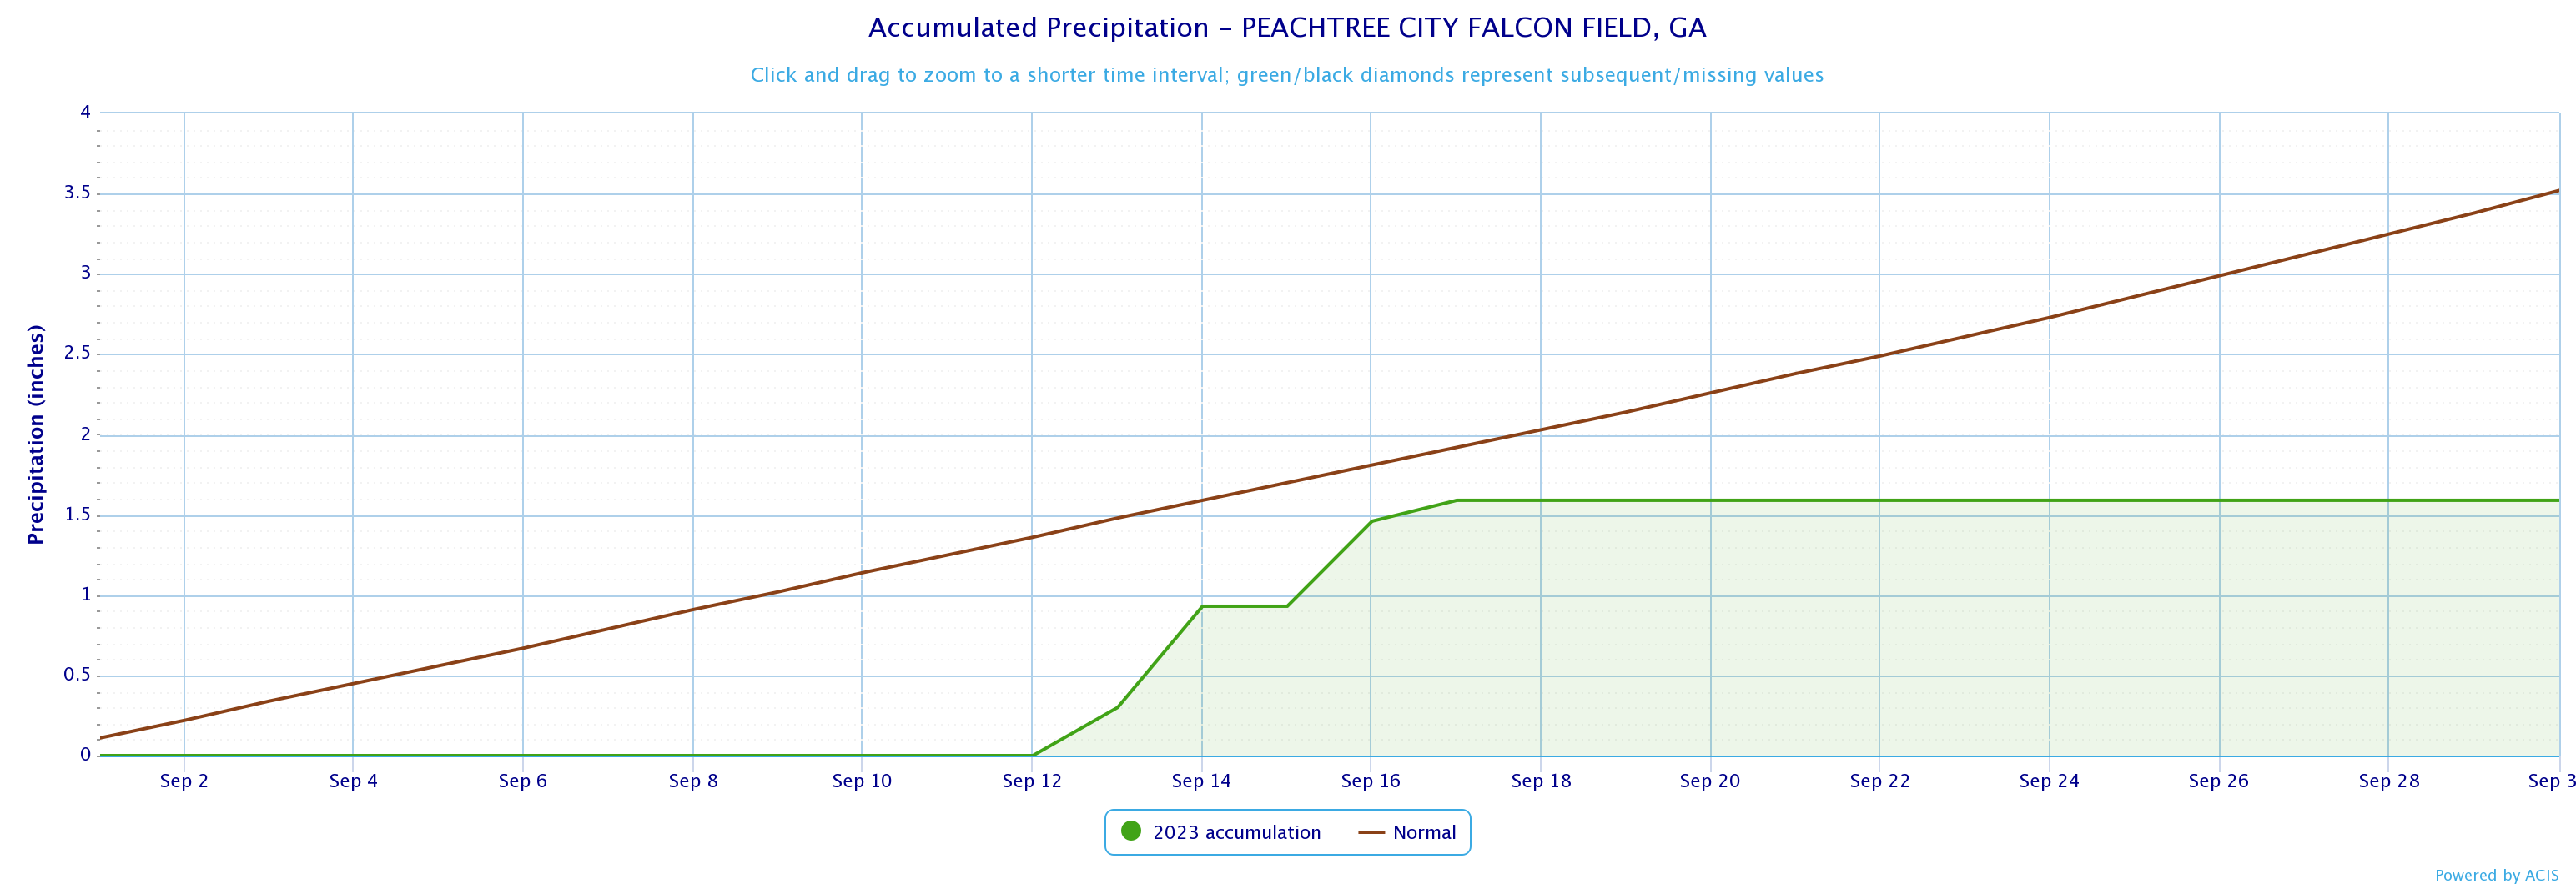
Peachtree City
|
1.59
|
3.52
|
-1.93
|
|
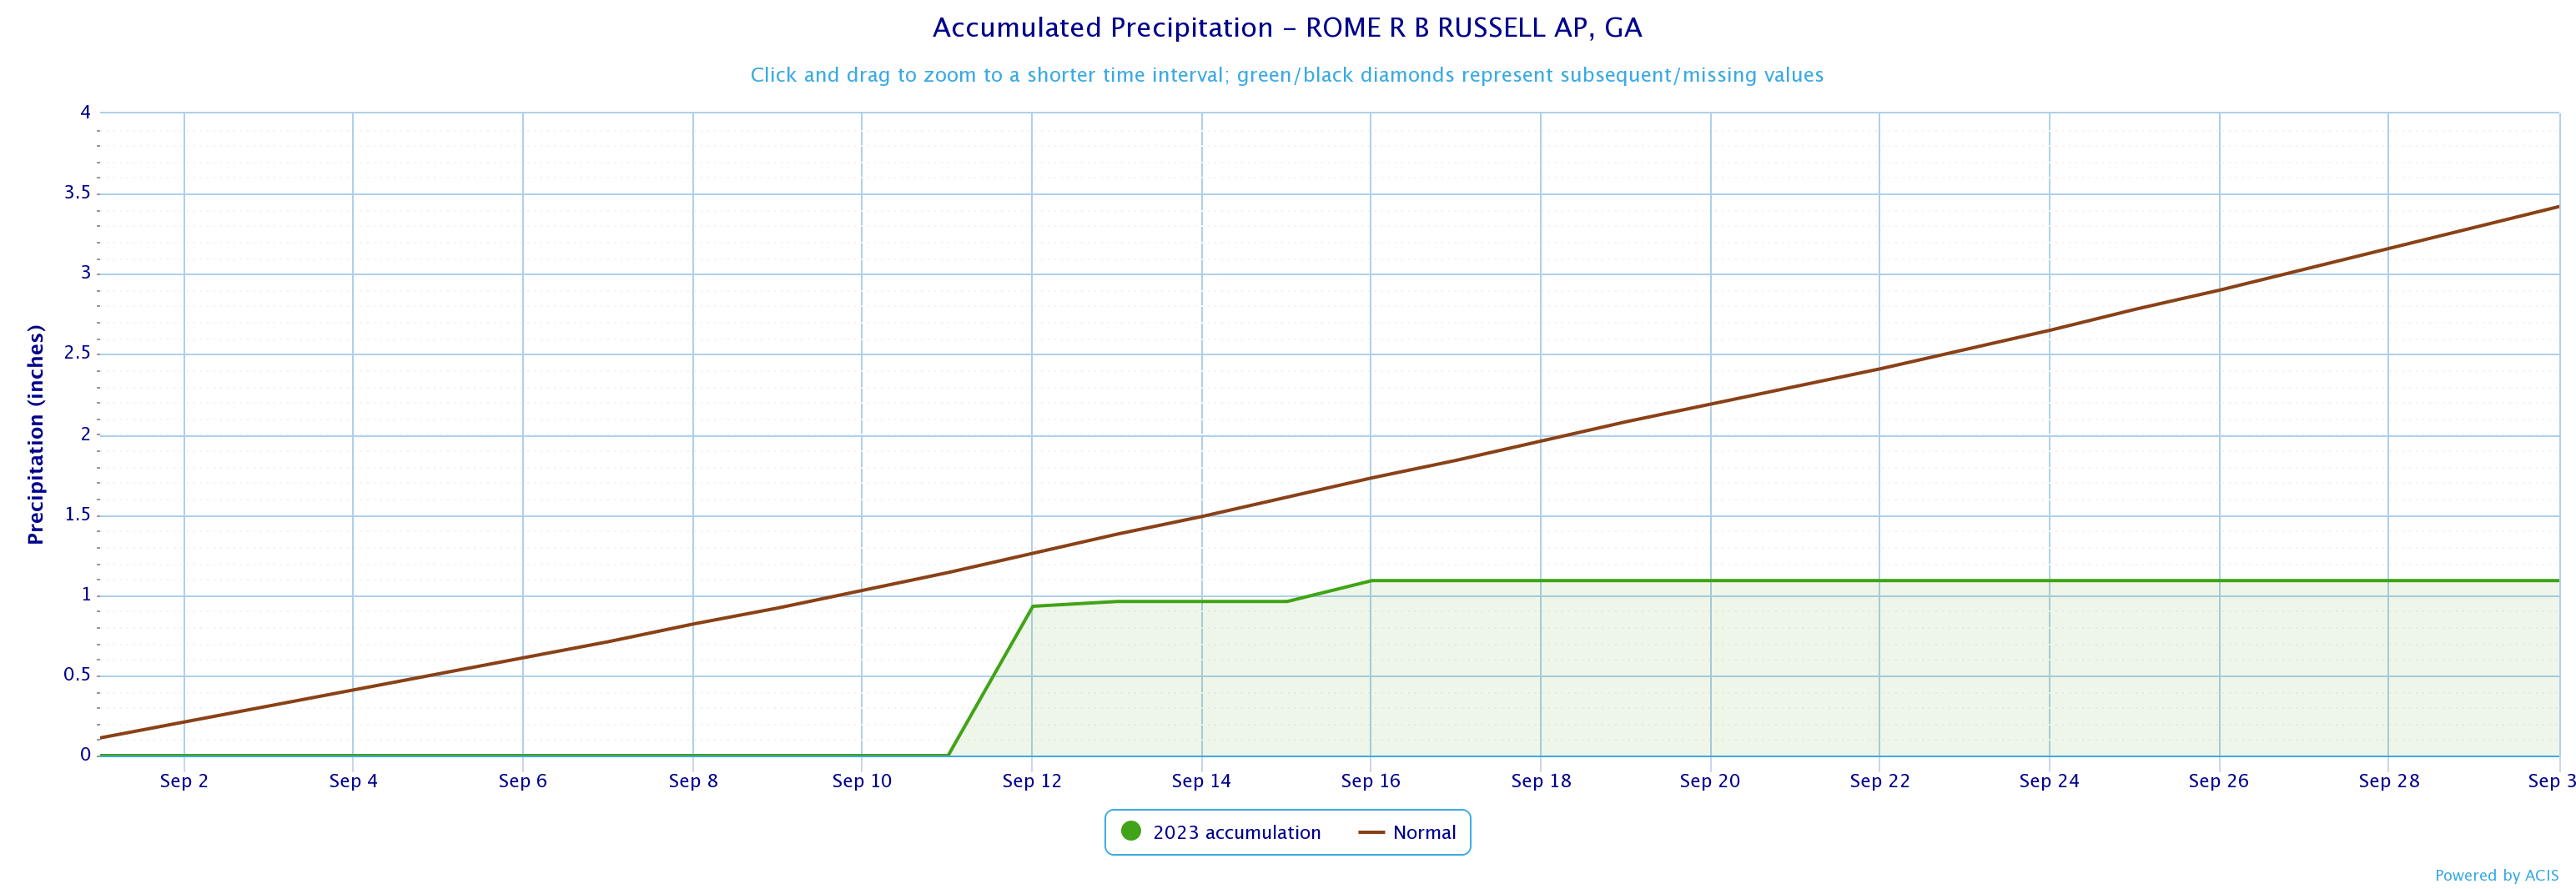
Rome
|
1.09
|
3.42
|
-2.33
|
|
Sep 2023 Precipitation Climate Statistics
|
||||
|
Climate Site |
Maximum Daily Precip (in inches) |
Max P Date |
||
|
Athens
|
0.16
|
9/16
|
||
|
Atlanta
|
0.98
|
9/16
|
||
|
Columbus
|
0.65
|
9/14
|
||
|
Macon
|
0.53
|
9/13
|
||
|
Dekalb Peachtree Arpt
|
0.77
|
9/16
|
||
|
Fulton Co Arpt
|
1.77
|
9/16
|
||
|
Gainesville
|
1.44
|
9/9
|
||
|
Peachtree City
|
0.66
|
9/16
|
||
|
Rome
|
0.96
|
9/12
|
||
Data prepared by NWS Peachtree City/Atlanta
| Temperature Maps | Precipitation Maps |
| Temperature Graphs | Precipitation Graphs |
|
September 2023 Climate Records
|
|
No Records were broken during the last month.
|
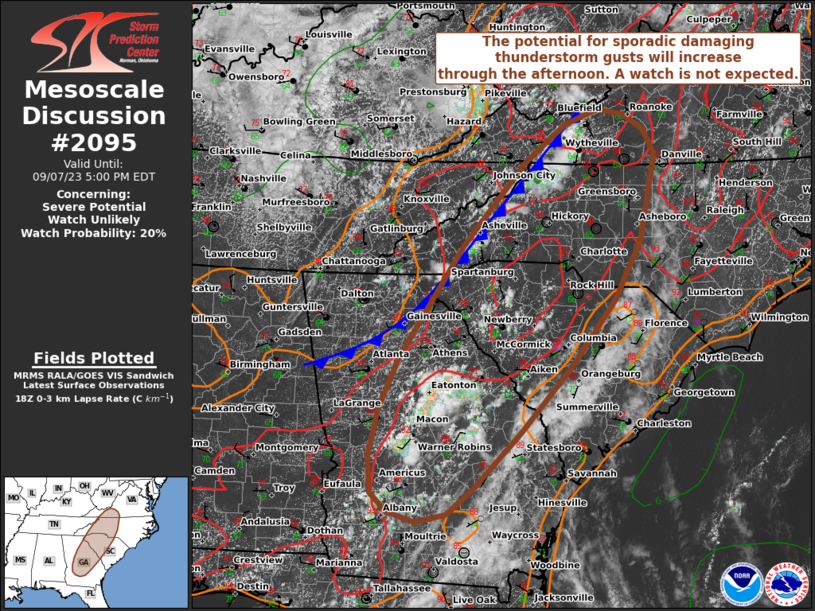
September 7th: A cold front pushed through central Georgia on the afternoon on the 7th. Dewpoints out ahead of the front had risen into the high 60s as warm moist air was pushed in from the SE. Surface based CAPE had risen to around 1500 J/KG south of a line from Athens to Columbus. A few discrete storms that formed before the line came together produced a number of quarter sized hail reports. As the line moved through, numerous reports of wind damage came in with winds exceeding 50kts near Macon.
 |
 |
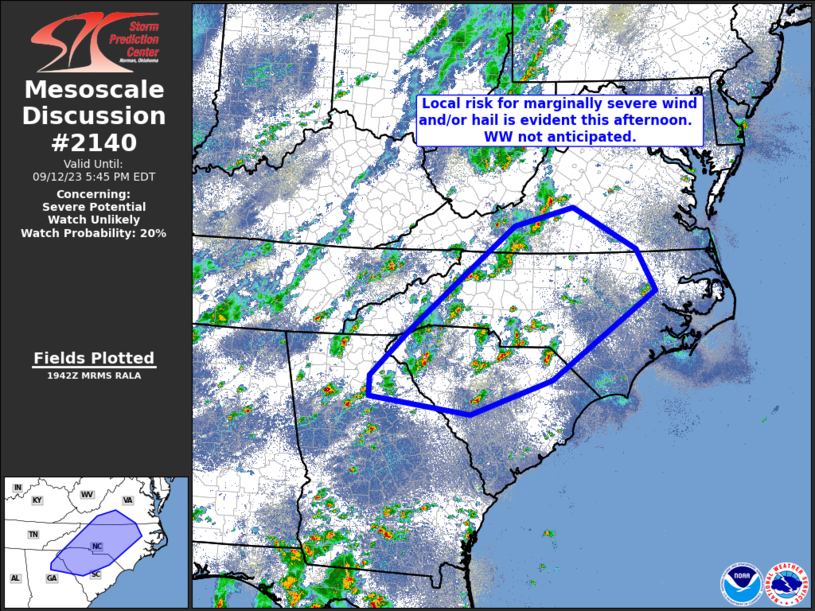
September 12th: Warm weather and general afternoon convection was supported by some marginal upper level shear that allowed for a number of pulse convective storms to organize enough to produce some small hail and a number of damaging wind reports generally in the eastern portion of the CWA. Instability was generally around 2,000 J/KG and dewpoint were in the mid to upper 60s.
 |
 |
Based on the Climate Prediction Center's outlook for October, Georgia has equal chances for above, below or near normal temperatures. For precipitation, all of north and central Georgia has a 40-50% chance of below normal precipitation.
 |
 |

