| Previous Month | Next Month |
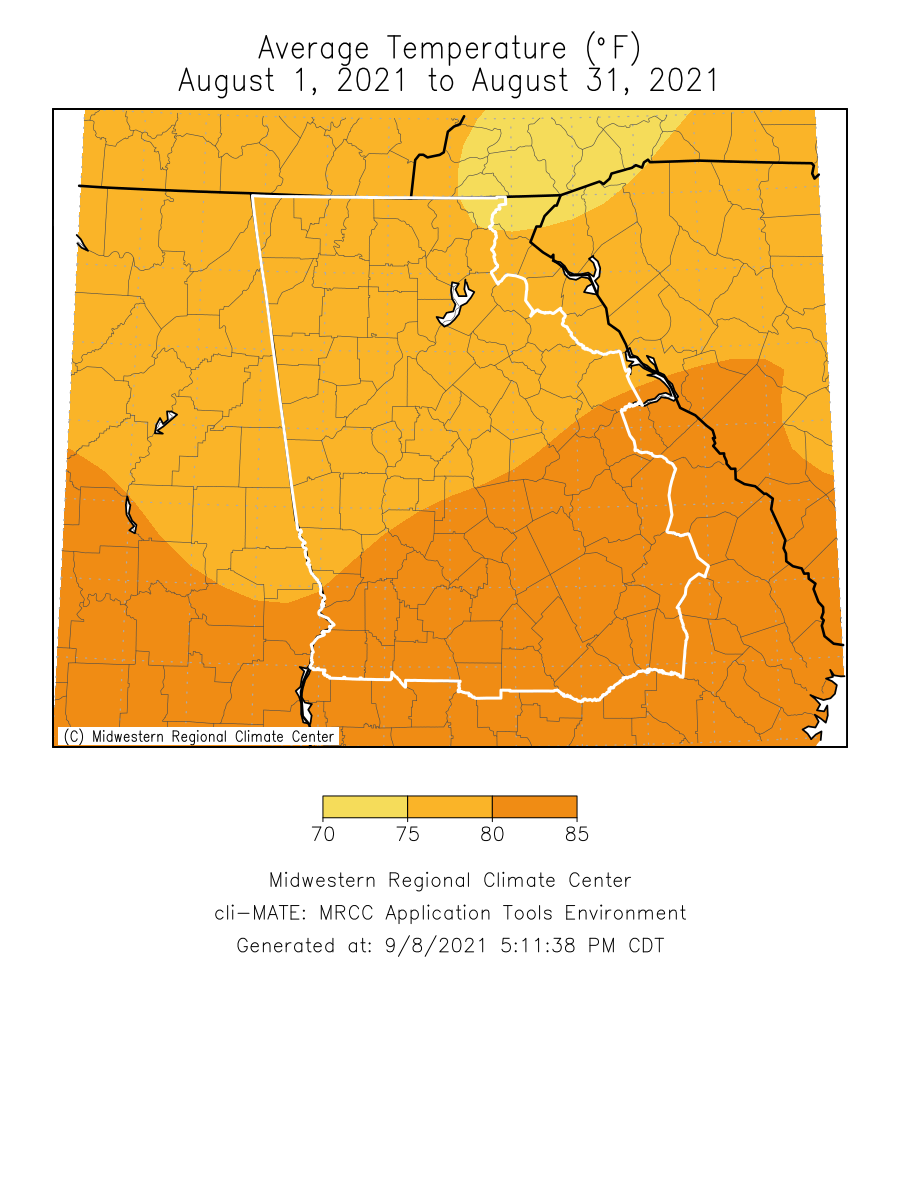
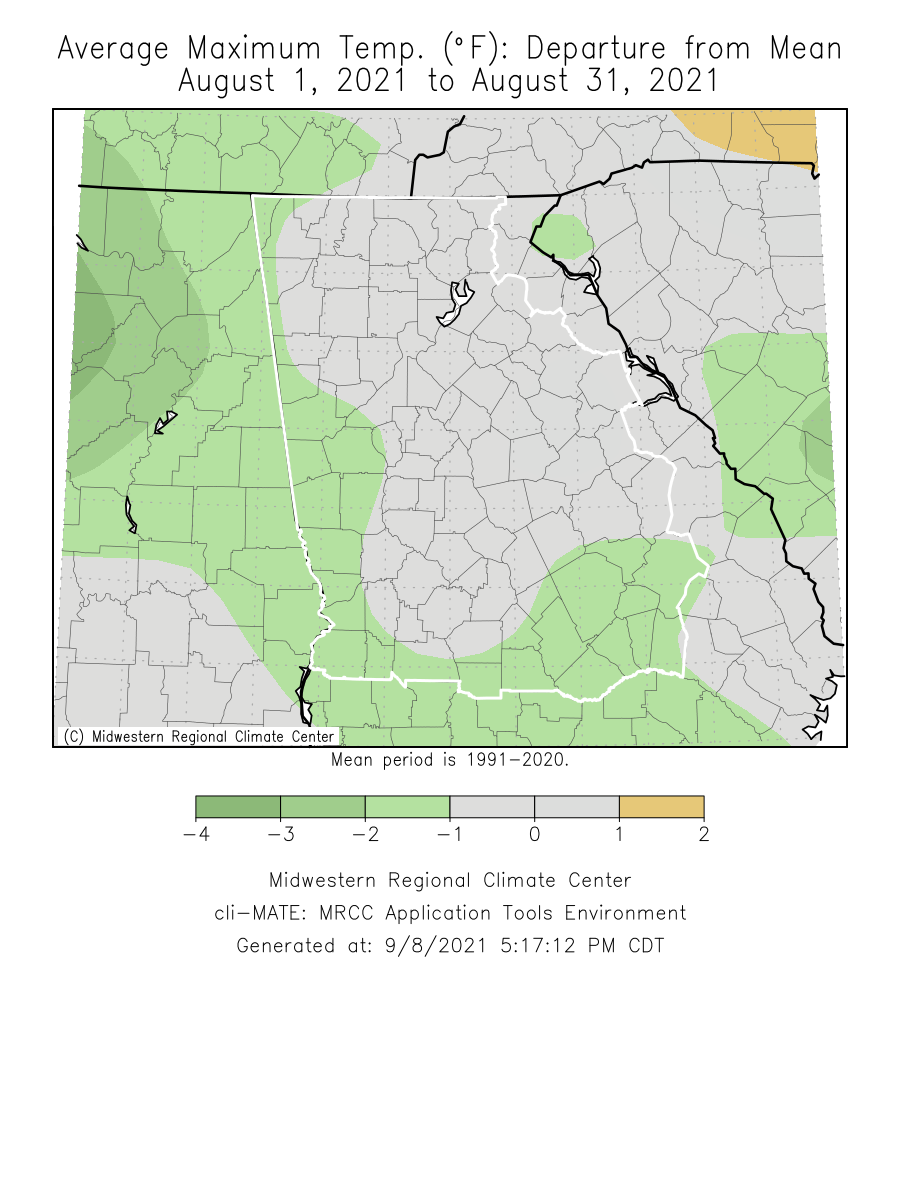
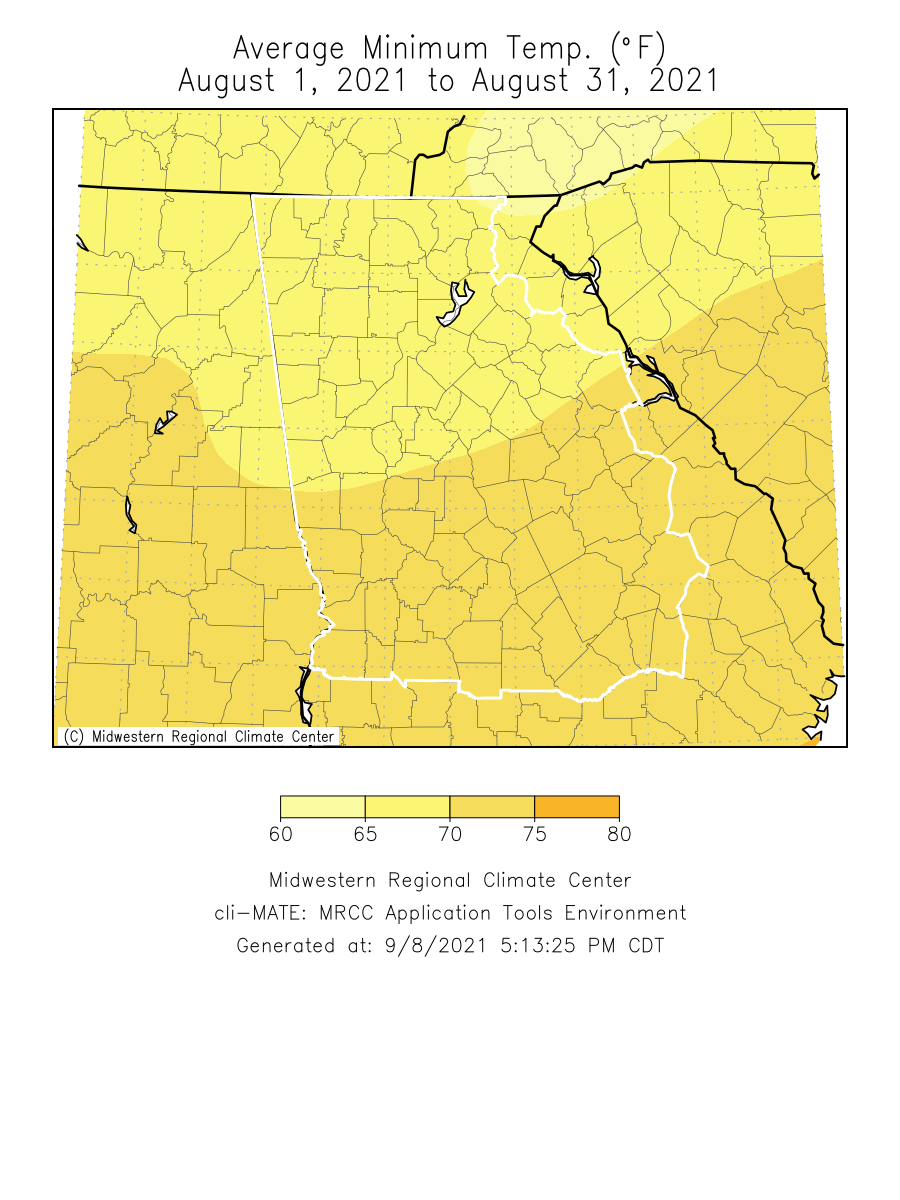
Temperatures through the month of September were around a degree below normal. Precipitation through the month of September was within 2 inches of normal.
Climate Site Maximum Temperature Max T Date *Indicates a daily record was set Climate Site Total Precipitation DFN (Departure Climate Site Maximum Daily Precip. (in inches) Max P Date *Indicates a daily record was set Data prepared by NWS Peachtree City/Atlanta September 1-2nd: The Remnants of Hurricane Ida Hurricane Ida made landfall as a power category 4 landfall that made landfall in Louisiana on August 29th. It made it's way through the southeast before accelerating toward the northeast breaking numerous rainfall records along the eastern seaboard. The impacts of Ida across our CWA was limited a few flash flood warnings, primarily across northern Georgia where 4-6 inches of rain fell in the northeast Georgia Mountains. September 1-8th: Metro Flash Flooding Training storms over the northern metro area caused some significant Flash Flooding overnight on September 7th and into the morning of September. Radar imagery estimates that as much as 4 to 5 inches may have fallen in the course of an hour. 24 hour rainfall totals around 9 inches fell just the east of Marrietta Georgia. Some significant damage occurred in the northern part of the metro area. Photos courtesy Fox5 Atlanta https://www.fox5atlanta.com/news/flash-floods-trap-residents-strand-drivers-in-cobb-county Based on the Climate Prediction Center's outlook for October, northwest Georgia has a 33% chance of above normal temperatures while the remainder of Georgia has a equal chances for above, below or near normal temperatures. For precipitation, all of north and central Georgia has a equal chances for above, below or near normal precipitation.
Overview
Climate Graphs
Records
Events
October Outlook
Below are the overview stats for September 2021 for our 10 climate sites.
September 2021 Climate Averages
Climate Site
September Temp (°F)
Average Temp
Departure from normal
74.5
73.9
0.6
73.9
74.9
-1.0
75.9
77.6
-1.7
75.1
76.2
-1.1
71.9
72.5
-0.6
72.2
72.9
-0.7
72.3
73.5
-1.2
71.8
72.4
-0.6
73.4
74.1
-0.7
73.3
73.8
-0.5
September 2021 Temperature Climate Statistics
Minimum Temperature
Min T Date
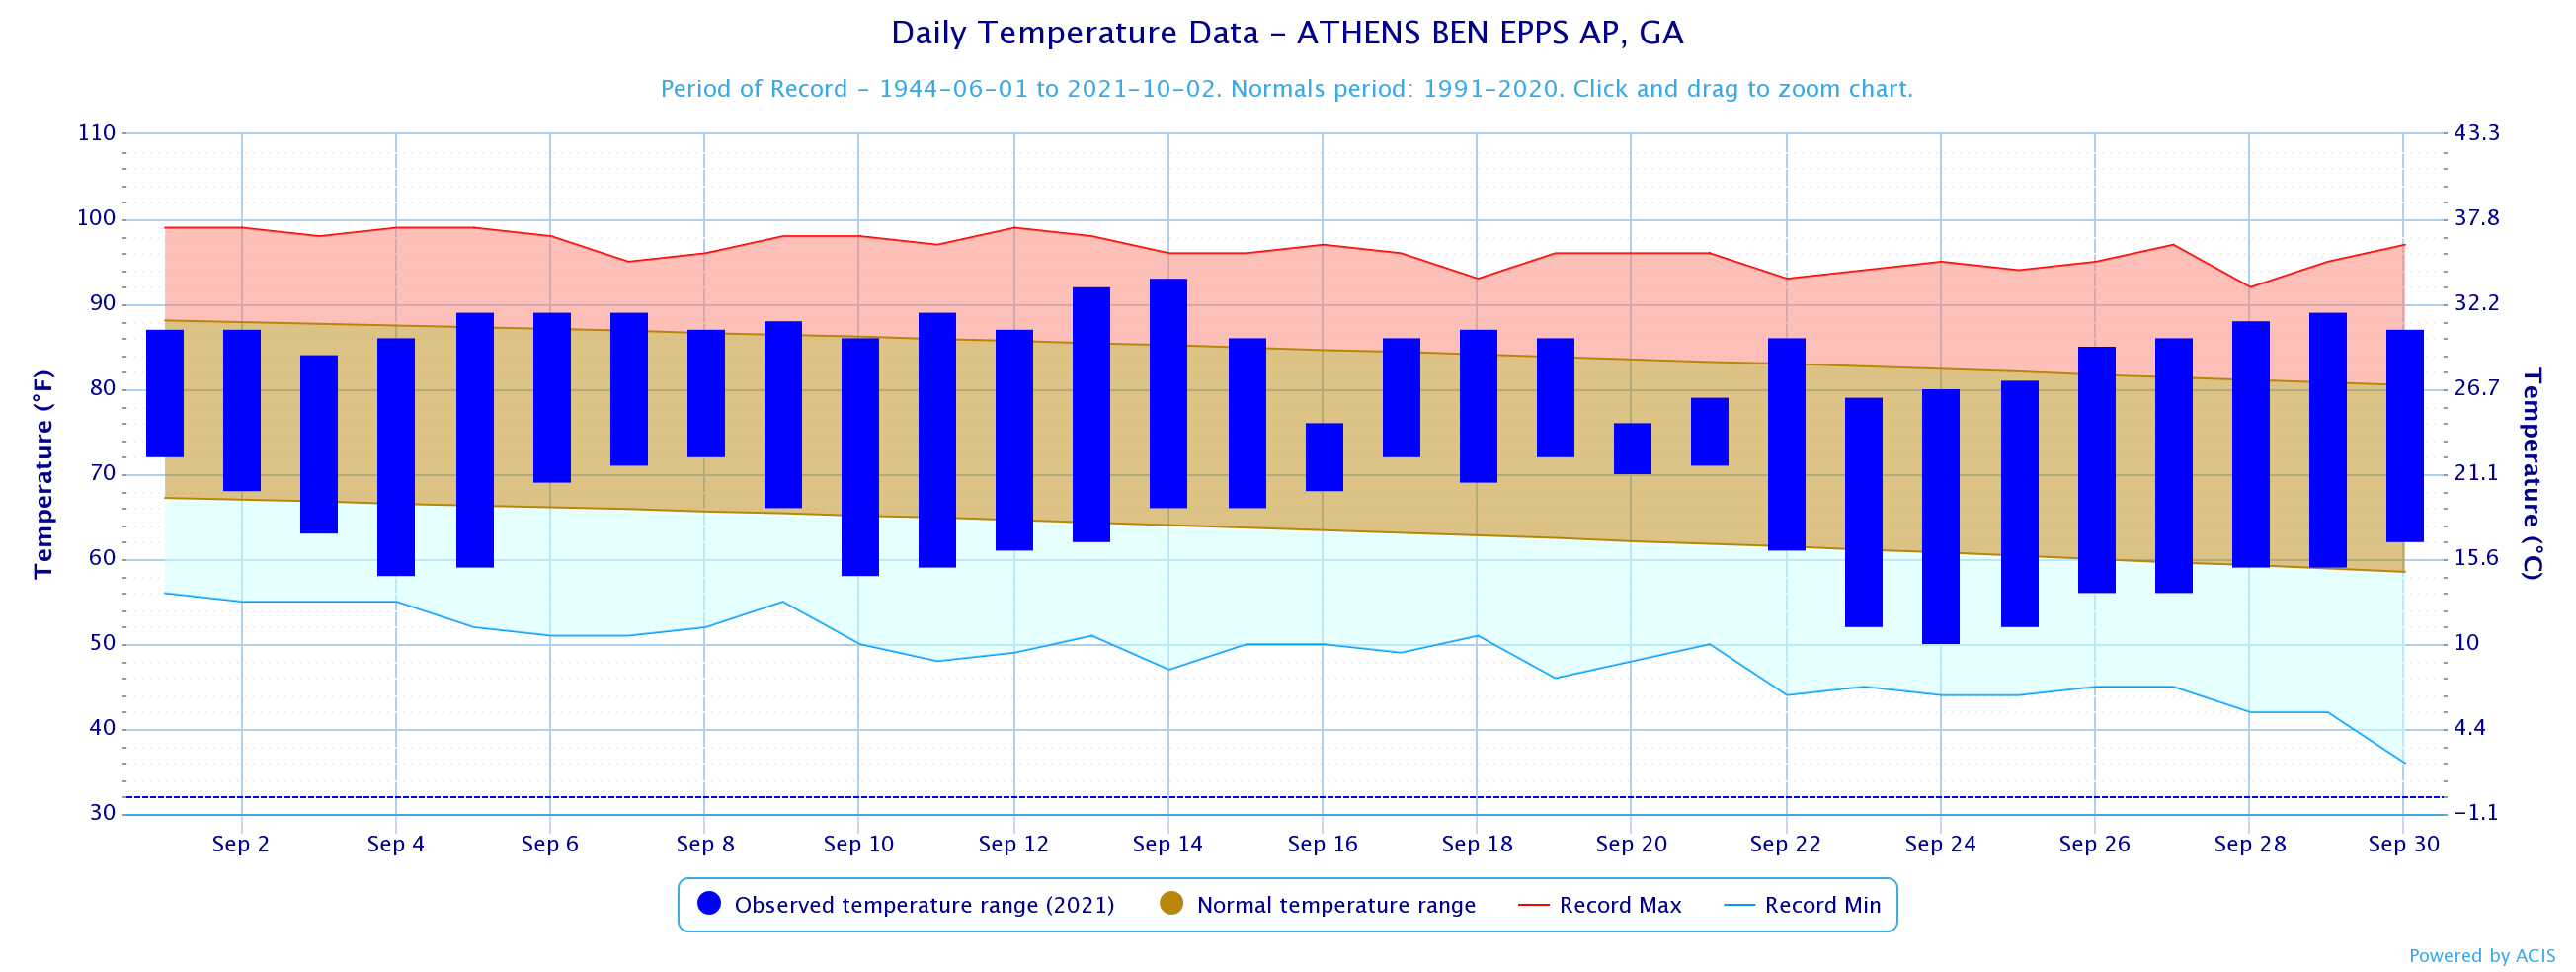
Athens
93
9/14
50
9/24
Atlanta
88
9/13
53
9/23, 24
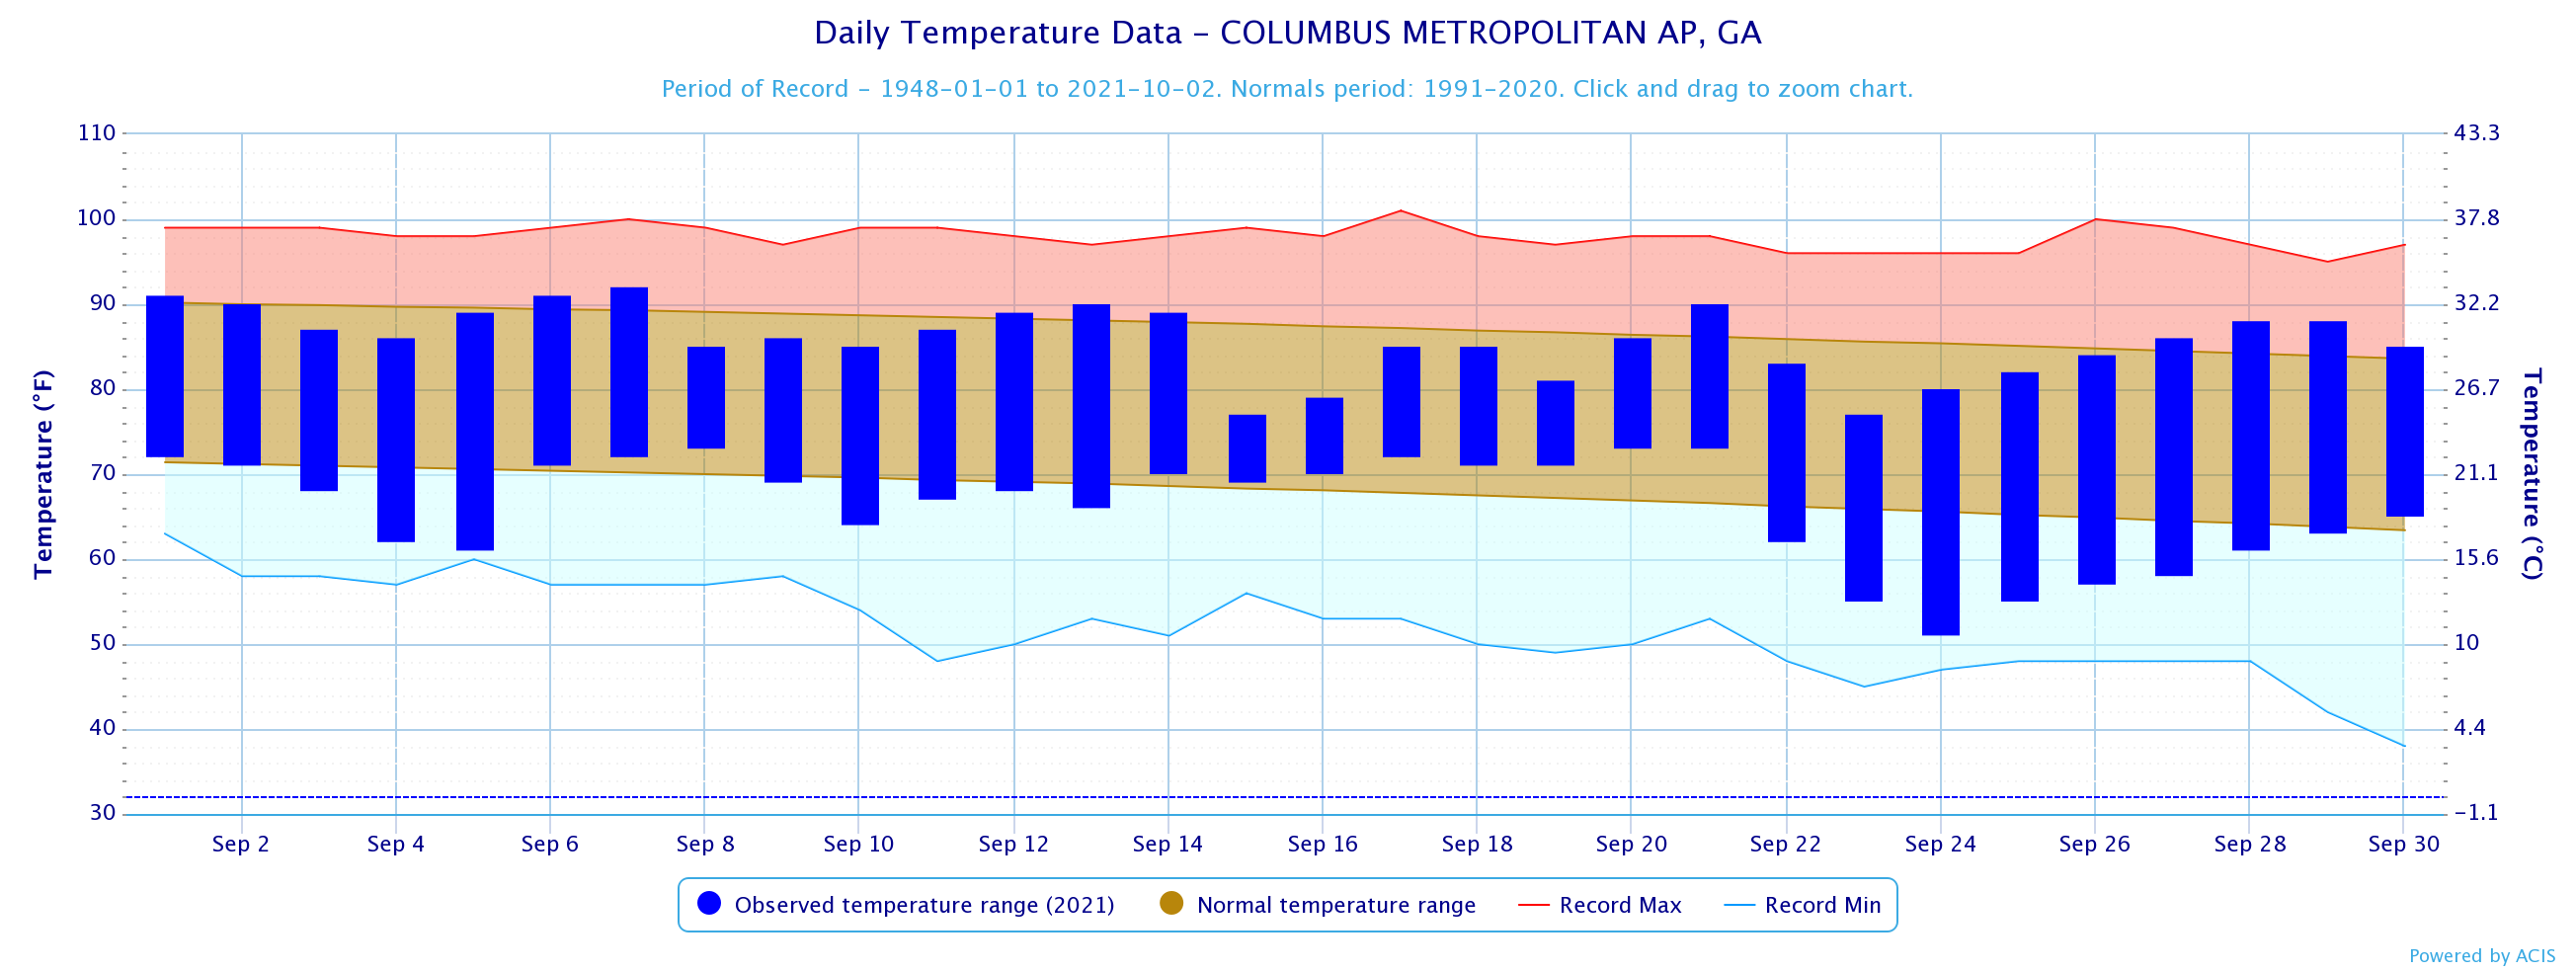
Columbus
92
9/7
51
9/24
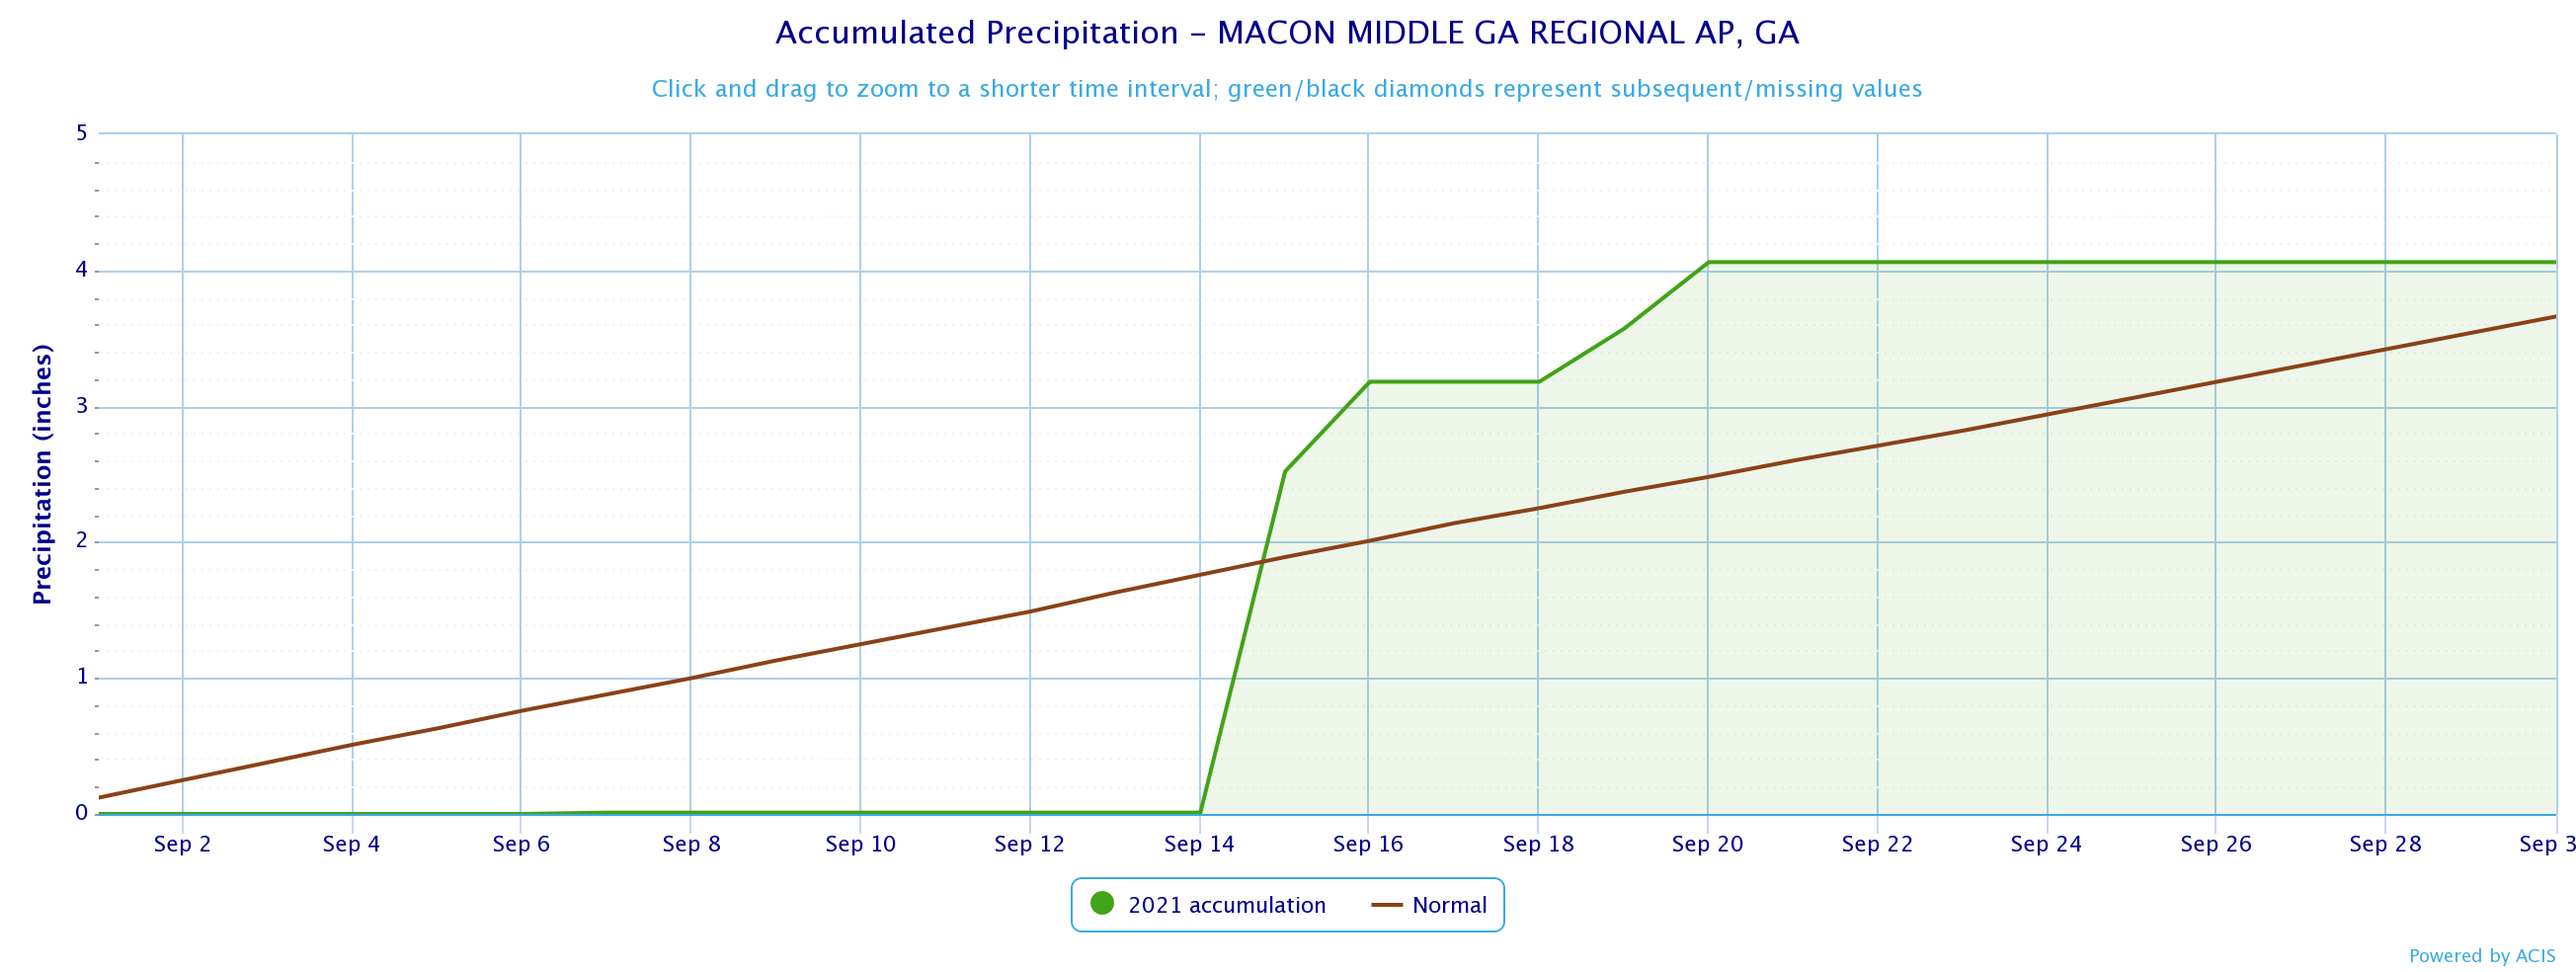
Macon
93
9/7
50
9/24
Cartersville
88
9/14
48
9/24
Dekalb Peachtree Arpt
90
9/14
49
9/24
Fulton Co Arpt
90
9/14
47
9/24
Gainesville
88
9/13
50
9/24
Peachtree City
90
9/13
48
9/24
Rome
91
9/14
49
9/24
September 2021 Precipitation Climate Statistics
Average Precipitation
From Normal)
2.02
3.89
-1.87
3.60
3.82
-0.22
6.18
3.34
2.84
4.86
4.46
0.40
3.22
3.63
-0.41
2.59
4.12
-1.53
3.10
3.36
-0.26
4.15
3.89
0.26
2.93
3.52
-0.59
6.29
3.42
2.87
September 2021 Precipitation Climate Statistics
Athens
0.84
9/20
Atlanta
1.20
9/19
Columbus
1.75
9/15
Macon
3.11
9/15
Cartersville
1.17
9/20
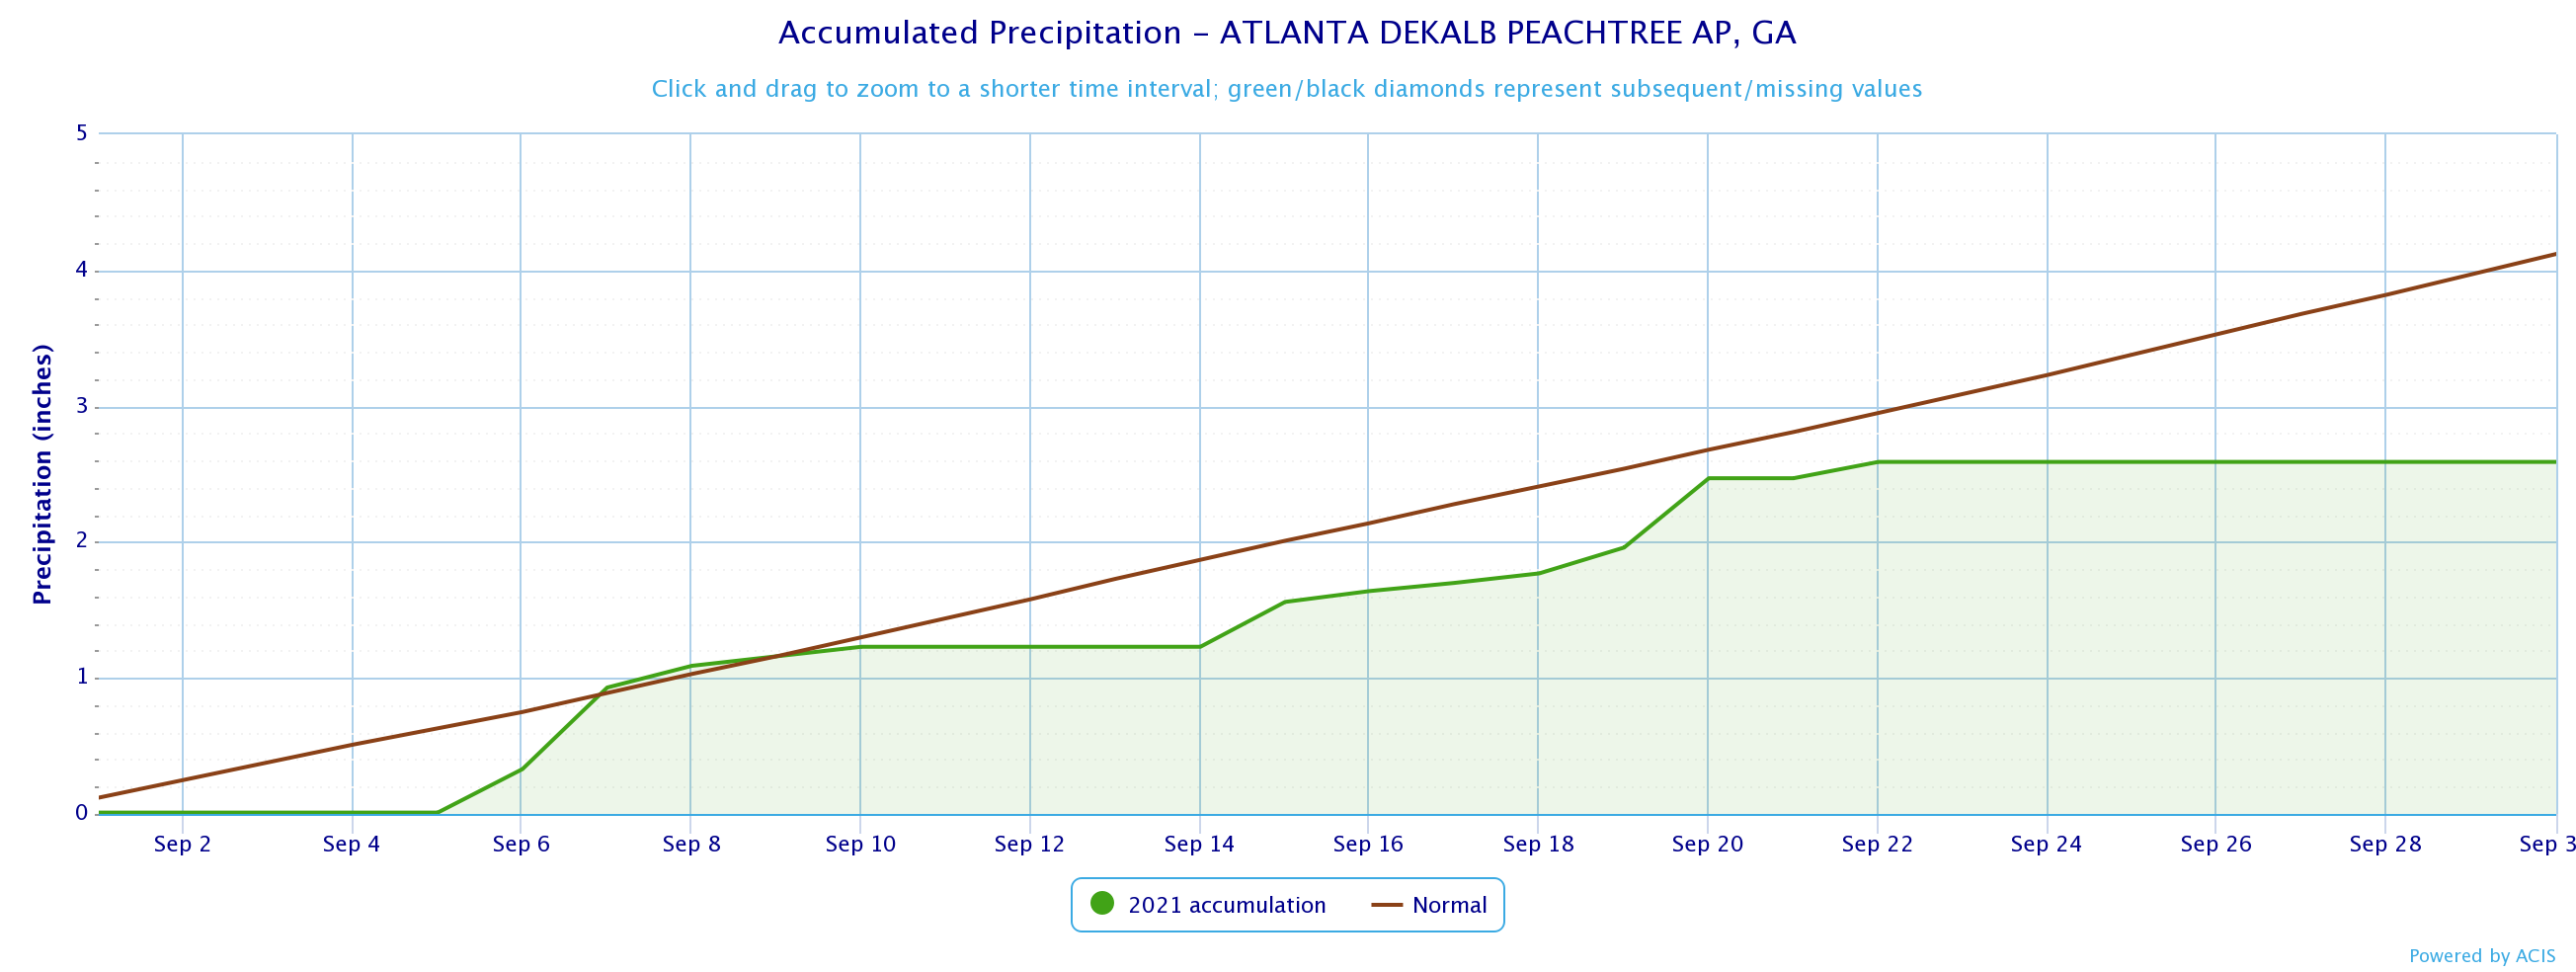
Dekalb Peachtree Arpt
0.76
9/16
Fulton Co Arpt
1.27
9/20
Gainesville
1.97
9/20
Peachtree City
1.02
9/7
Rome
2.35
9/19
Click the links below to explore the temperature and precipitation data across north and central Georgia for the month of September.
Temperature Maps
Precipitation Maps
Temperature Graphs
Precipitation Graphs


Temperature and precipitation records at our 4 main climate sites are located below.
September 2021 Climate Records
Date
Type
Location
Record
9/4
Daily Rainfall
Atlanta
A minimum temperature of 56 degrees was reached. This breaks the previous record of 58 degrees, last set in 1955.
9/16
Highest Min Temp
Macon
2.51 Inches of rain fell over 24 hours. This breaks the old record of 1.71 inches set in 1955.
Larger events that occurred across north and central Georgia this past September can be found here.
Satellite Imagery
Rainfall Totals


Rainfall Totals
Flooding Photos

.jpg)
.png)
The October climate outlook is below.
October Outlook