| Previous Month | Next Month |
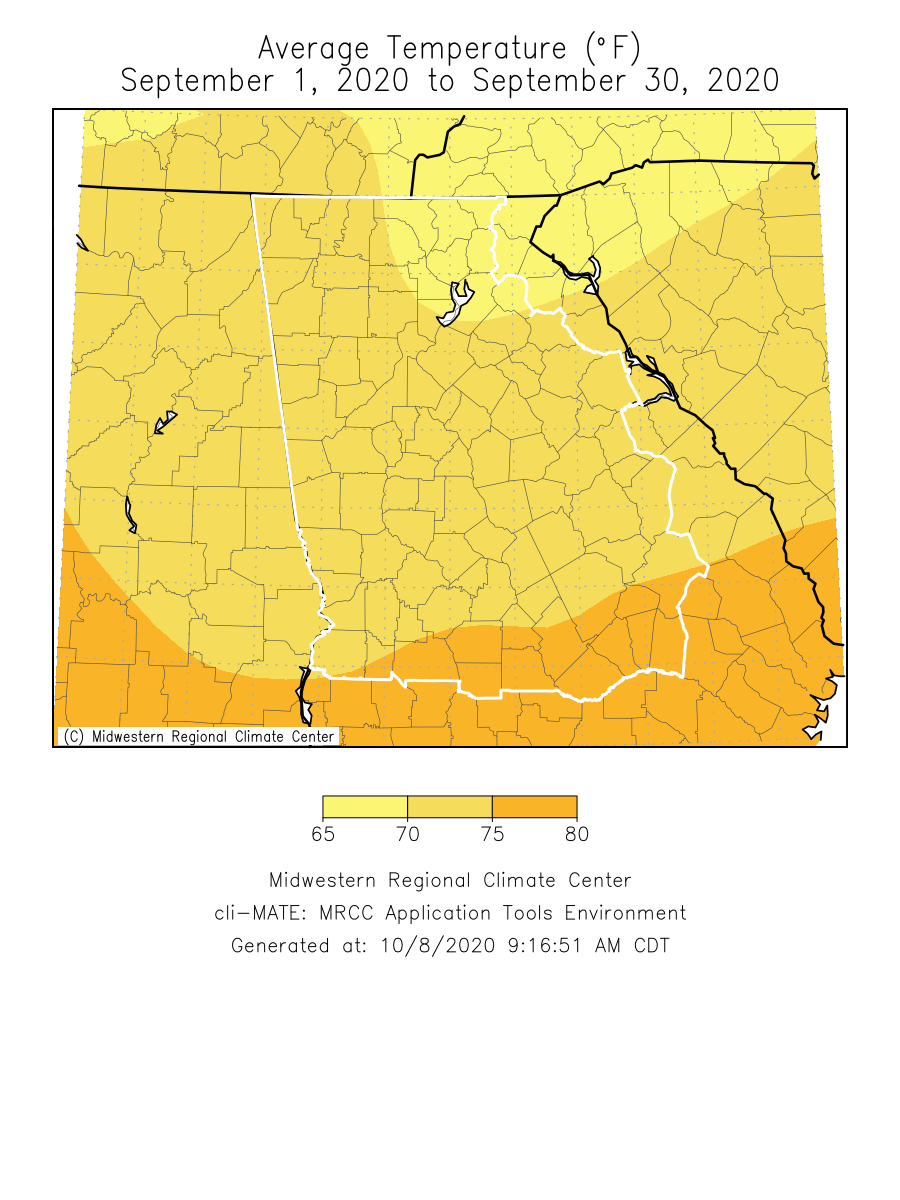
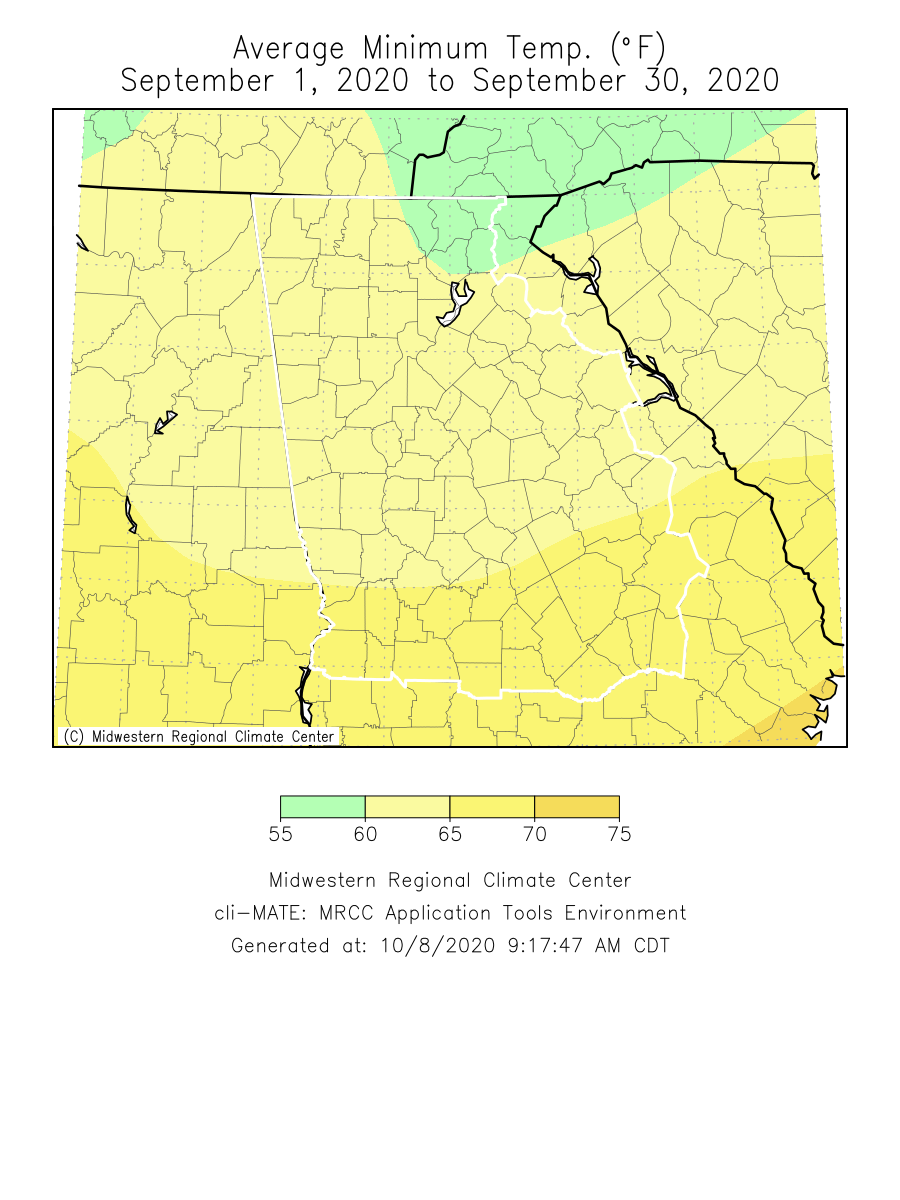
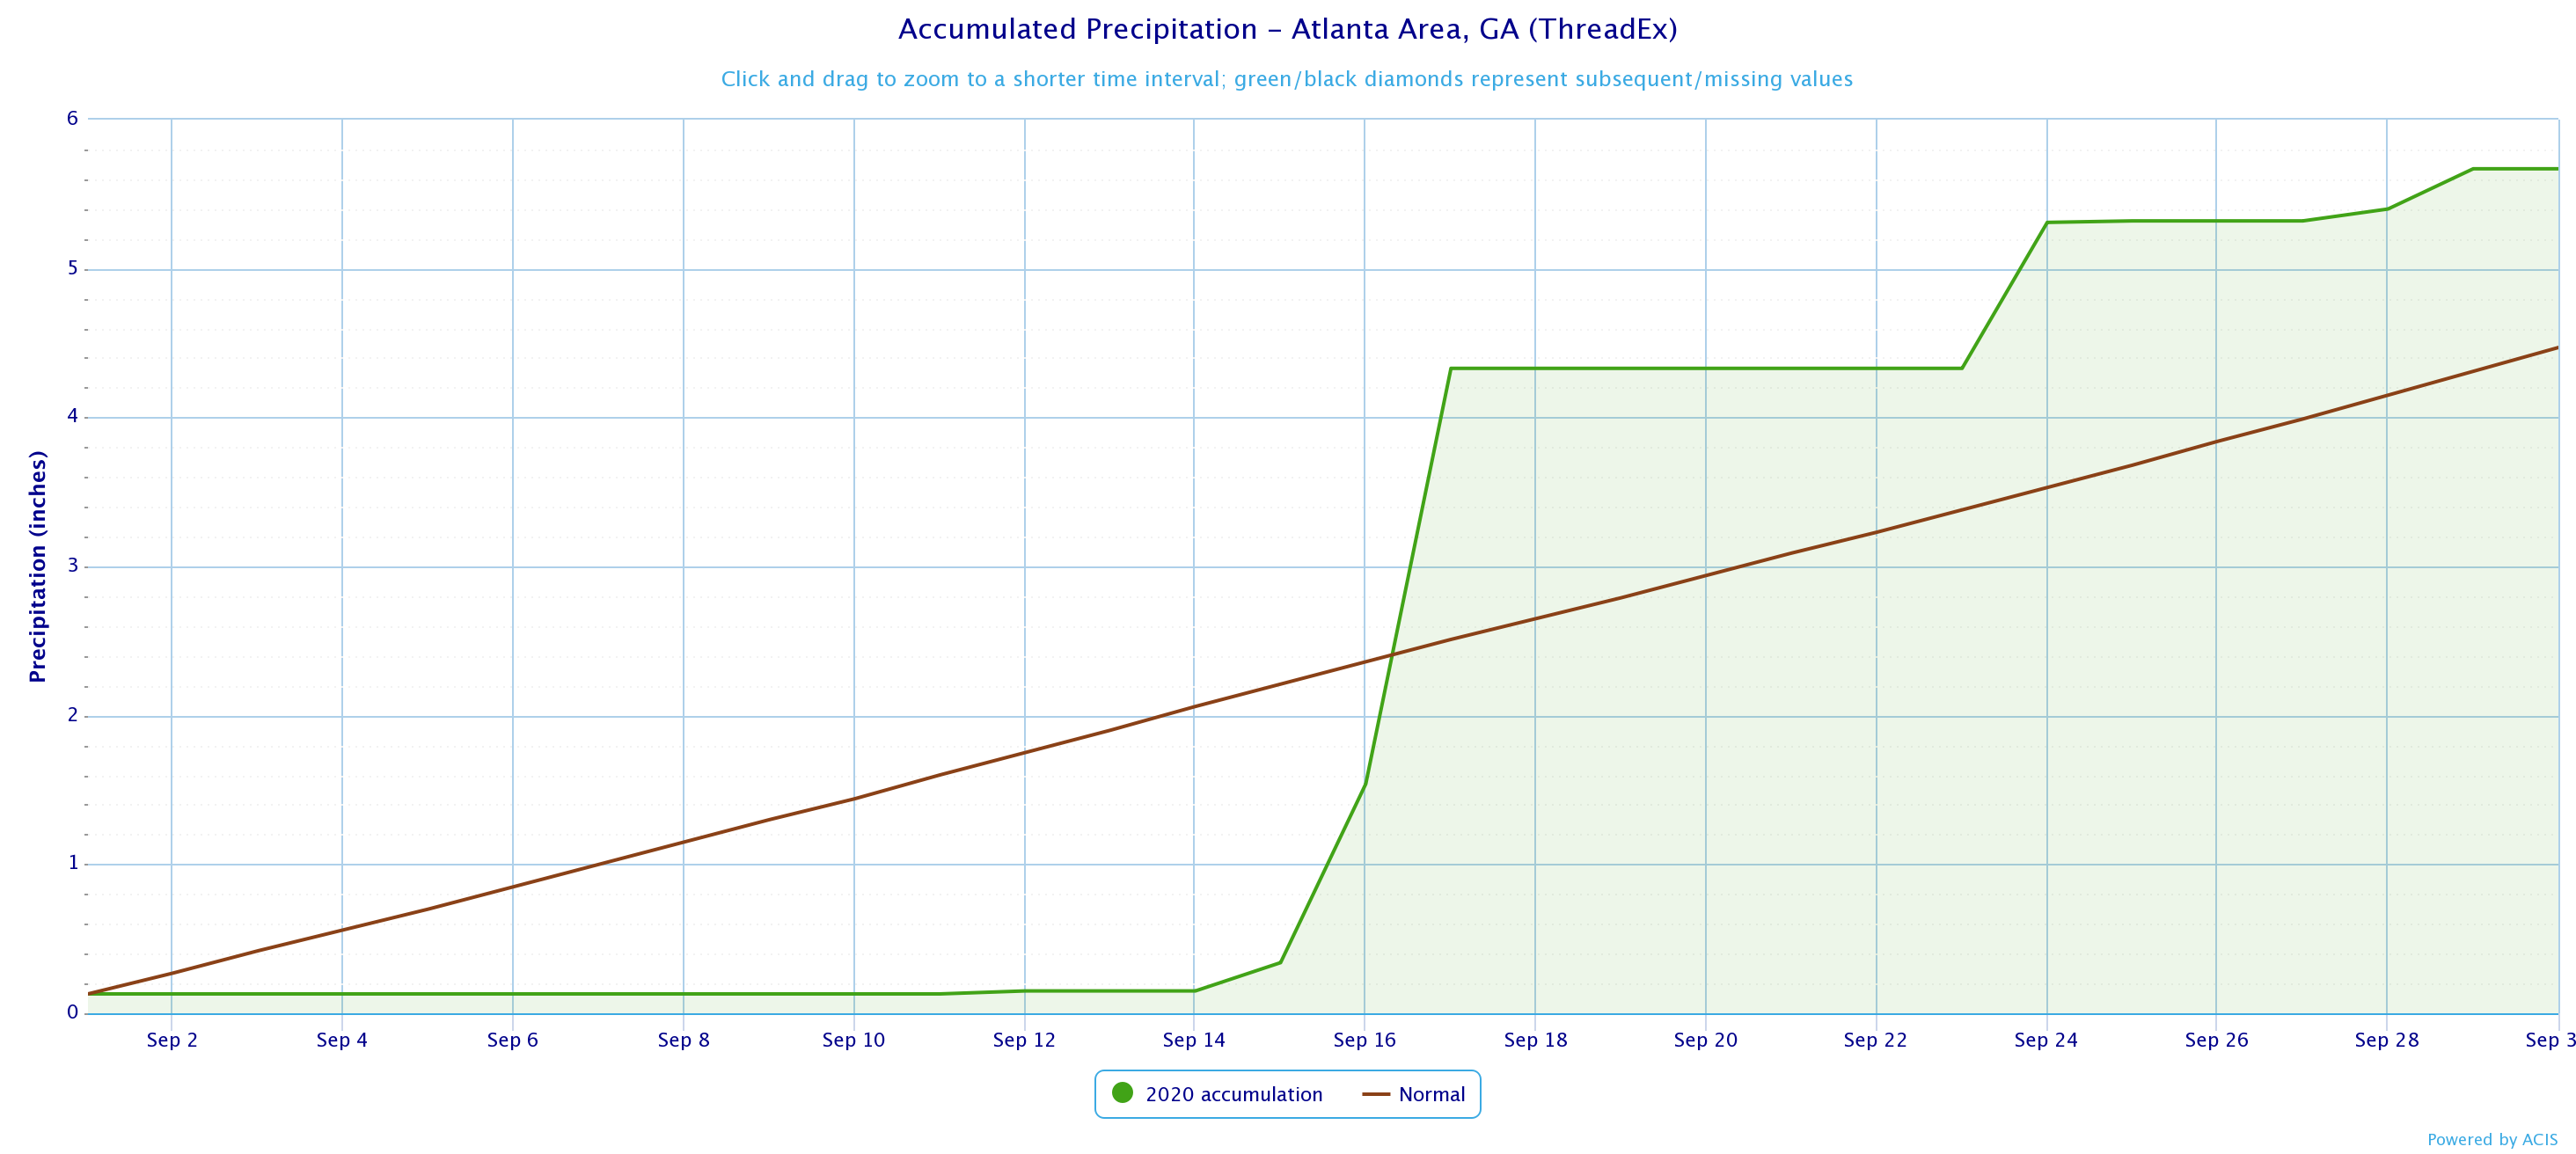
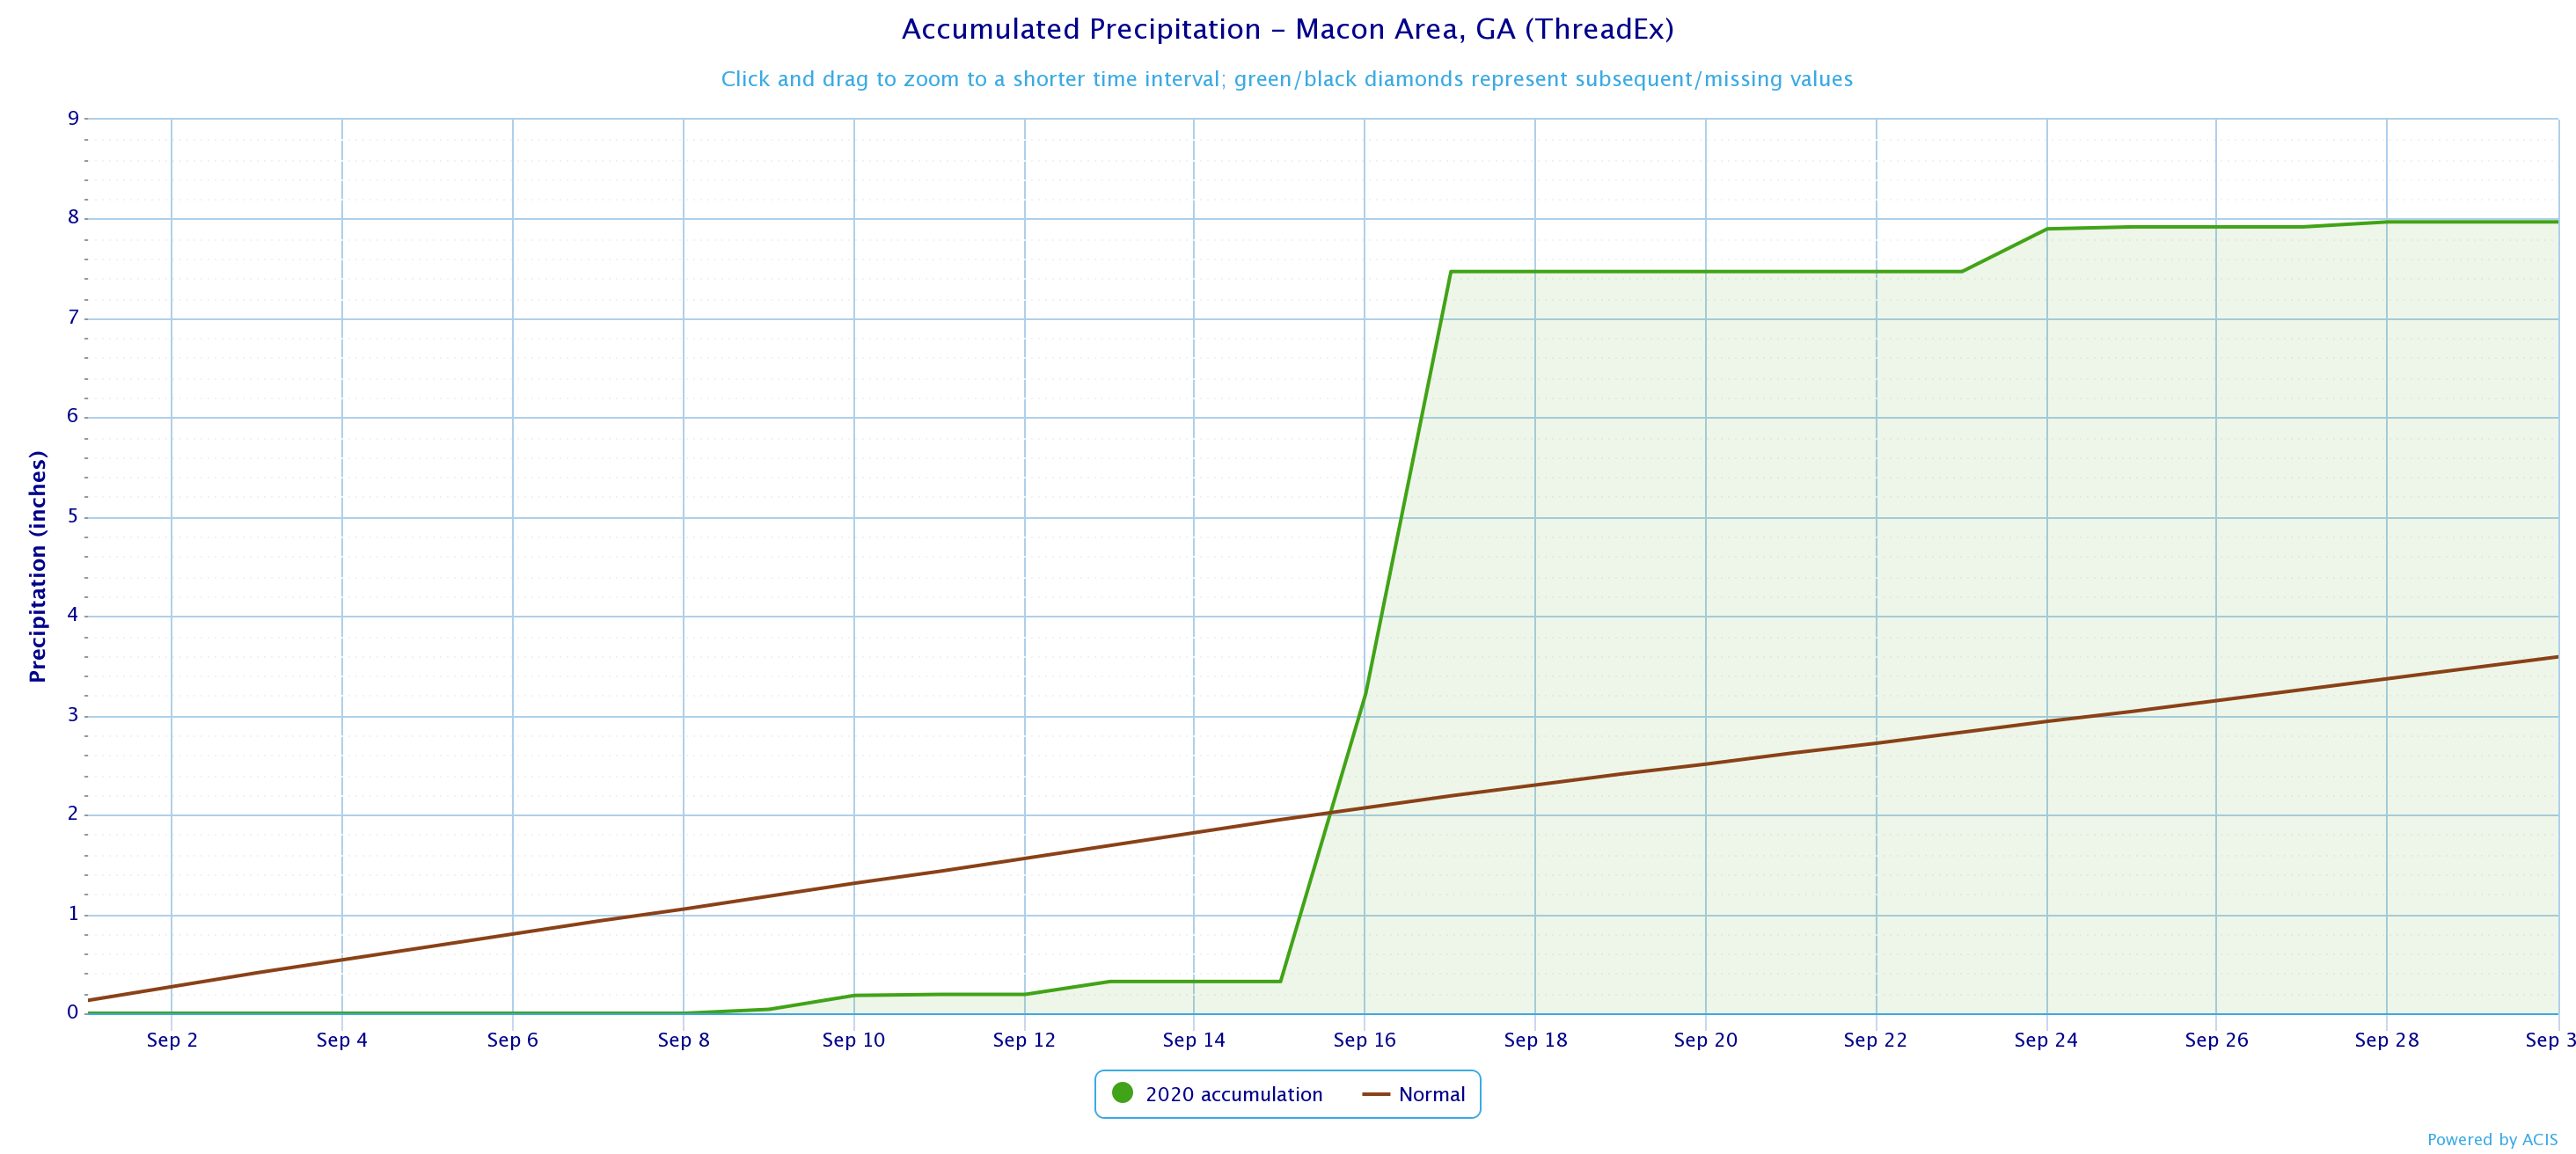
Temperatures through the month of September were just around seasonal norms. Precipitation through the month of September was around 2 to 4 inches above normal.
|
September 2020 Temperature Climate Statistics
|
|||
| Climate Site | Average Temperature |
Normal Temperature
|
DFN (Departure
From Normal)
|
|
73.8
|
73.3
|
+0.5
|
|
|
73.8
|
73.5
|
+0.3
|
|
|
76.8
|
76.6
|
+0.2
|
|
|
75.2
|
75.0
|
+0.2
|
|
|
73.3
|
71.3
|
+2.0
|
|
|
72.2
|
72.9
|
-0.7
|
|
|
72.7
|
72.8
|
-0.1
|
|
|
71.2
|
71.7
|
-0.5
|
|
|
72.4
|
72.1
|
+0.3
|
|
|
73.6
|
72.0
|
+1.6
|
|
|
September 2020 Temperature Climate Statistics
|
||||
| Climate Site | Maximum Temperature | Max T Date |
Minimum Temperature
|
Min T Date
|
|
Athens
|
94
|
9/1
|
49
|
9/22
|
|
Atlanta
|
92
|
9/4
|
50
|
9/30
|
|
Columbus
|
98
|
9/4
|
50
|
9/30
|
|
Macon
|
97
|
9/4
|
48
|
9/30
|
|
Cartersville
|
93
|
9/3, 9/4, 9/11
|
47
|
9/30
|
|
Dekalb Peachtree Arpt
|
92
|
9/3, 9/4
|
47
|
9/30
|
|
Fulton Co Arpt
|
92
|
9/3
|
49
|
9/30
|
|
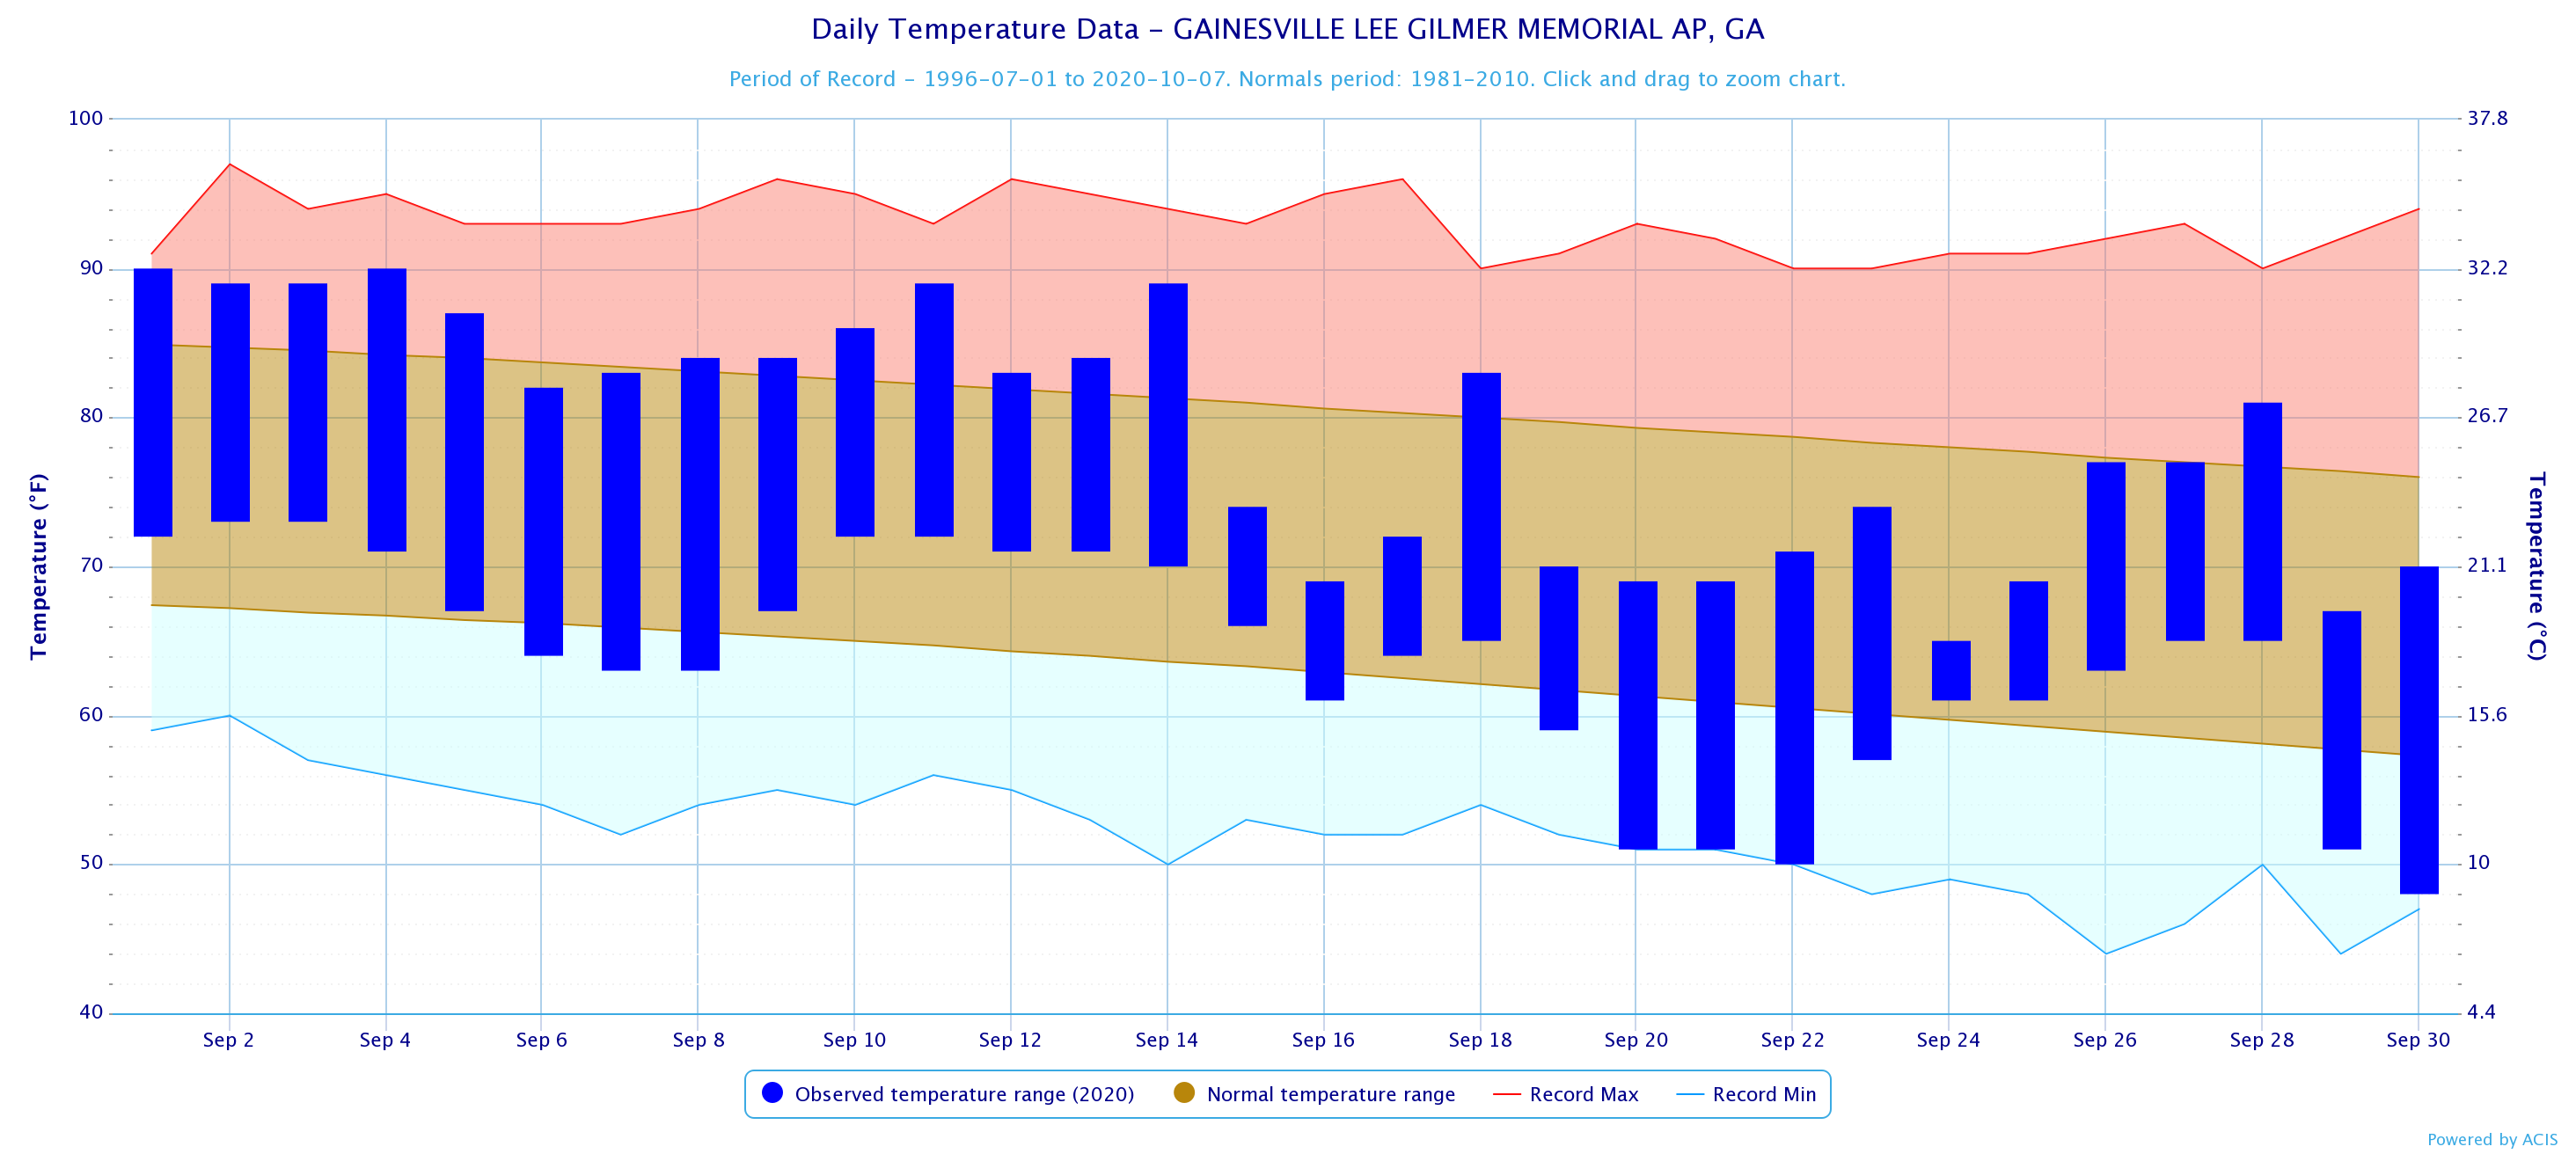
Gainesville
|
90
|
9/1, 9/4
|
48
|
9/30
|
|
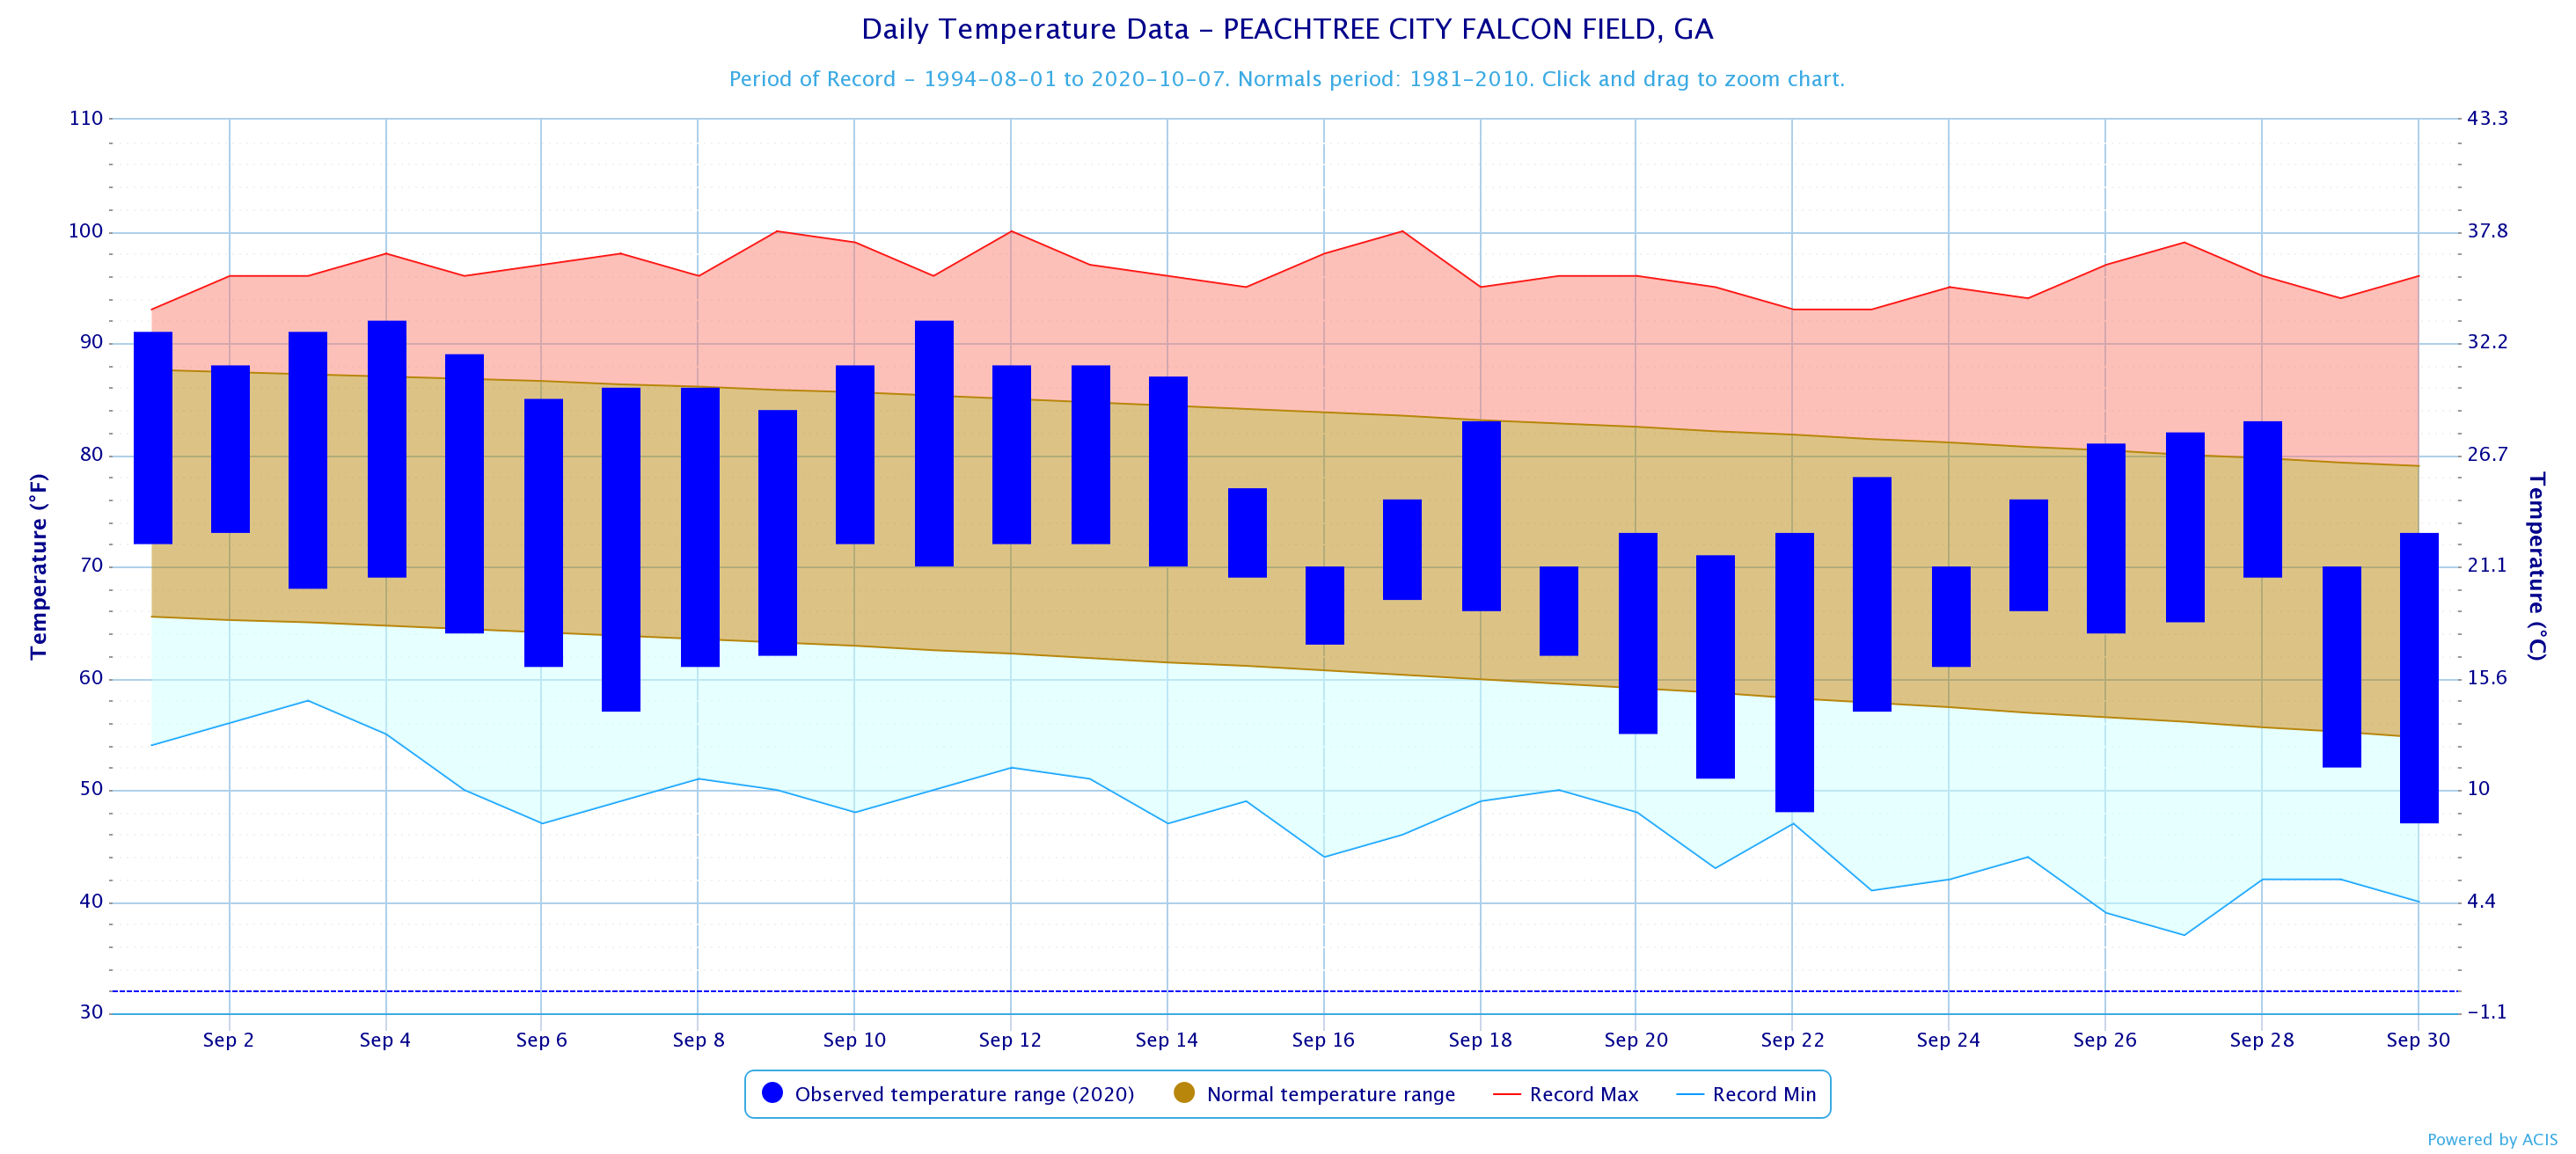
Peactree City
|
92
|
9/4, 9/11
|
47
|
9/30
|
|
Rome
|
95
|
9/4
|
46
|
9/22, 9/30
|
*Indicates a daily record was set
|
September 2020 Precipitation Climate Statistics
|
|||
| Climate Site | Total Precipitation |
Normal Precipitation
|
DFN (Departure
From Normal)
|
|
6.08
|
3.94
|
+2.14
|
|
|
5.67
|
4.47
|
+1.20
|
|
|
7.52
|
3.06
|
+4.46
|
|
|
7.97
|
3.59
|
+4.38
|
|
|
6.02
|
3.62
|
+2.40
|
|
|
7.06
|
4.56
|
+2.50
|
|
|
6.11
|
3.98
|
+2.13
|
|
|
7.19
|
4.68
|
+2.51
|
|
|
6.43
|
3.84
|
+2.59
|
|
|
4.02
|
3.41
|
+0.61
|
|
|
September 2020 Precipitation Climate Statistics
|
||||
| Climate Site | Maximum Daily Precip | Max P Date | ||
|
Athens
|
3.60
|
9/17*
|
||
|
Atlanta
|
2.79
|
9/17*
|
||
|
Columbus
|
3.72
|
9/16*
|
||
|
Macon
|
4.25
|
9/17*
|
||
|
Cartersville
|
2.03
|
9/17*
|
||
|
Dekalb Peachtree Arpt
|
3.42
|
9/17*
|
||
|
Fulton Co Arpt
|
3.53
|
9/17*
|
||
|
Gainesville
|
3.49
|
9/17*
|
||
|
Peachtree City
|
2.24
|
9/17*
|
||
|
Rome
|
2.06
|
9/24 | ||
*Indicates a daily record was set
Data prepared by NWS Peachtree City/Atlanta.
Temperature Maps |
Precipitation Maps
|
Temperature Graphs
|
Precipitation Graphs |


|
September 2020 Climate Records
|
|||
|
Date
|
Type
|
Location
|
Record
|
|
9/16
|
Precipitation
|
Columbus
|
3.72 inches of precipitation fell on 9/16. This breaks the previous record of 2.74 inches, last set in 2004.
|
|
9/16
|
Precipitation
|
Macon
|
2.90 inches of precipitation fell on 9/16. This breaks the previous record of 2.14 inches, last set in 1946.
|
|
9/17
|
Precipitation
|
Athens
|
3.60 inches of precipitation fell on 9/17. This breaks the previous record of 2.38 inches, last set in 1975.
|
|
9/17
|
Precipitation
|
Atlanta
|
2.79 inches of precipitation fell on 9/17. This breaks the previous record of 2.74 inches, last set in 1971.
|
|
9/17
|
Precipitation
|
Macon
|
4.25 inches of precipitation fell on 9/17. This breaks the previous record of 2.88 inches, last set in 2009.
|
No severe thunderstorm warnings were issued through the month of September, but there were many Flash Flood Warnings, Flood Warnings, and River Flood Warnings issued. The biggest event that occurred across the area was on September 16th through September 17th when the remnants of Hurricane Sally passed through the area. More information on the impacts across north and central Georgia from the remnants of Hurricane Sally can be found here.
Here is a visual summary of all the warnings and local storm reports issued across portions of northern and central Georgia in September 2020.

Based on the Climate Prediction Center's outlook for October, much of north and central Georgia has a 40% to 50% chance of below normal temperatures. For precipitation, north Georgia has a 40% to 50% chance of below normal precipitation and central Georgia has a 33% to 40% chance of below normal precipitation.


Based on the Climate Prediction Center's outlook for Fall (October, November, and December), all of north and central Georgia has a 40% to 50% chance of above normal temperatures. For precipitation, western Georgia has a 33% to 40% chance of below normal precipitation and eastern Georgia has equal changes of above normal, normal, or below normal precipitation.

Data prepared by NWS Peachtree City/Atlanta.

