| Previous Month | Next Month |
Temperatures through the month of November were around two degrees above normal. Precipitation through the month of October was around two inches above normal.
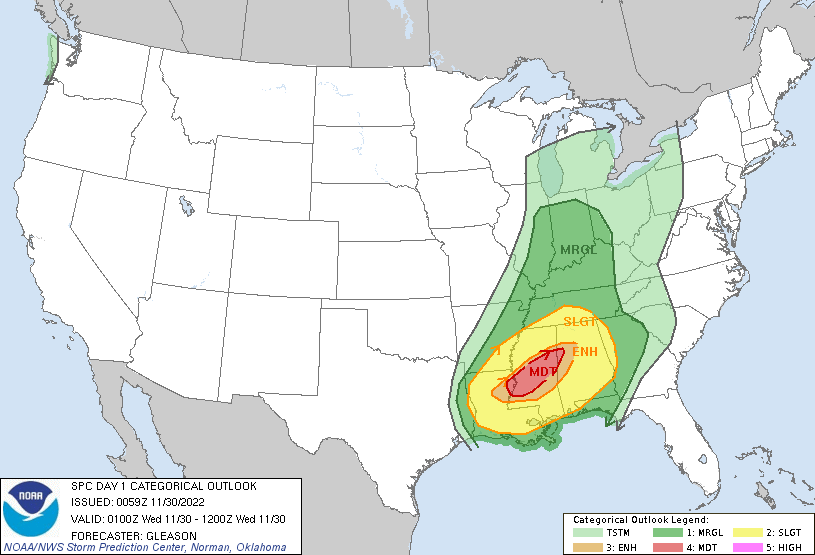
Climate Site Temperatures Precipitation Climate Site Maximum Temperature Max T Date *Indicates a daily record was set Climate Site Total Precipitation DFN (Departure Climate Site Maximum Daily Precip (in inches) Max P Date *Indicates a daily record was set Data prepared by NWS Peachtree City/Atlanta November 30th -- A tornado outbreak that took place earlier in the afternoon across portions of eastern Mississippi and western Alabama organized into a QLCS and brought a number of severe thunderstorms to western Georgia along the border of Alabama. Numerous trees and powerlines were reported down with winds exceeding 45 mph. In addition, heavy rains prompted a Flood Watch and led to isolated flooding in some areas. Macon received 1.83 inches of rainfall, which set an all-time daily record. Based on the Climate Prediction Center's outlook for December, south and central Georgia has a 33% to 40% chance of above normal temperatures while the remainder of Georgia has an equal chance of above or below normal temperatures. For precipitation, all of south and central Georgia has a 33% to 40% chance of below normal precipitation while the remainder of Georgia has an equal chance of above or below normal precipitation.
Overview
Climate Graphs
Records
Events
December Outlook
Below are the overview stats for November 2022 for our 10 climate sites.
November 2022 November Rankings
Athens
19th Warmest
11th Wettest
Atlanta
14th Warmest
28th Wettest
Columbus
18th Warmest
6th Wettest
Macon
15th Warmest
6th Wettest
November 2022 Climate Averages
Climate Site
November Temp (°F)
Average Temp
Departure from normal
Athens
55.0
53.3
1.7
Atlanta
56.6
54.2
2.4
Columbus
58.6
57.3
1.3
Macon
58.5
55.8
2.7
Cartersville
54.0
50.8
3.2
Dekalb Peachtree Arpt
53.7
51.5
2.2
Fulton Co Arpt
54.8
52.3
2.5
Gainesville
54.9
51.8
3.1
Peachtree City
55.5
53.2
2.3
Rome
53.9
51.4
2.5
November 2022 Temperature Climate Statistics
Minimum Temperature
Min T Date
Athens
85*
11/7
24
11/21
Atlanta
83*
11/6, 7
30
11/18
Columbus
85
11/6, 7
27
11/21
Macon
87
11/7
25
11/21
Cartersville
82
11/6, 7
23
11/21
Dekalb Peachtree Arpt
83
11/7
24
11/21
Fulton Co Arpt
83
11/7
24
11/21
Gainesville
82
11/7
28
11/28
Peachtree City
85
11/6
23
11/21
Rome
85
11/7
22
11/21
November 2022 Precipitation Climate Statistics
Average Precipitation
From Normal)
Athens
5.97
3.77
2.2
Atlanta
4.23
3.98
0.25
Columbus
7.19
3.96
3.23
Macon
5.89
3.37
2.52
Cartersville
4.70
4.06
0.64
Dekalb Peachtree Arpt
5.43
4.21
1.22
Fulton County Arpt
4.73
3.77
0.96
Gainesville
3.44
4.18
-0.74
Peachtree City
4.49
3.91
0.58
Rome
5.66
4.17
1.49
November 2022 Precipitation Climate Statistics
Athens
1.98
11/10
Atlanta
1.85
11/29
Columbus
2.75*
11/26
Macon
2.47
11/10
Cartersville
1.91
11/30
Dekalb Peachtree Arpt
2.65
11/29
Fulton Co Arpt
2.40
11/29
Gainesville
1.41
11/29
Peachtree City
1.88
11/29
Rome
3.25
11/29
Click the links below to explore the temperature and precipitation data across north and central Georgia for the month of November 2022.
Temperature Maps
Precipitation Maps
Temperature Graphs
Precipitation Graphs
Temperature and precipitation records at our 4 main climate sites are located below.
November 2022 Climate Records
Date
Type
Location
Records set over a 24 hour period
11/27
Daily Rainfall
Columbus
2.62 inches of rain fell over 24 hours which breaks the old record of 2.28 inches set in 1948.
11/27
Daily Rainfall
Macon
1.83 inches of rain fell over 24 hours which breaks the old record of 1.26 inches set in 1902.
November 2022 Climate Records
Date
Type
Location
Records set over a 24 hour period
11/7
Max Temp
Athens
Athens rose to 85°F which breaks the record of 84°F in 2017
11/7
Max Temp
Atlanta
Atlanta rose to 83°F which breaks the record of 79°F in 2017
Larger events that occurred across north and central Georgia this past November can be found here.


The December climate outlook is below.
December Outlook

