| Previous Month | Next Month |
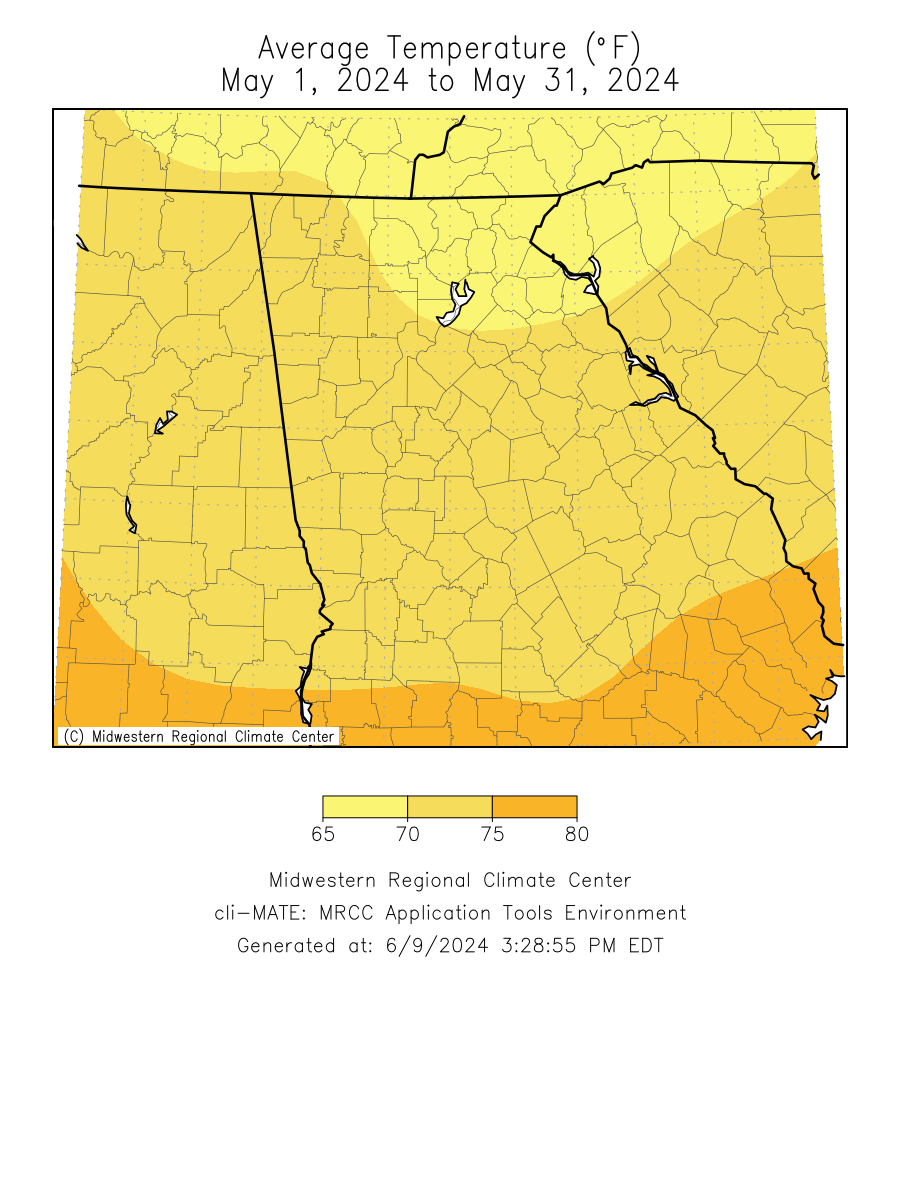
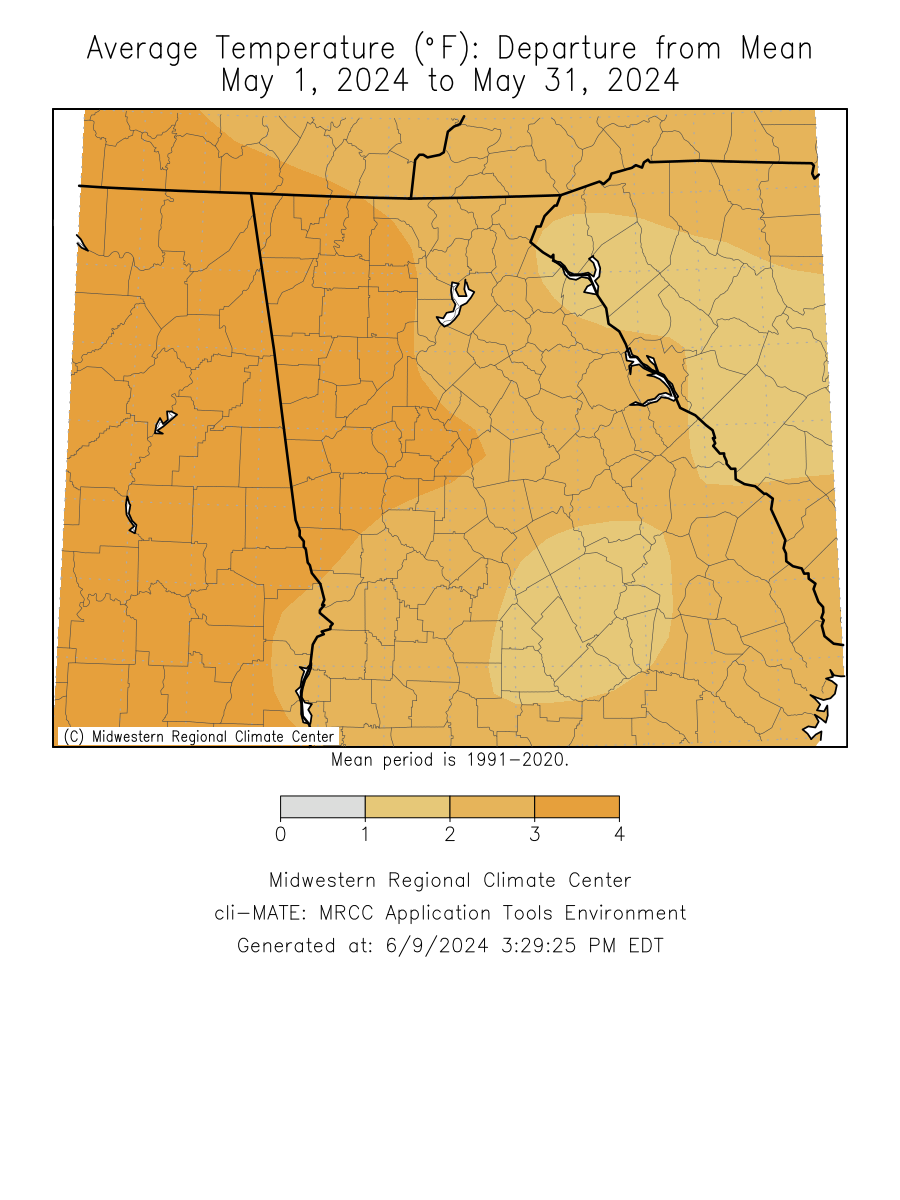
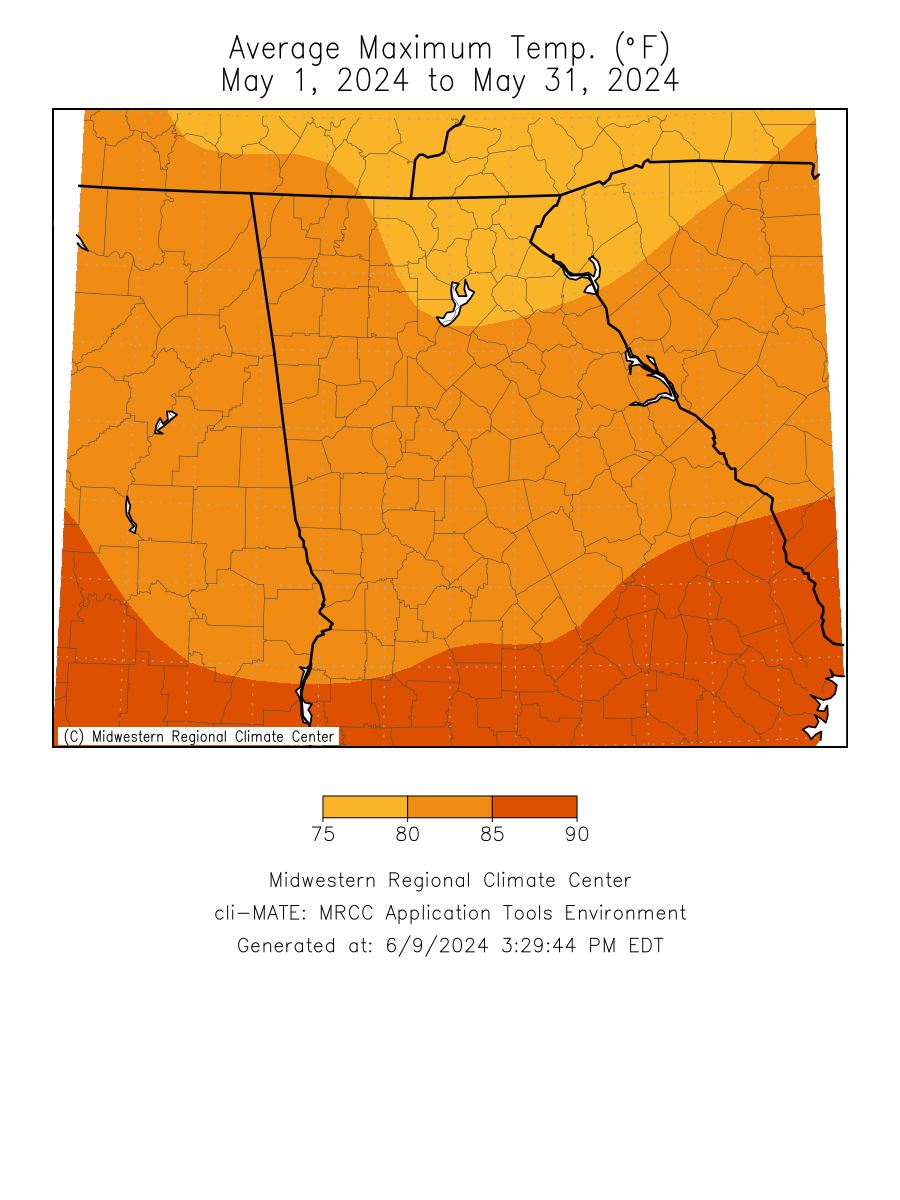
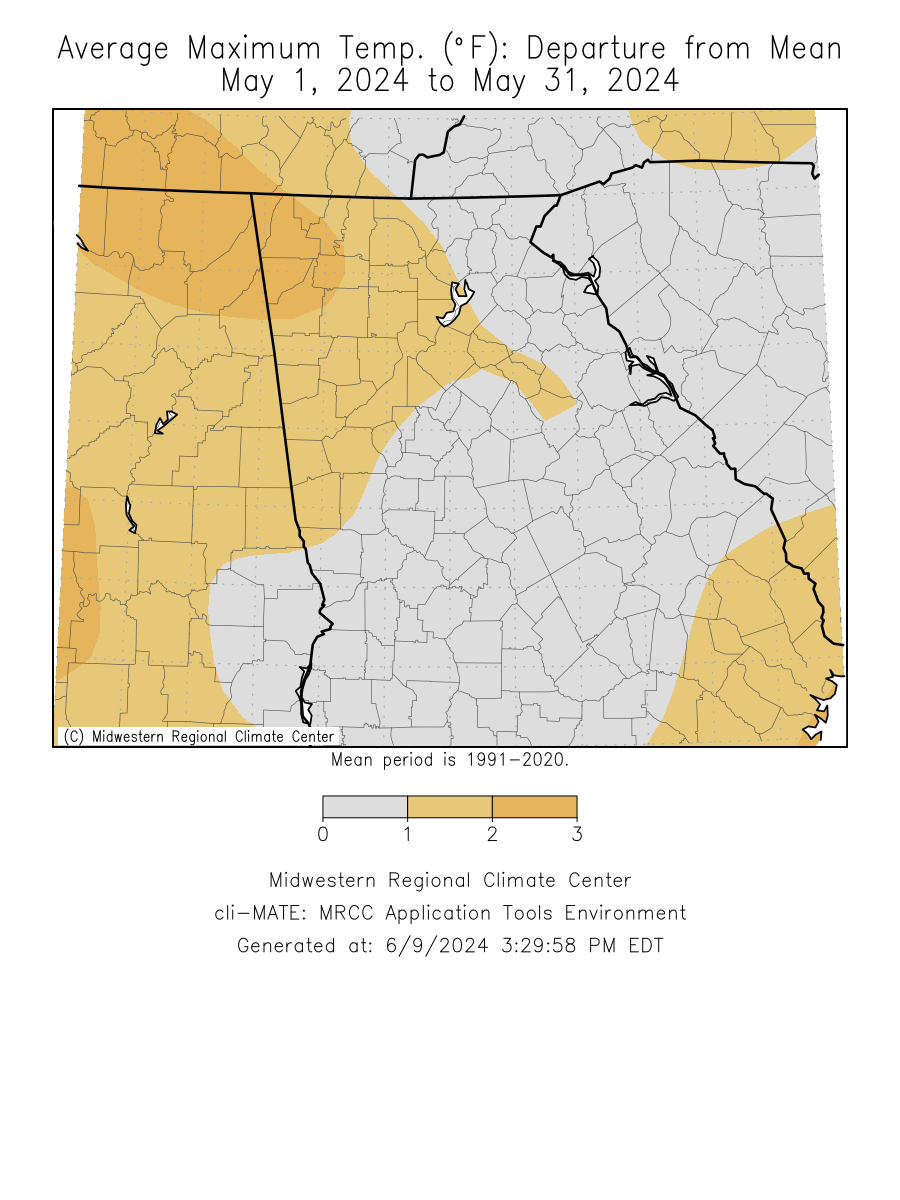
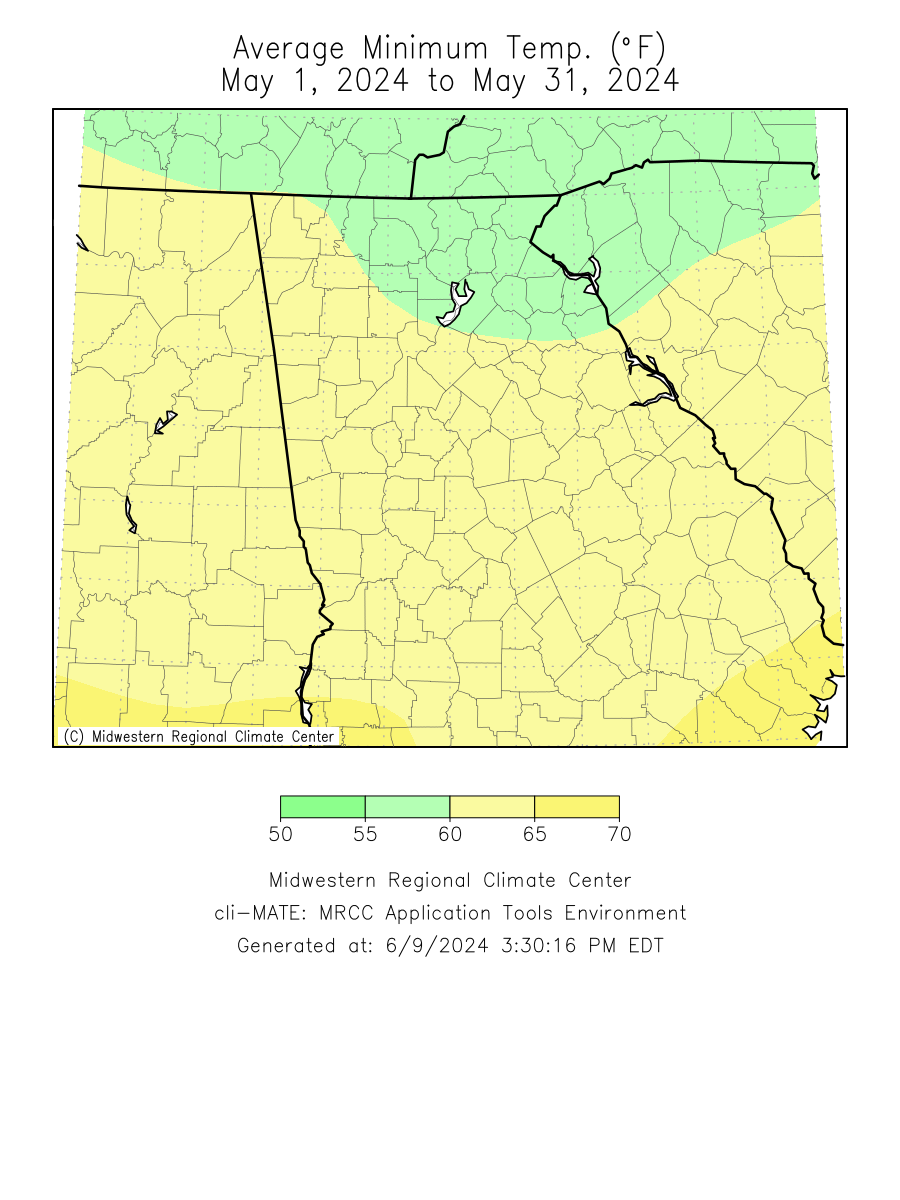
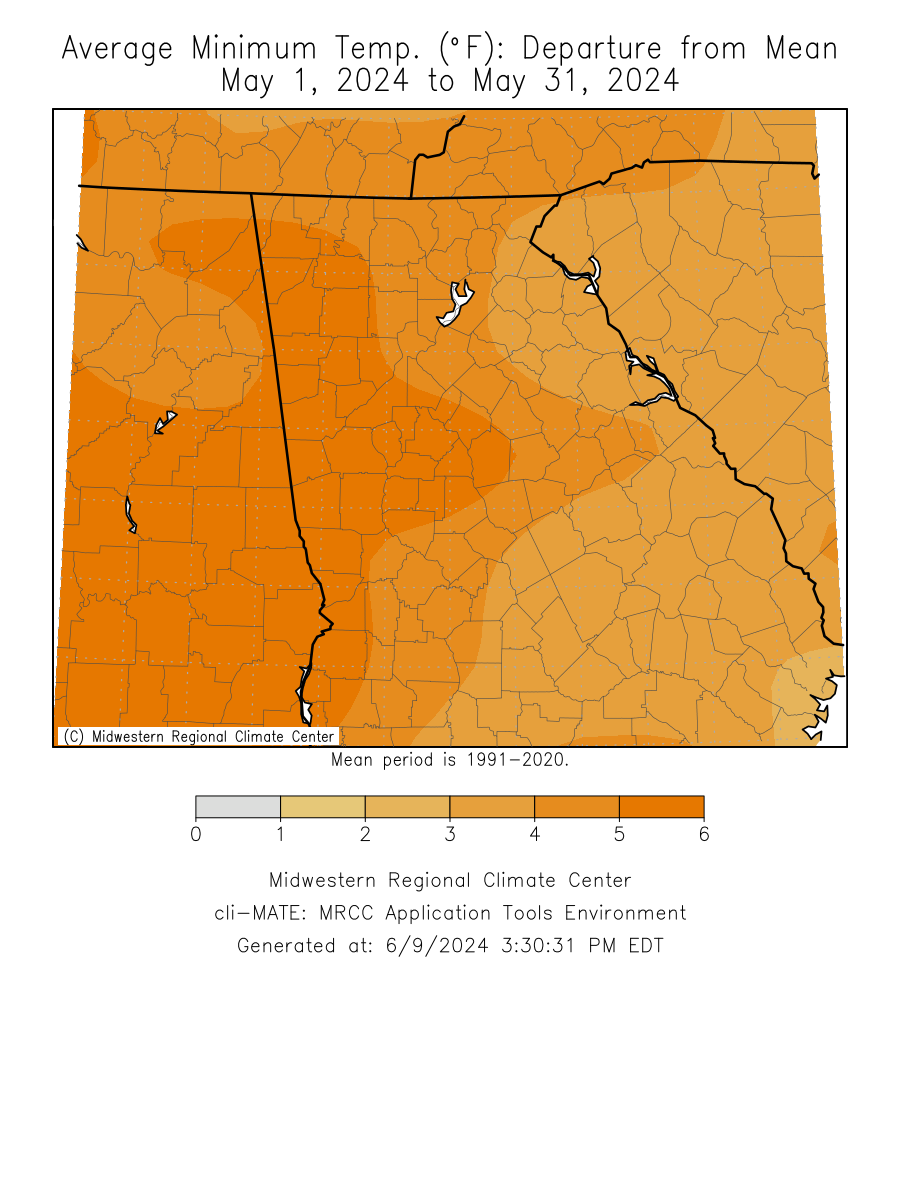
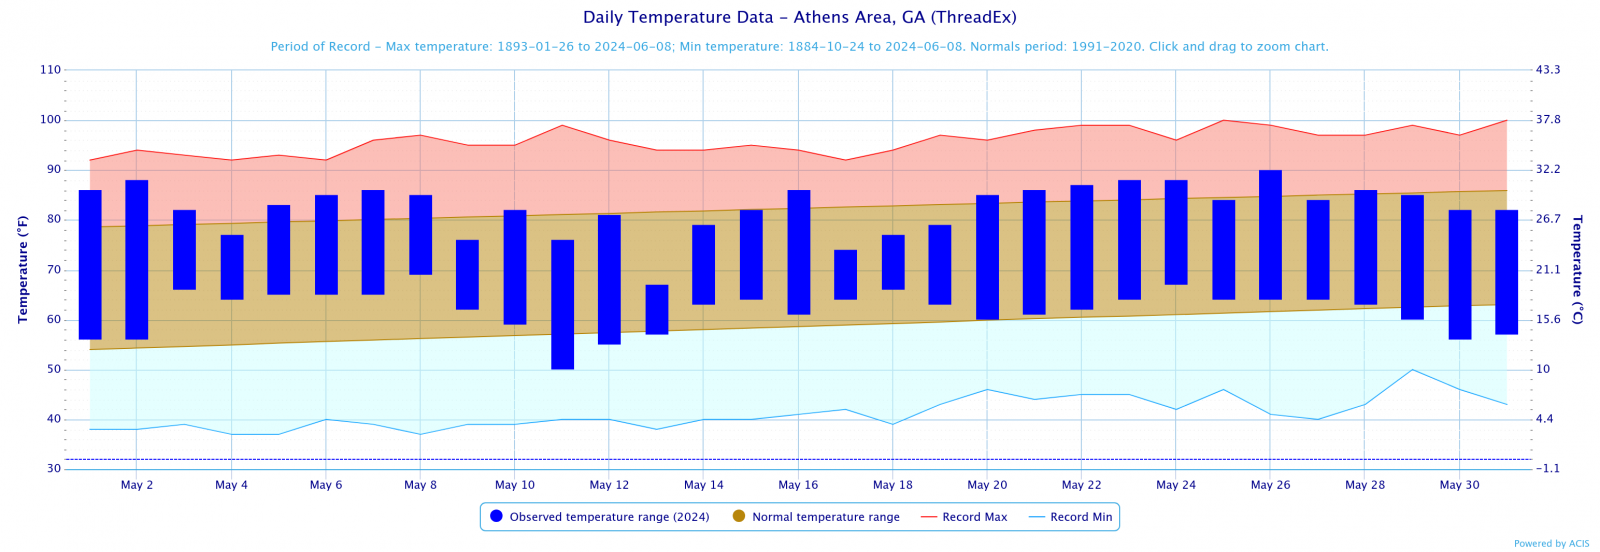
Temperatures through the month of May were around 3 degrees above normal. Precipitation through the month of May was within two inches of normal.
Climate Site Maximum Temperature Max T Date Climate Site Total Precipitation DFN (Departure Climate Site Maximum Daily Precip (in inches) Maximum Precip Date Data prepared by NWS Peachtree City/Atlanta May 8-9 Severe Weather Outbreak The remnants of an MCS moved into northern Georgia the evening of May 8th and began two days of severe weather including a number of tornadoes across the central parts of north and central Georgia. As the system moved in from the northwest, increasing low-level warm advection associated with a low level jet was introduced to an environment with 1500+ J/KG of SBCAPE with favorable hodograph profiles for rotating storms capable of producing tornadoes. The morning of the 9th found this system alive and well as it moved through the metro area. It would take a few hours of diurnal heating for the storm to tap into more energy south and east of I-85. As the storm moved south, mesoscale parameters continued to show improvement in the environment. Embedded supercells, isolated tornadoes and significant wind damage were widespread across most of central Georgia. Based on the Climate Prediction Center’s outlook for June, North and Central Georgia has an equal chance for above, below or near normal temperature while western Georgia has a 33% to 40% chance of above normal precipitation.
Overview
Climate Graphics
Records
Events
June Outlook
Below are the overview stats for May 2024 for our 10 climate sites.
May 2024 Climate Averages
Climate Site
May Temp (°F)
Average Temp
Departure from normal
Athens
72.1
70.5
1.6
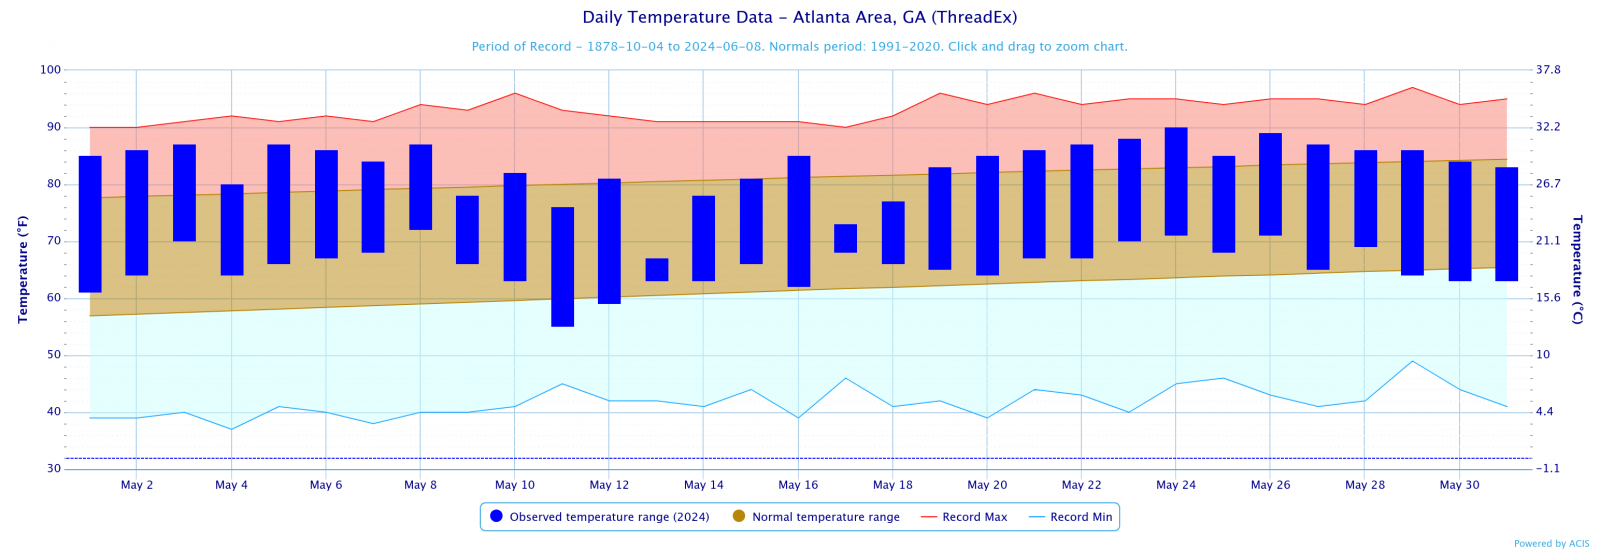
Atlanta
74.3
71.2
3.1
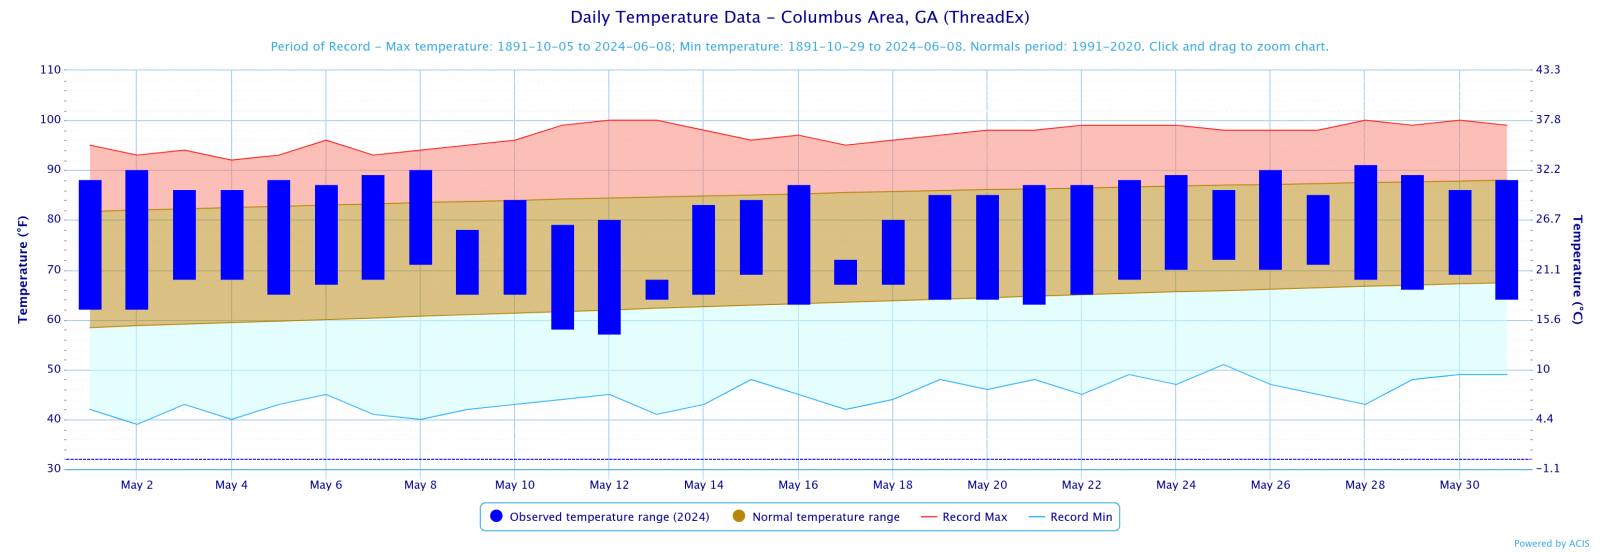
Columbus
75.5
74.1
1.4
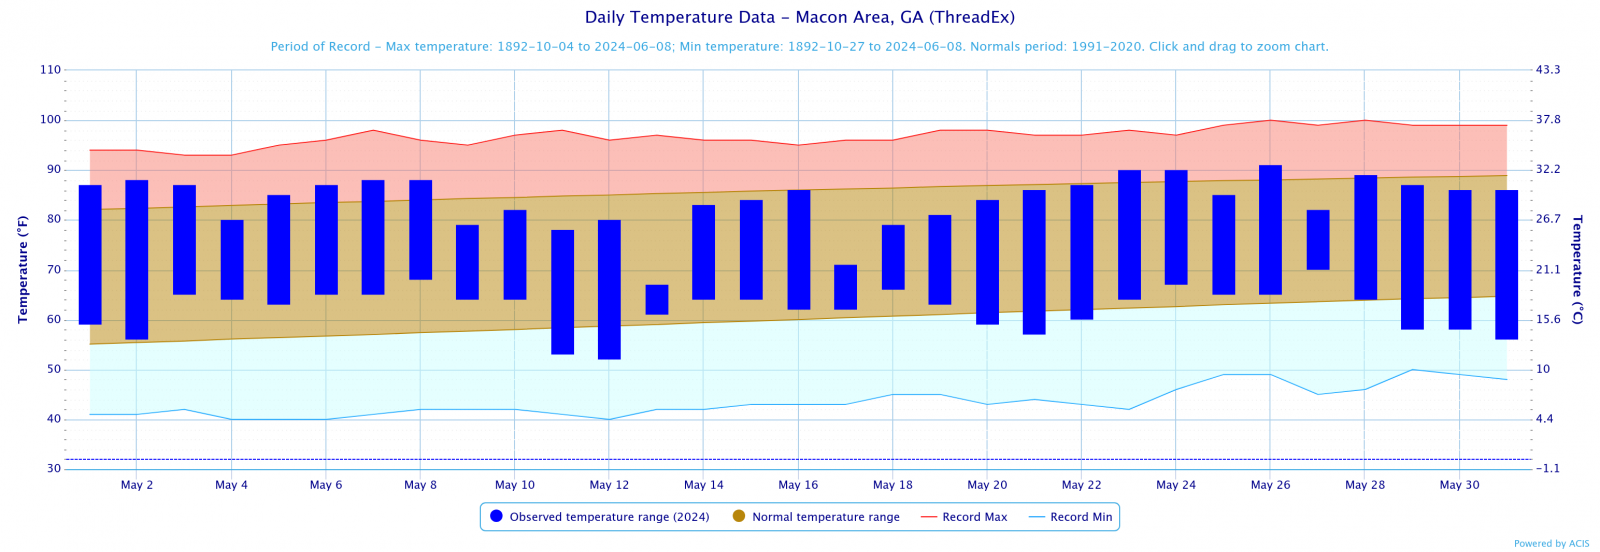
Macon
73.0
72.9
0.1
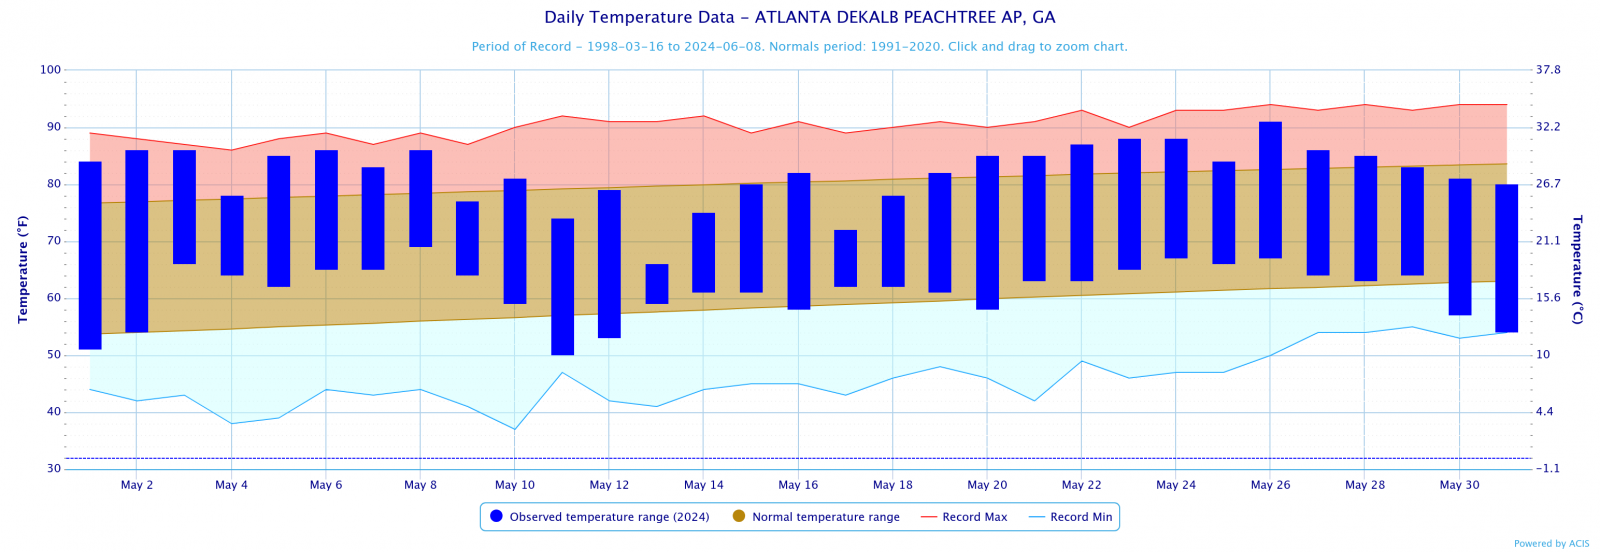
Dekalb Peachtree Arpt
71.6
69.4
2.2
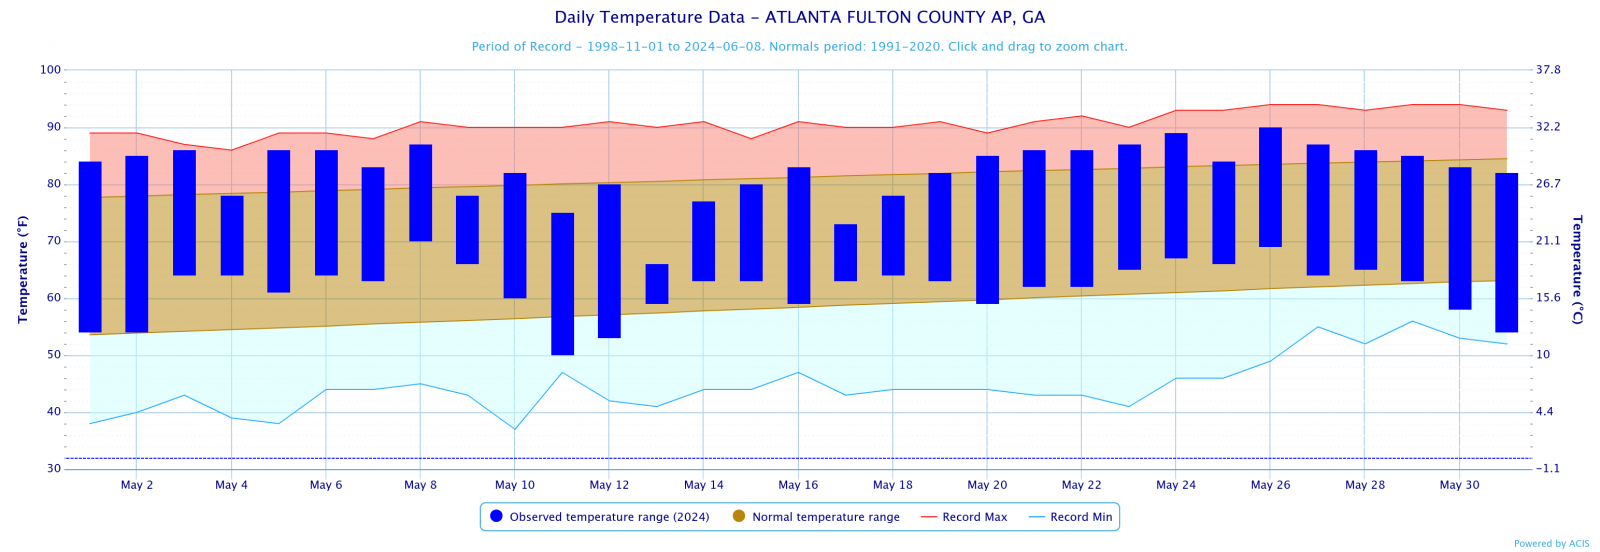
Fulton Co Arpt
72.1
69.8
2.3
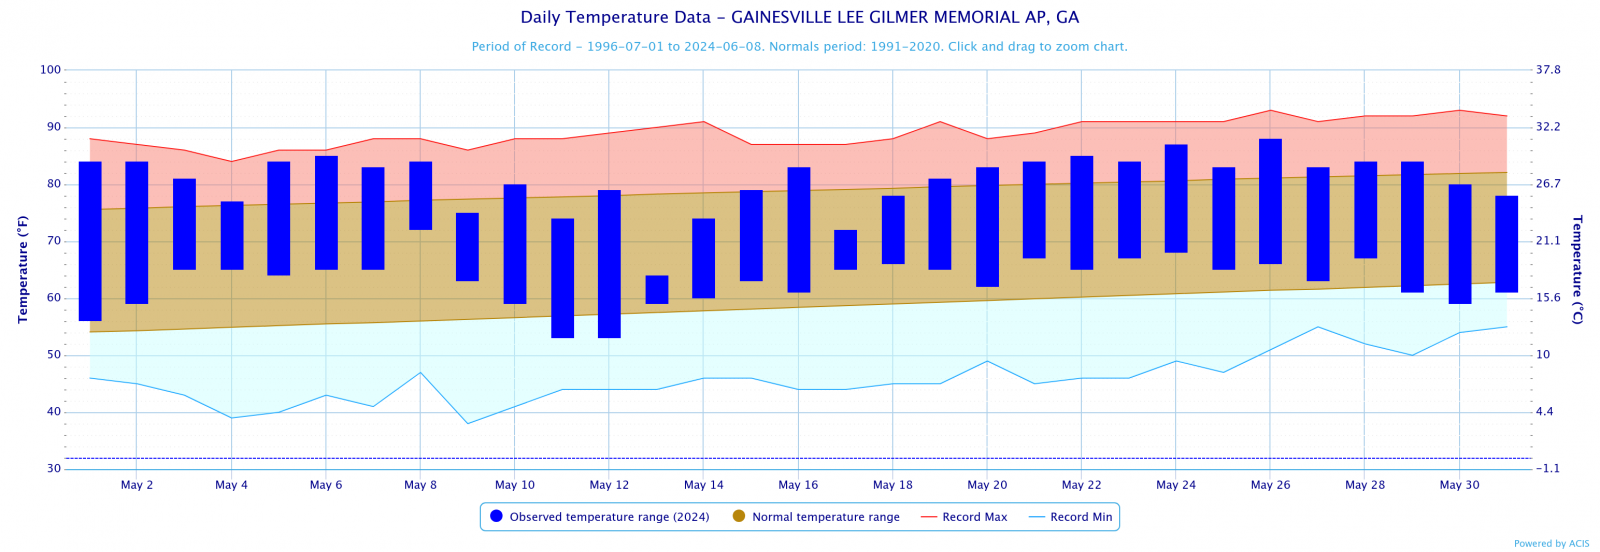
Gainesville
71.8
68.7
3.1
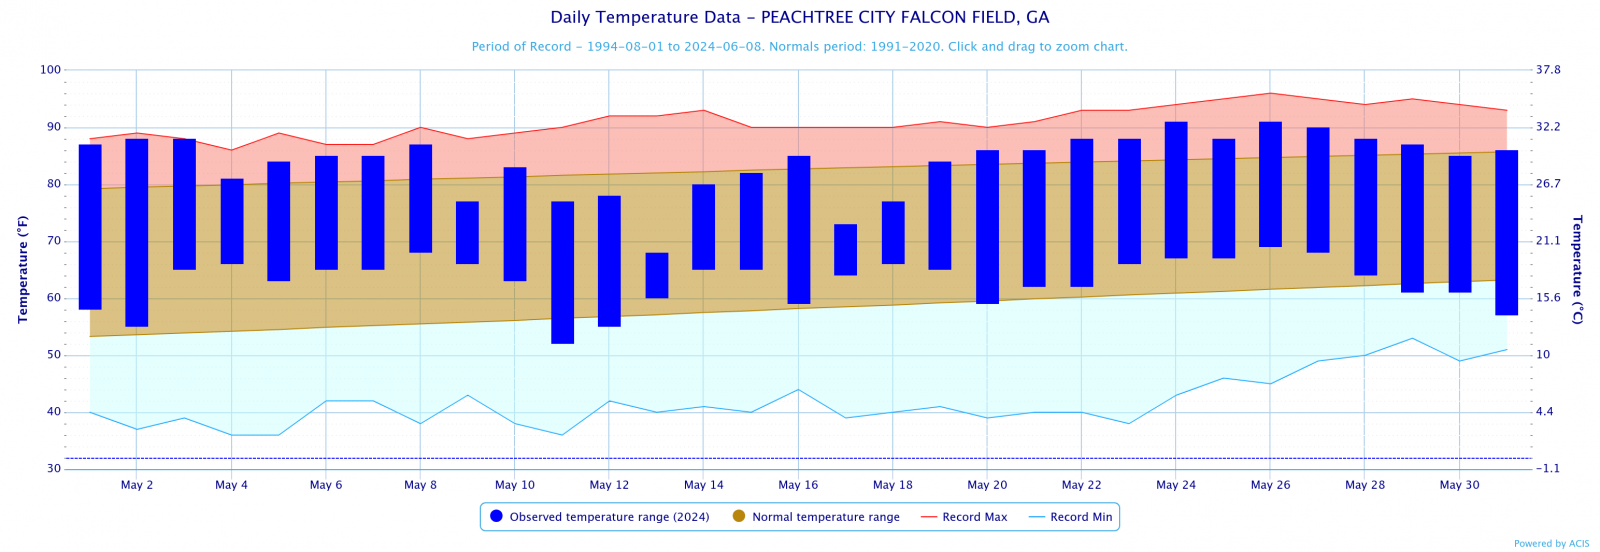
Peachtree City
73.4
70.4
3.0
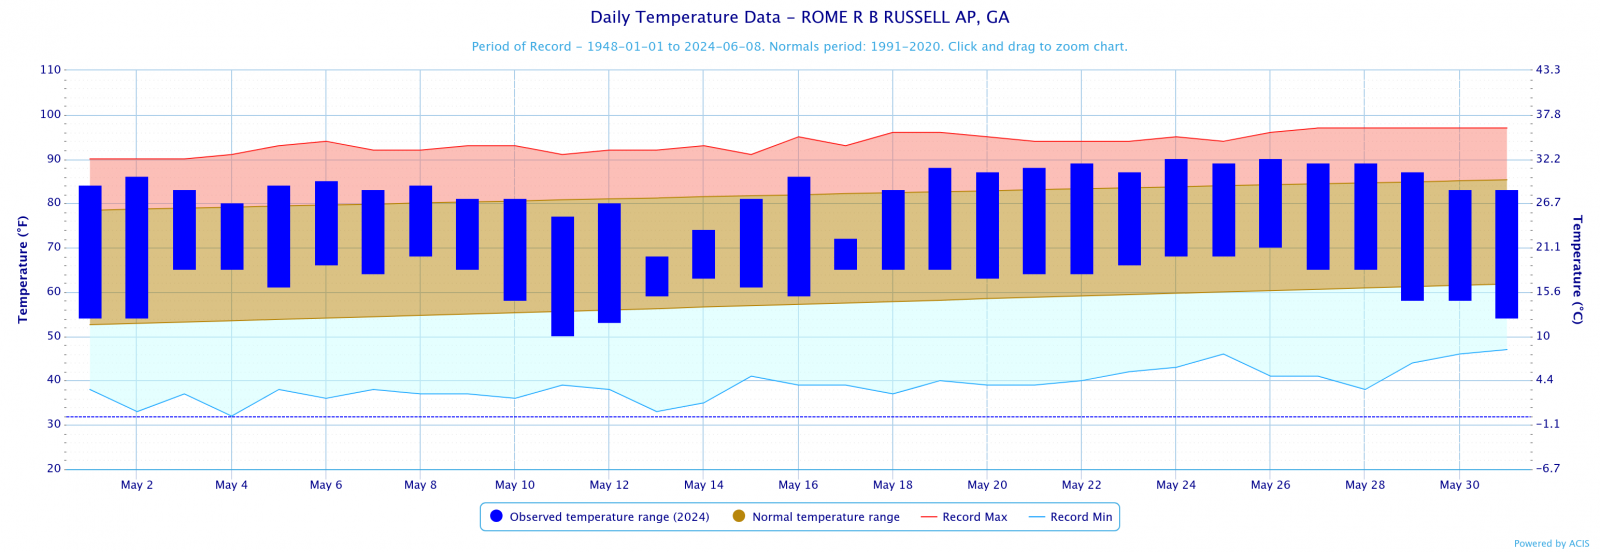
Rome
72.8
69.5
3.3
May 2024 Temperature Climate Statistics
Minimum Temperature
Min T Date
Athens
90
5/26
50
5/11
Atlanta
90
5/24
55
5/11
Columbus
91
5/28
57
5/12
Macon
91
5/2
52
5/12
Dekalb Peachtree Arpt
91
5/26
50
5/11
Fulton Co Arpt
90
5/26
50
5/11
Gainesville
88
5/26
53
5/11
Peachtree City
91
5/26, 24
52
5/11
Rome
90
5/24, 26
50
5/11
May 2024 Precipitation Climate Statistics
Average Precipitation
From Normal)
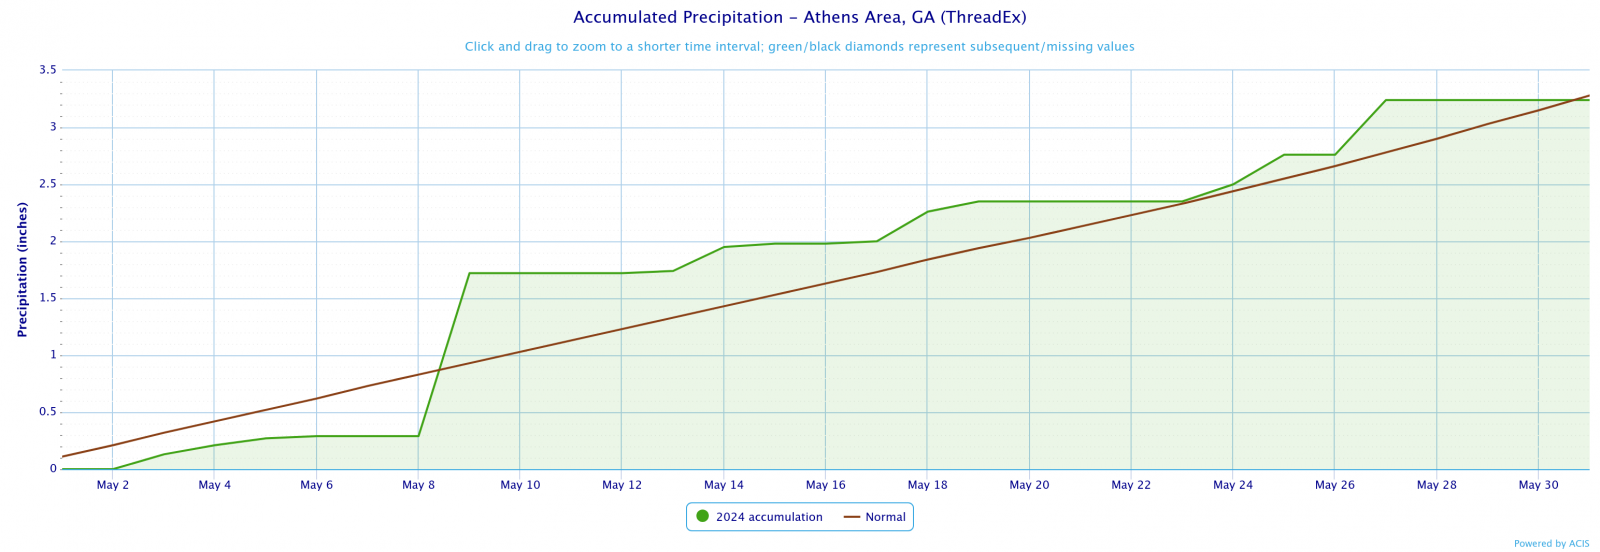
Athens
3.24
3.28
-0.04
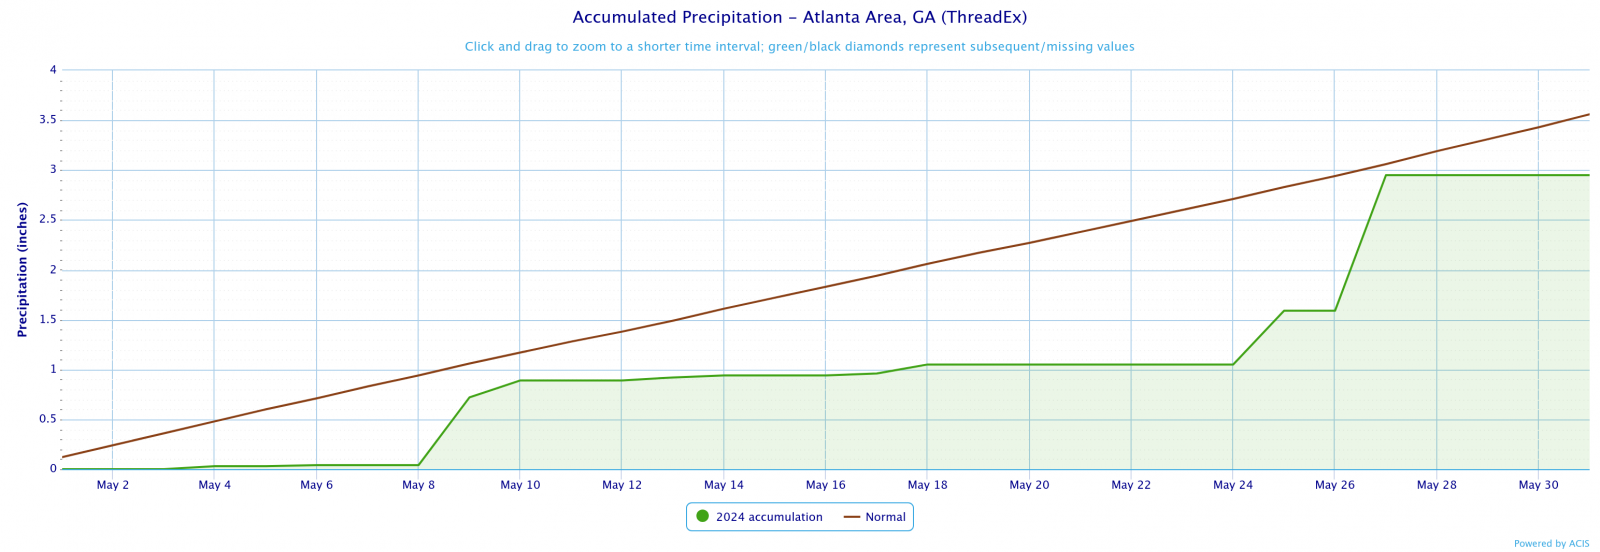
Atlanta
2.95
3.56
-0.61
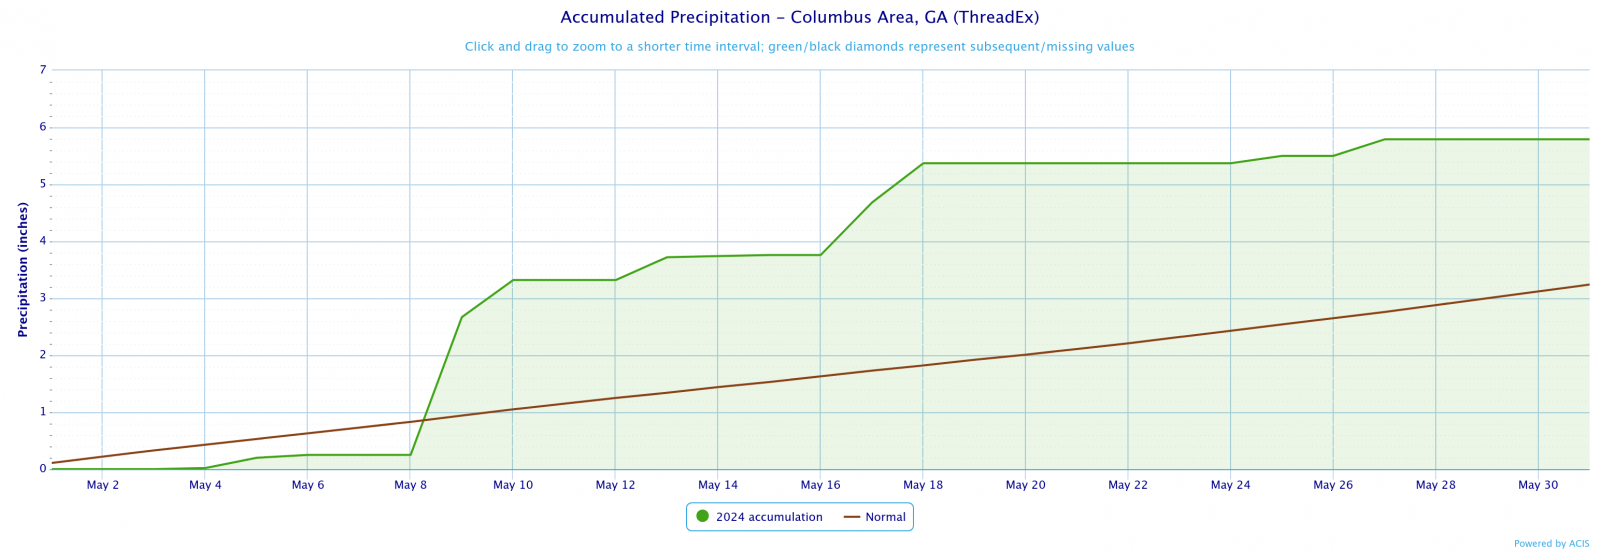
Columbus
5.79
3.24
+2.55
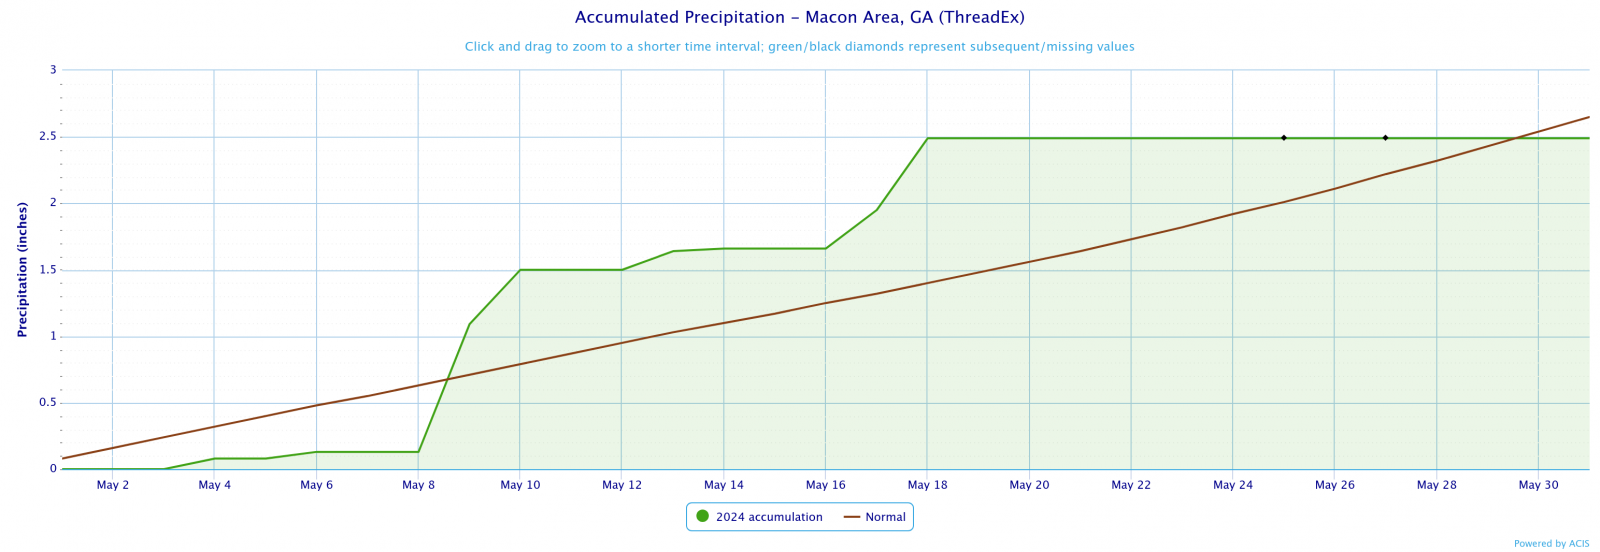
Macon
2.49
2.65
-0.16
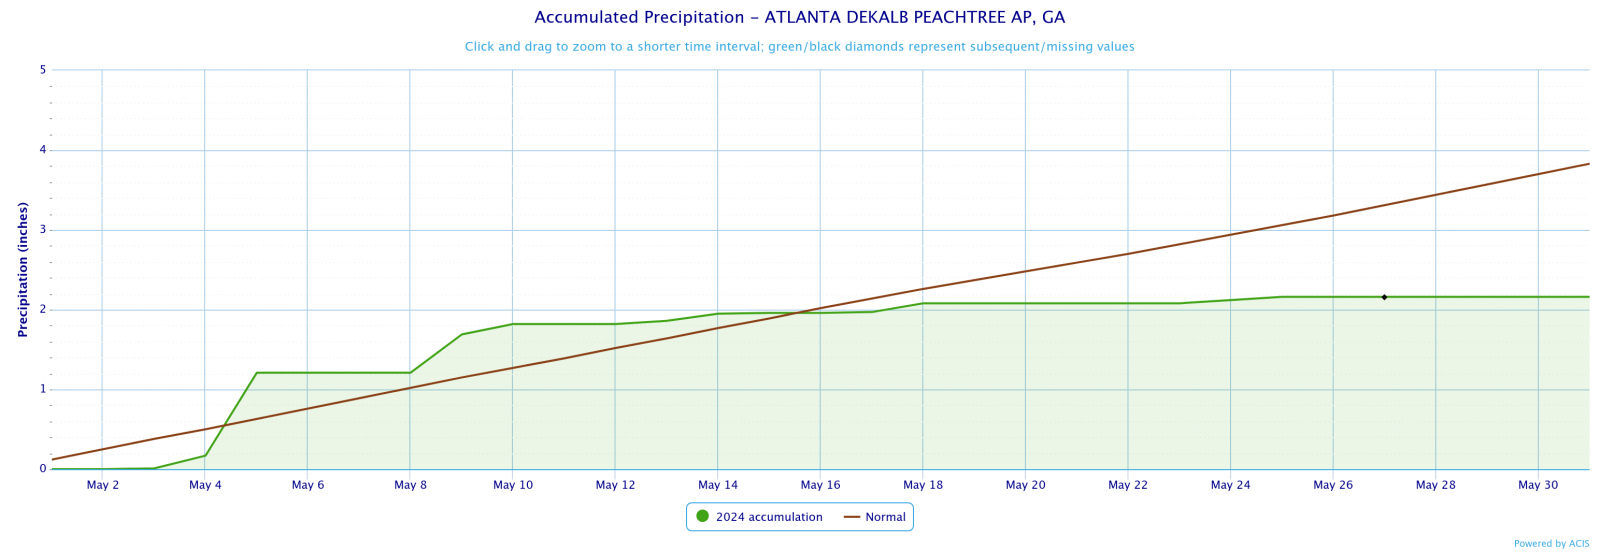
Dekalb Peachtree Arpt
2.16
3.83
-1.67
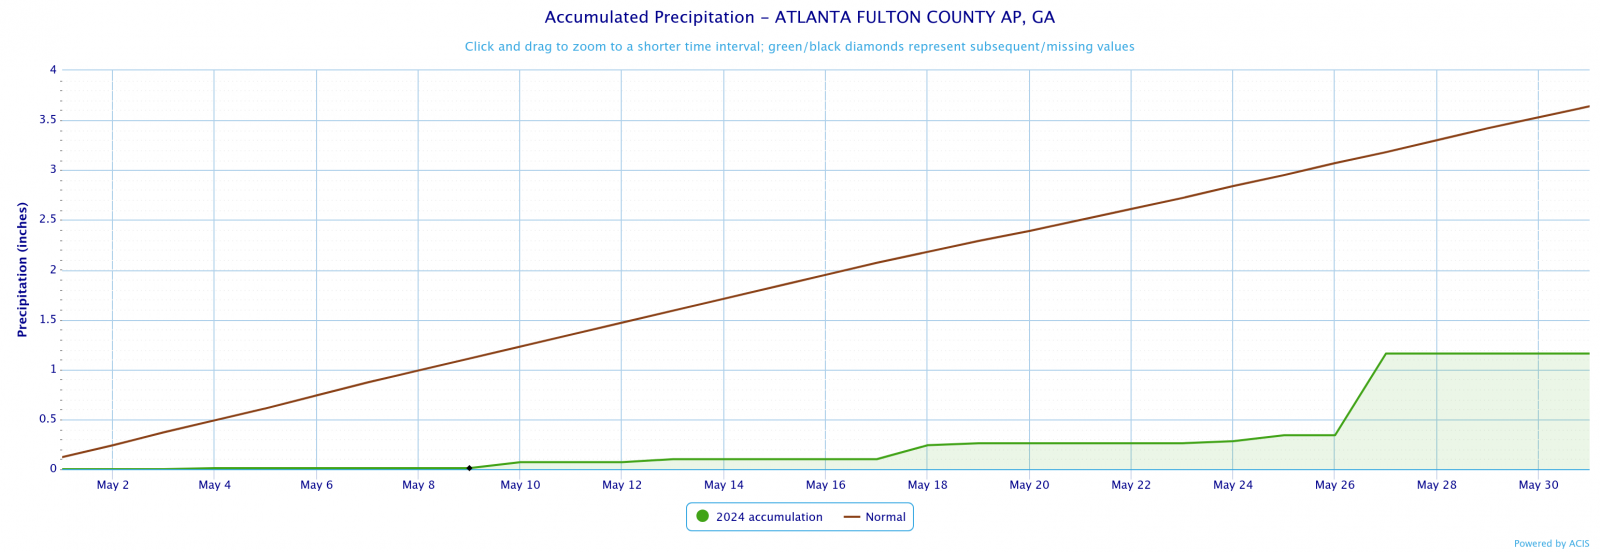
Fulton County Arpt
1.16
3.64
-2.48
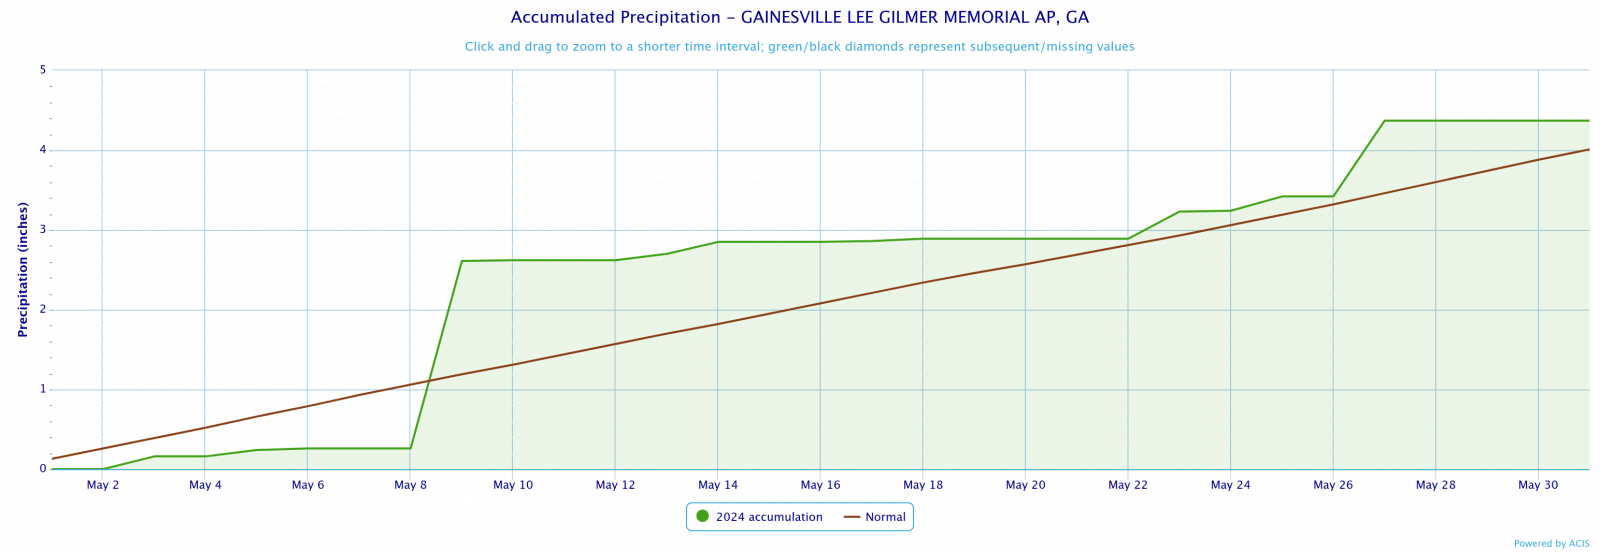
Gainesville
4.37
4.01
+0.36
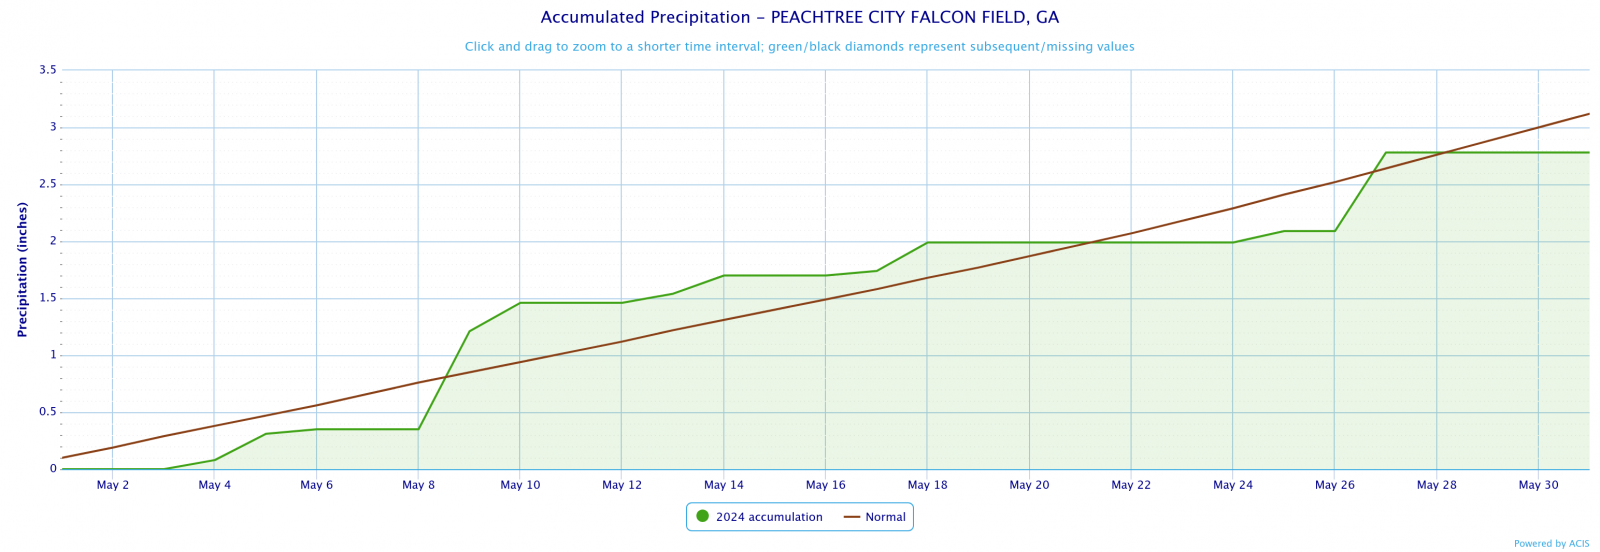
Peachtree City
2.78
3.12
-0.34
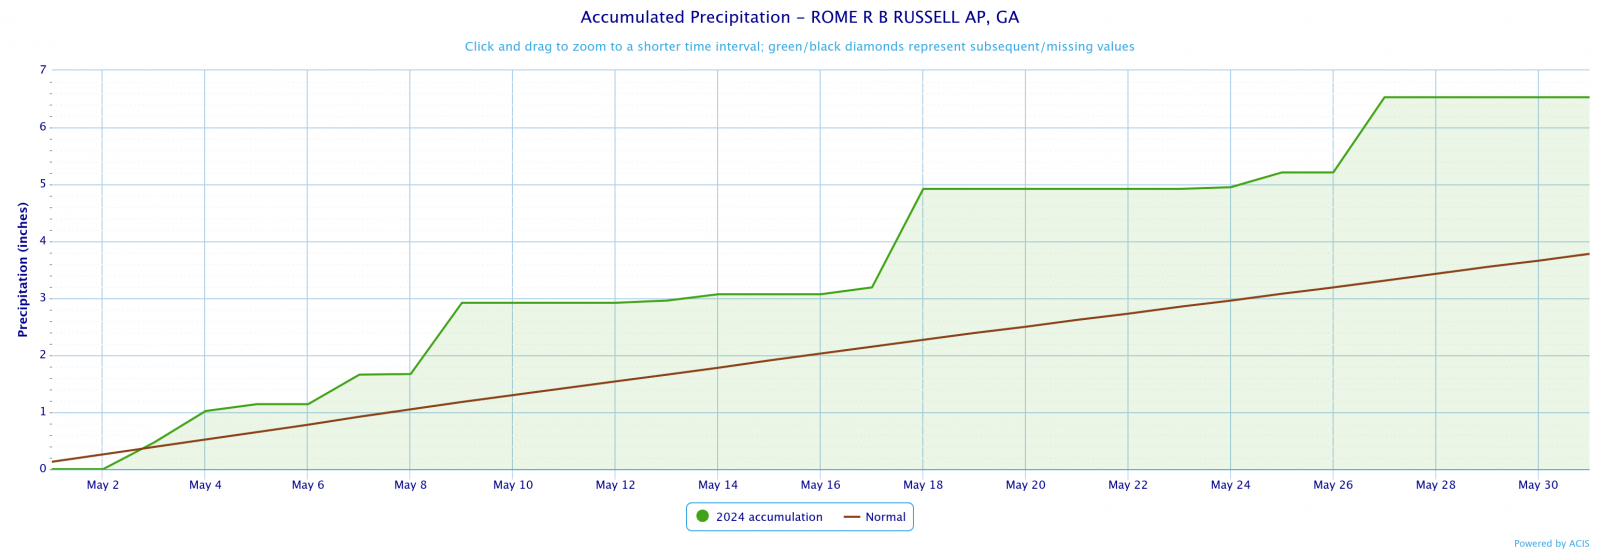
Rome
6.53
3.78
+2.75
May 2024 Precipitation Climate Statistics
Athens
1.43
5/9
Atlanta
1.36
5/27
Columbus
3.07
5/9
Macon
1.37
5/9
Dekalb Peachtree Arpt
1.16
5/5
Fulton Co Arpt
0.82
5/27
Gainesville
2.35
5/9
Peachtree City
1.11
5/10
Rome
1.75
5/18
Click the links below to explore the temperature and precipitation data across north and central Georgia for the month of May 2024.
Temperature Maps
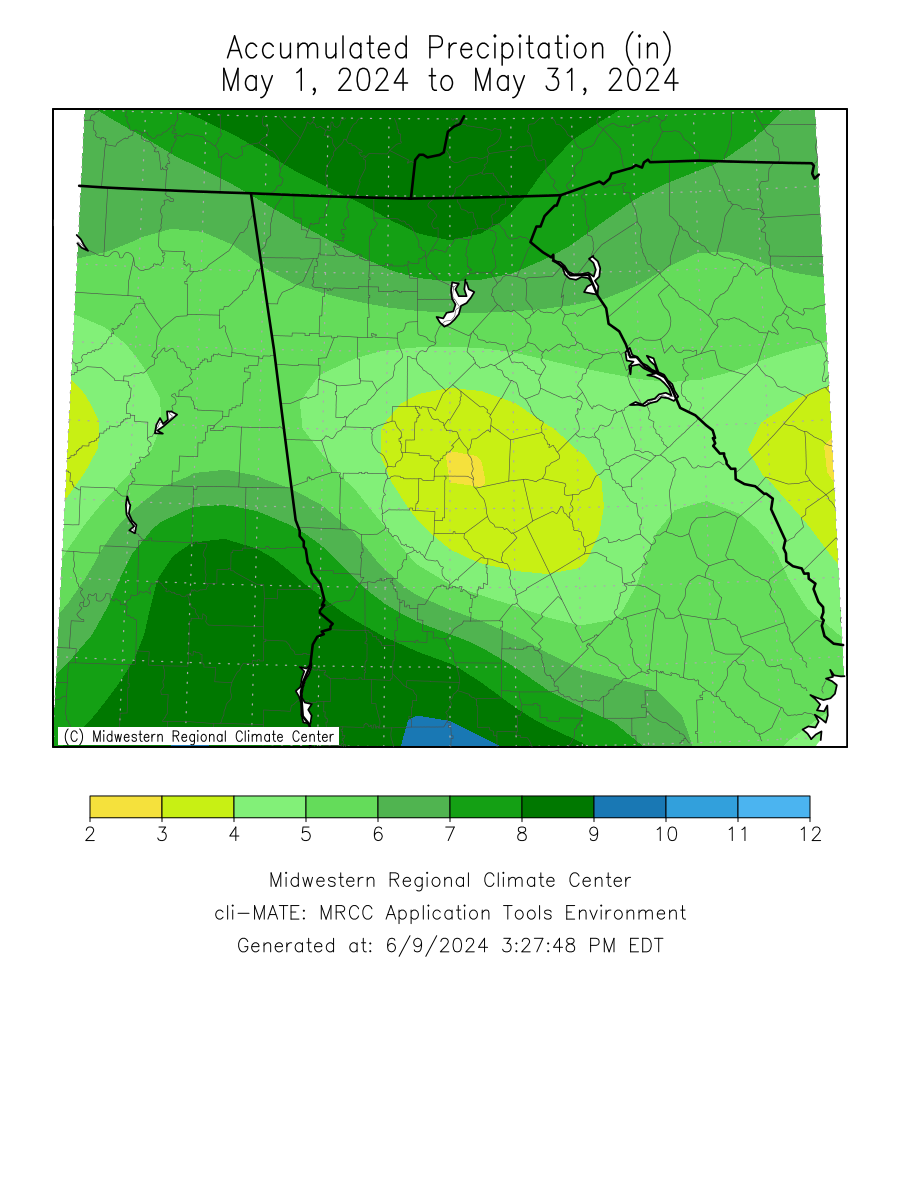
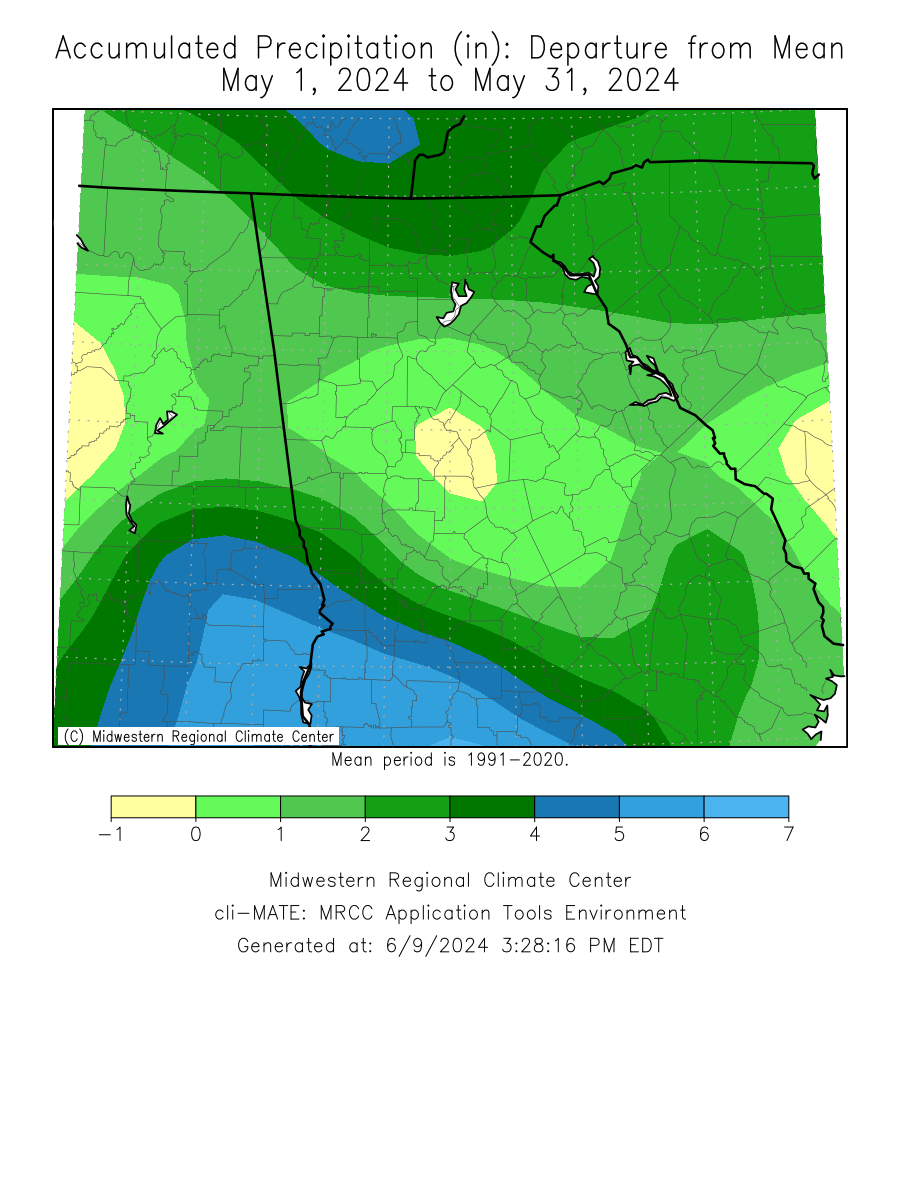
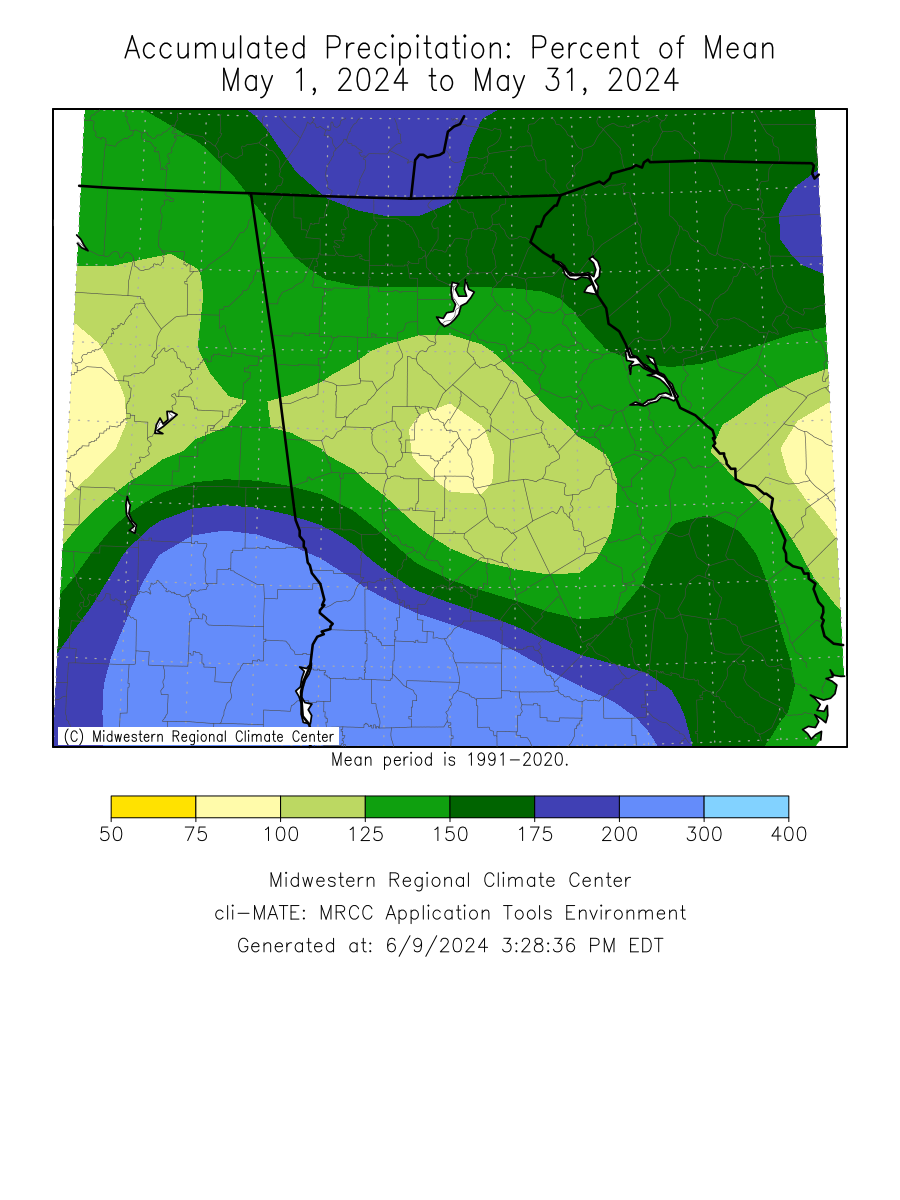
Precipitation Maps
Temperature Graphs
Precipitation Graphs
May 2024 Climate Records
Date
Type
Location
Records set over a 24 hour period
5/09
Daily Rainfall
Columbus
3.07 Inches of rain fell over 24 hours. This breaks the old record of 2.11 inches set in 1990.
Larger events that occurred across north and central Georgia this past May can be found here.

June Outlook