| Previous Month | Next Month |
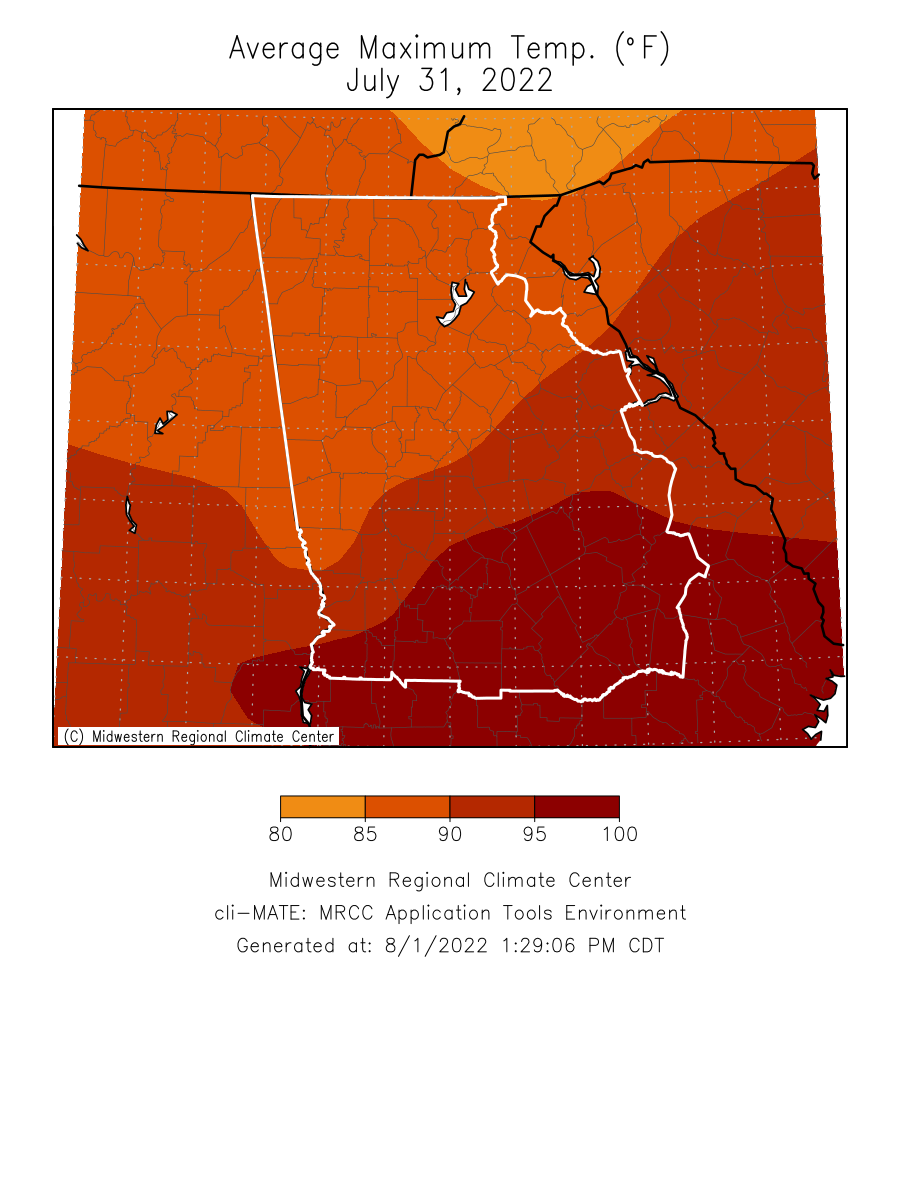
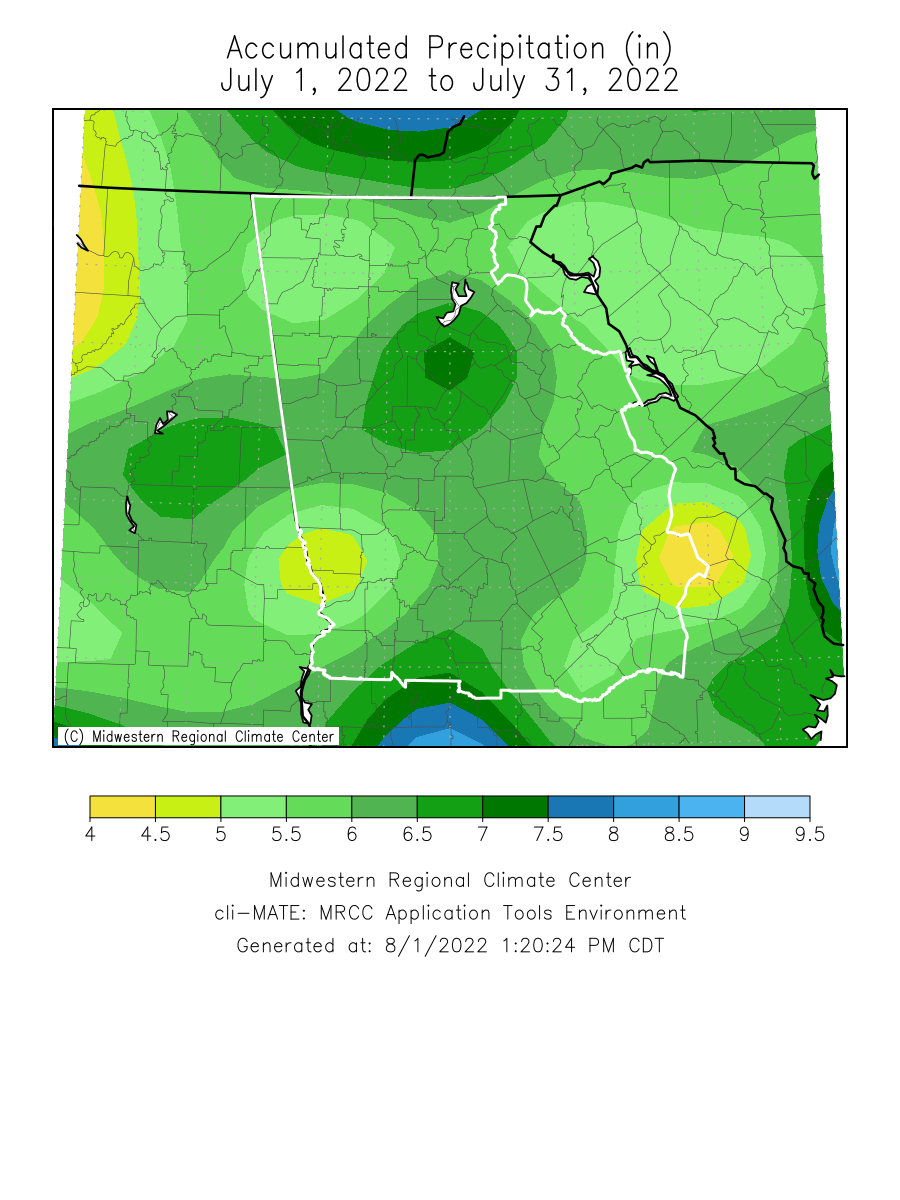
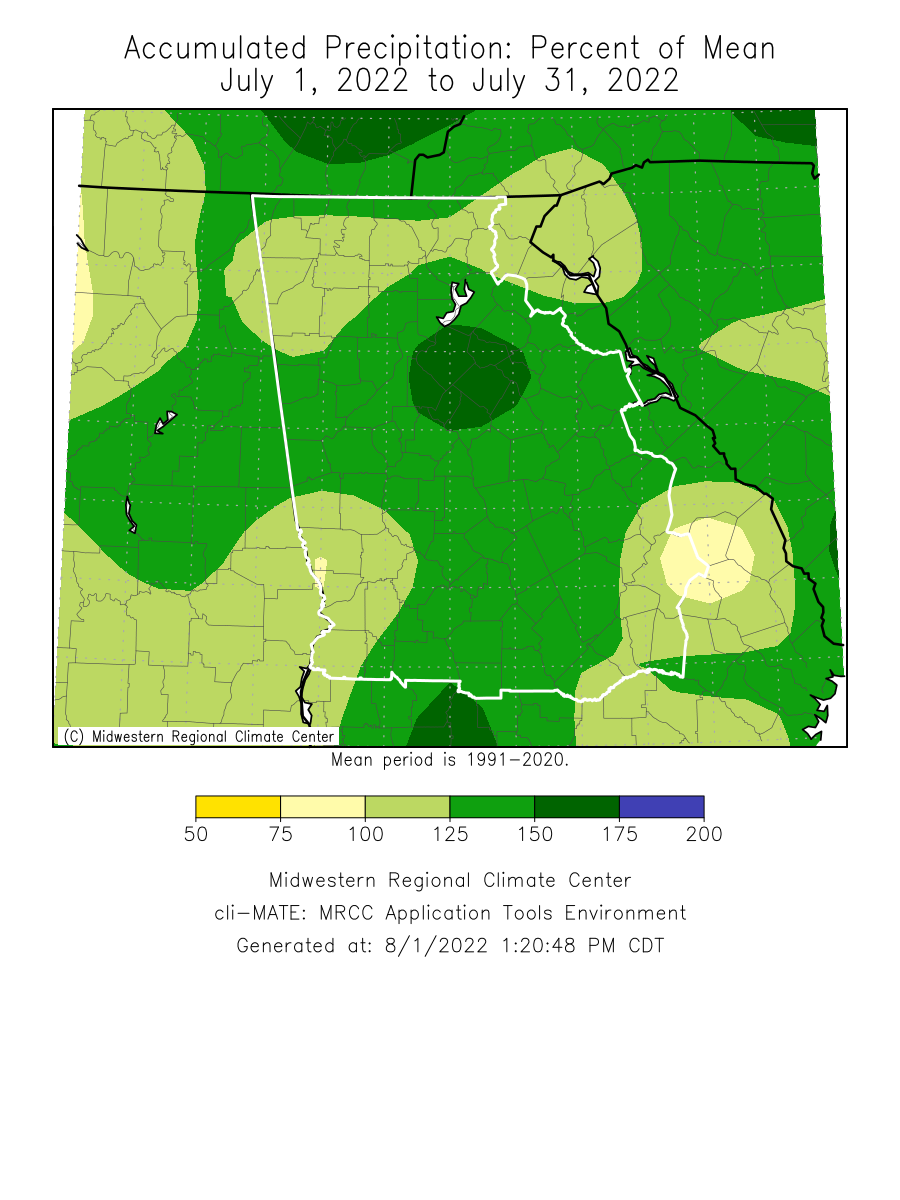
Temperatures through the month of July were around a degree above normal. Precipitation through the month of July was around half an inch above normal.
Climate Site Maximum Temperature (°F) Max T Date Climate Site Departure Climate Site Maximum Daily Precip (in inches) Max P Date Data prepared by NWS Peachtree City/Atlanta July 3rd North Georgia July 3rd: The remnants of TS Colin provided a saturated air mass south of a slow-moving front, along with a strong ocean breeze influence that impacted much of north Georgia. This allowed for diurnally-driven thunderstorms to overcome relatively modest low-level lapse rates and modest surface-based CAPE to become strong to marginally severe with a number of reports of localized water-loaded downdrafts and damaging wind gusts. July 7-8th North and Central Georgia July 7th: Thunderstorm development in the afternoon was focused largely along a surface trough south and east of the northeast Georgia mountains. This area of lift allowed for additional development along outflow boundaries, which fueled thunderstorms for the rest of the afternoon. There were numerous reports of wind damage mostly north and east of the Atlanta metro area. July 8th: Temperatures approached triple digits and precipitable water values surged to 2 inches as strong southwesterly flow picked up from the Gulf. A weak surface front from the previous day was the focus for afternoon storms to become strong to severe across most of Georgia and into western South Carolina. These storms were largely isolated in nature, but were largely water-laden causing damaging downbursts. July 19th South/Central Georgia July 19th: Diurnal thunderstorms developed into a more organized cluster ahead of a differential heating boundary over northern Georgia and Alabama. As the day progressed, this loose MCS brought with it a number of isolated wind damage events mostly across the Atlanta metro area. July 21st South/Central Georgia July 21st: A prefrontal outflow boundary was the source of strong thunderstorms that eventually developed into an MCS early in the afternoon over central Georgia. As the system moved east, it tapped into an unstable air mass across central Georgia. A number of trees were reported down or damaged in the Columbus area, but by the time the storms reached the Georgia/Alabama border the sun had set and a majority of the instability had waned and most of the cluster was largely sub-severe. Based on the Climate Prediction Center's outlook for August, Georgia has a 40% to 50% chance for above normal temperatures. For precipitation, most of Georgia has an equal chance for above or below normal precipitation, while northeastern Georgia has a 33%-40% chance for above normal precipitation. Data prepared by NWS Peachtree City/Atlanta
Overview
Climate Graphics
Records
Events
August Outlook
Below are the overview stats for July 2022 for our 10 climate sites.
July 2022 Climate Averages
Climate Site
July Temp (°F)
Average Temp (°F)
Departure from normal
81.8
81.0
0.8
81.6
80.9
0.7
82.8
83.2
-0.4
82.8
82.5
0.3
81.0
78.8
2.2
80.7
79.6
1.1
81.2
80.1
1.1
80.6
78.8
1.8
81.7
80.8
0.9
82.8
80.2
2.6
July 2022 Temperature Climate Statistics
Minimum Temperature (°F)
Min T Date
Athens
98
7/8
69
7/11, 15
Atlanta
94
7/8, 9
69
7/16
Columbus
98
7/7, 8
70
7/22
Macon
97
7/4, 7
70
7/23, 31
Cartersville
95
7/8, 16
66
7/15
Dekalb Peachtree Arpt
96
7/3, 8
67
7/15
Fulton Co Arpt
95
7/8
68
7/15
Gainesville
96
7/8
68
7/15, 21
Peachtree City
96
7/8
69
7/15, 16
Rome
99
7/6, 8
67
7/15
July 2022 Precipitation Climate Statistics
Total Precipitation
(in inches)
Average Precipitation
(in inches)
From Normal
7.20
4.20
3.00
4.17
4.75
-0.58
3.19
4.35
-1.16
5.53
4.79
0.74
11.23
3.88
7.35
9.26
4.71
4.55
4.59
5.04
-0.45
6.52
4.42
2.10
1.27
4.84
-3.57
3.29
3.74
-0.45
July 2022 Precipitation Climate Statistics
Athens
2.08
7/30
Atlanta
1.84
7/5
Columbus
0.75
7/13
Macon
1.48
7/4
Cartersville
2.33
7/1
Dekalb Peachtree Arpt
3.82
7/29
Fulton Co Arpt
1.15
7/19
Gainesville
1.85
7/3
Peachtree City
0.44
7/18
Rome
1.11
7/29
Click the links below to explore the temperature and precipitation data across north and central Georgia for the month of July 2022.
Temperature Maps
Precipitation Maps
Temperature Graphs
Precipitation Graphs


Temperature and precipitation records at our 4 main climate sites are located below.
July 2022 Climate Records
No Records were broken during the month of July
Larger events that occurred across north and central Georgia this past July can be found here.
The August climate outlook is below.
August Outlook