| Previous Month | Next Month |
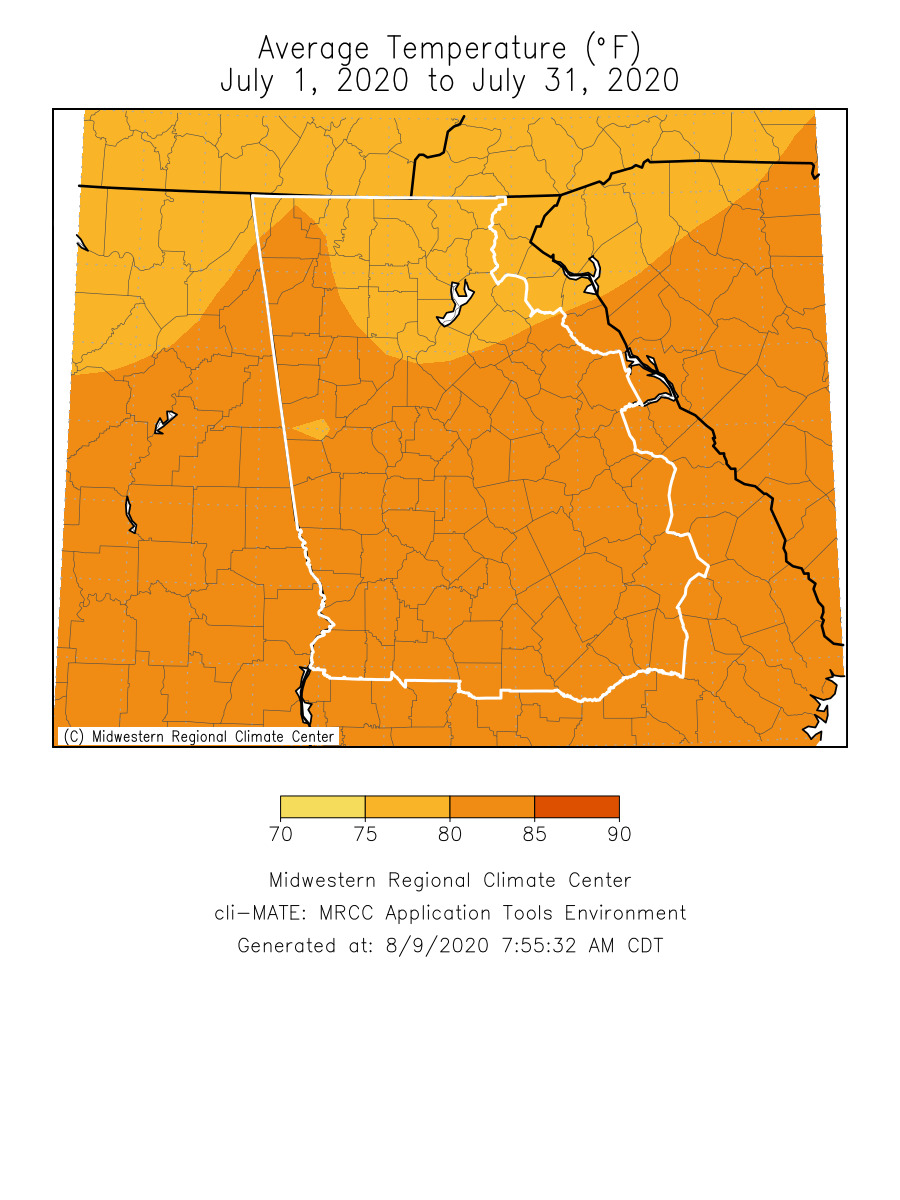
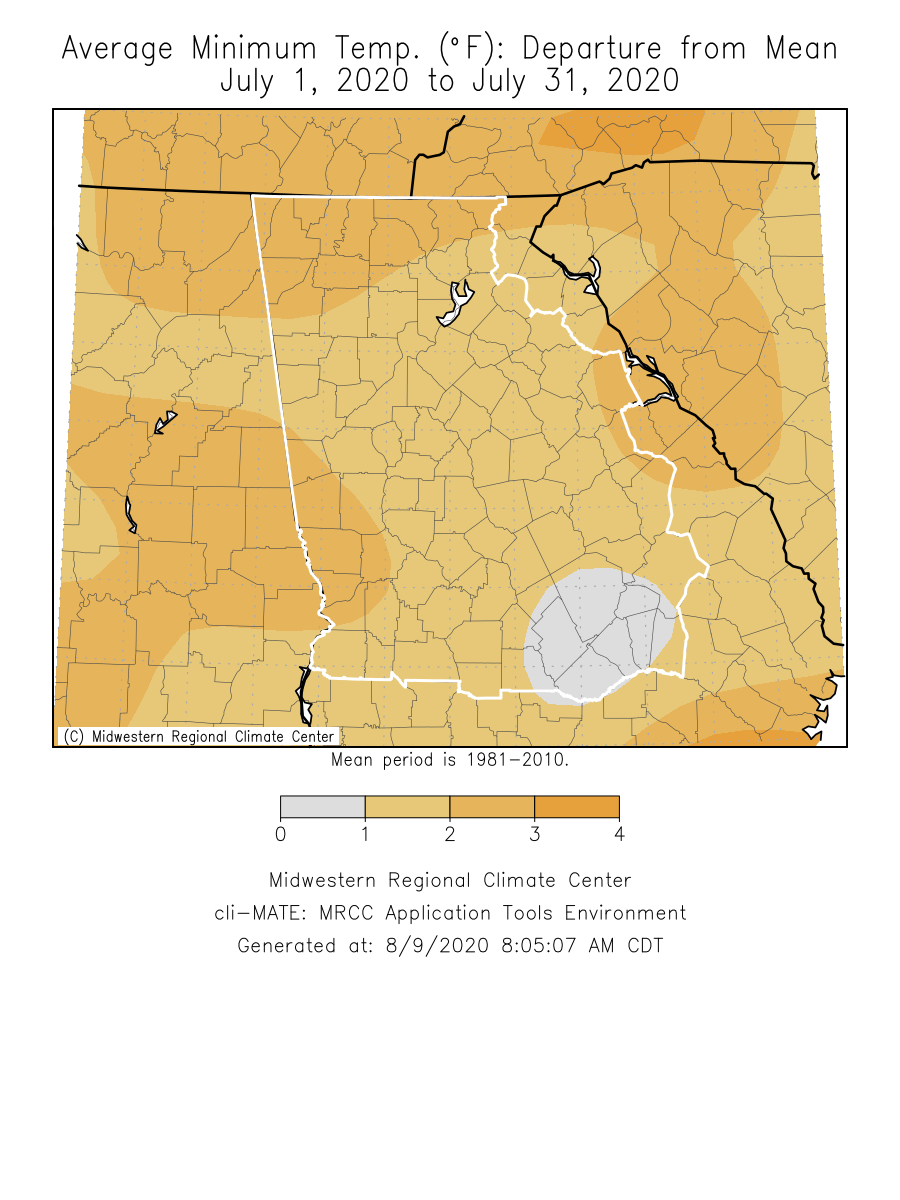
Temperatures through the month of July were around 0 to 2 degrees warmer than normal. Precipitation through the month of July was around 0 to 2.5 inches below normal.
*Indicates a daily record was set *Indicates a daily record was set; BOLD indicates an all time August record Data prepared by NWS Peachtree City/Atlanta. Here is a visual summary of all the warnings and local storm reports issued across portions of northern and central Georgia in July 2020. Based on the Climate Prediction Center's outlook for August, all of north and central Georgia has equal chances of above normal, normal, or below normal temperatures. For precipitation, western Georgia has equal chances of above normal, normal, or below normal precipitation and eastern Georgia has a 33% to 40% chance of above normal precipitation. Data prepared by NWS Peachtree City/Atlanta.
Overview
Climate Graphs
Records
Events
August Outlook
Below are the overview stats from July 2020 for our 10 climate sites.
July 2020 Temperature Climate Statistics
Climate Site
Average Temperature
Normal Temperature
DFN (Departure
From Normal)
83.1
80.6
+2.5
82.1
80.2
+1.9
83.7
82.5
+1.2
83.6
81.8
+1.8
81.8
78.3
+3.5
80.6
79.8
+0.8
80.8
79.8
+1.0
80.4
78.8
+1.6
80.7
79.3
+1.4
82.3
79.4
+2.9
July 2020 Temperature Climate Statistics
Climate Site
Maximum Temperature
Max T Date
Minimum Temperature
Min T Date
Athens
102
7/20
67
7/12
Atlanta
95
7/18,7/19,7/20,7/21
68
7/13
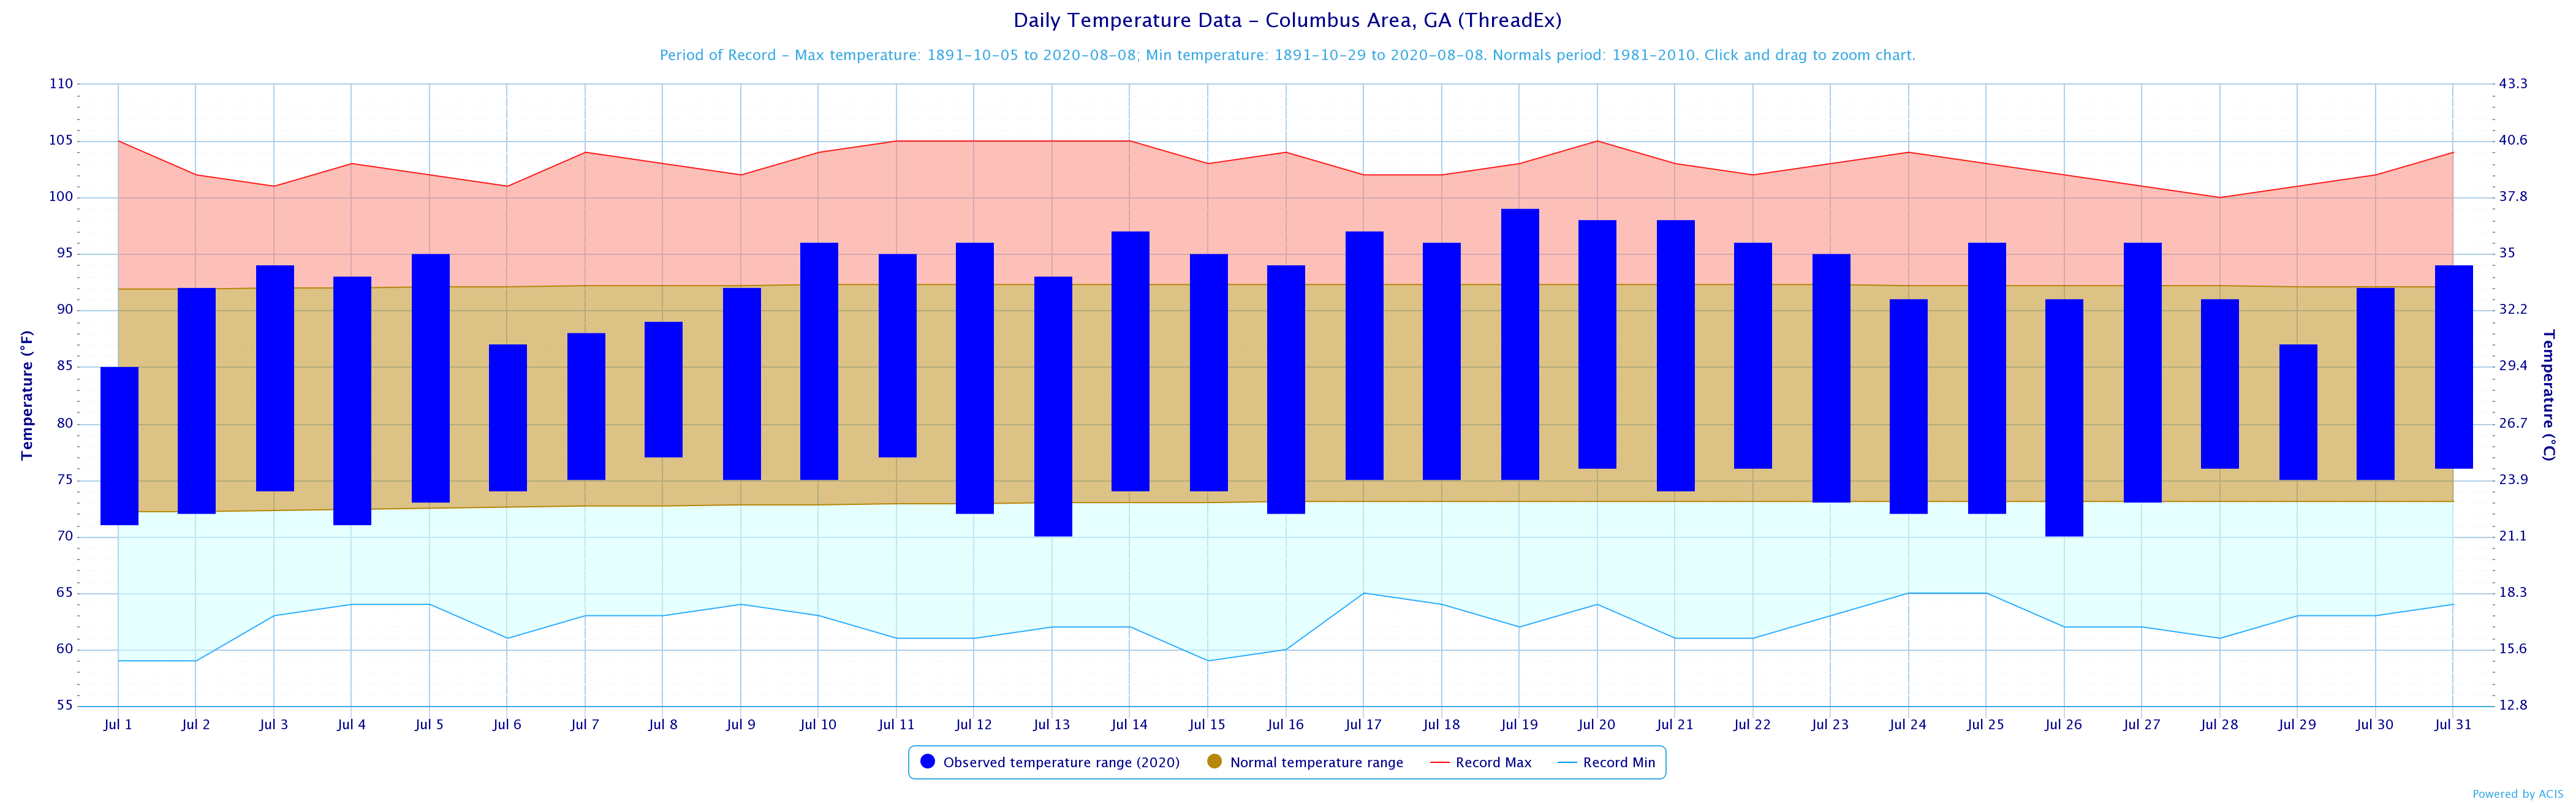
Columbus
99
7/19
70
7/13,7/26
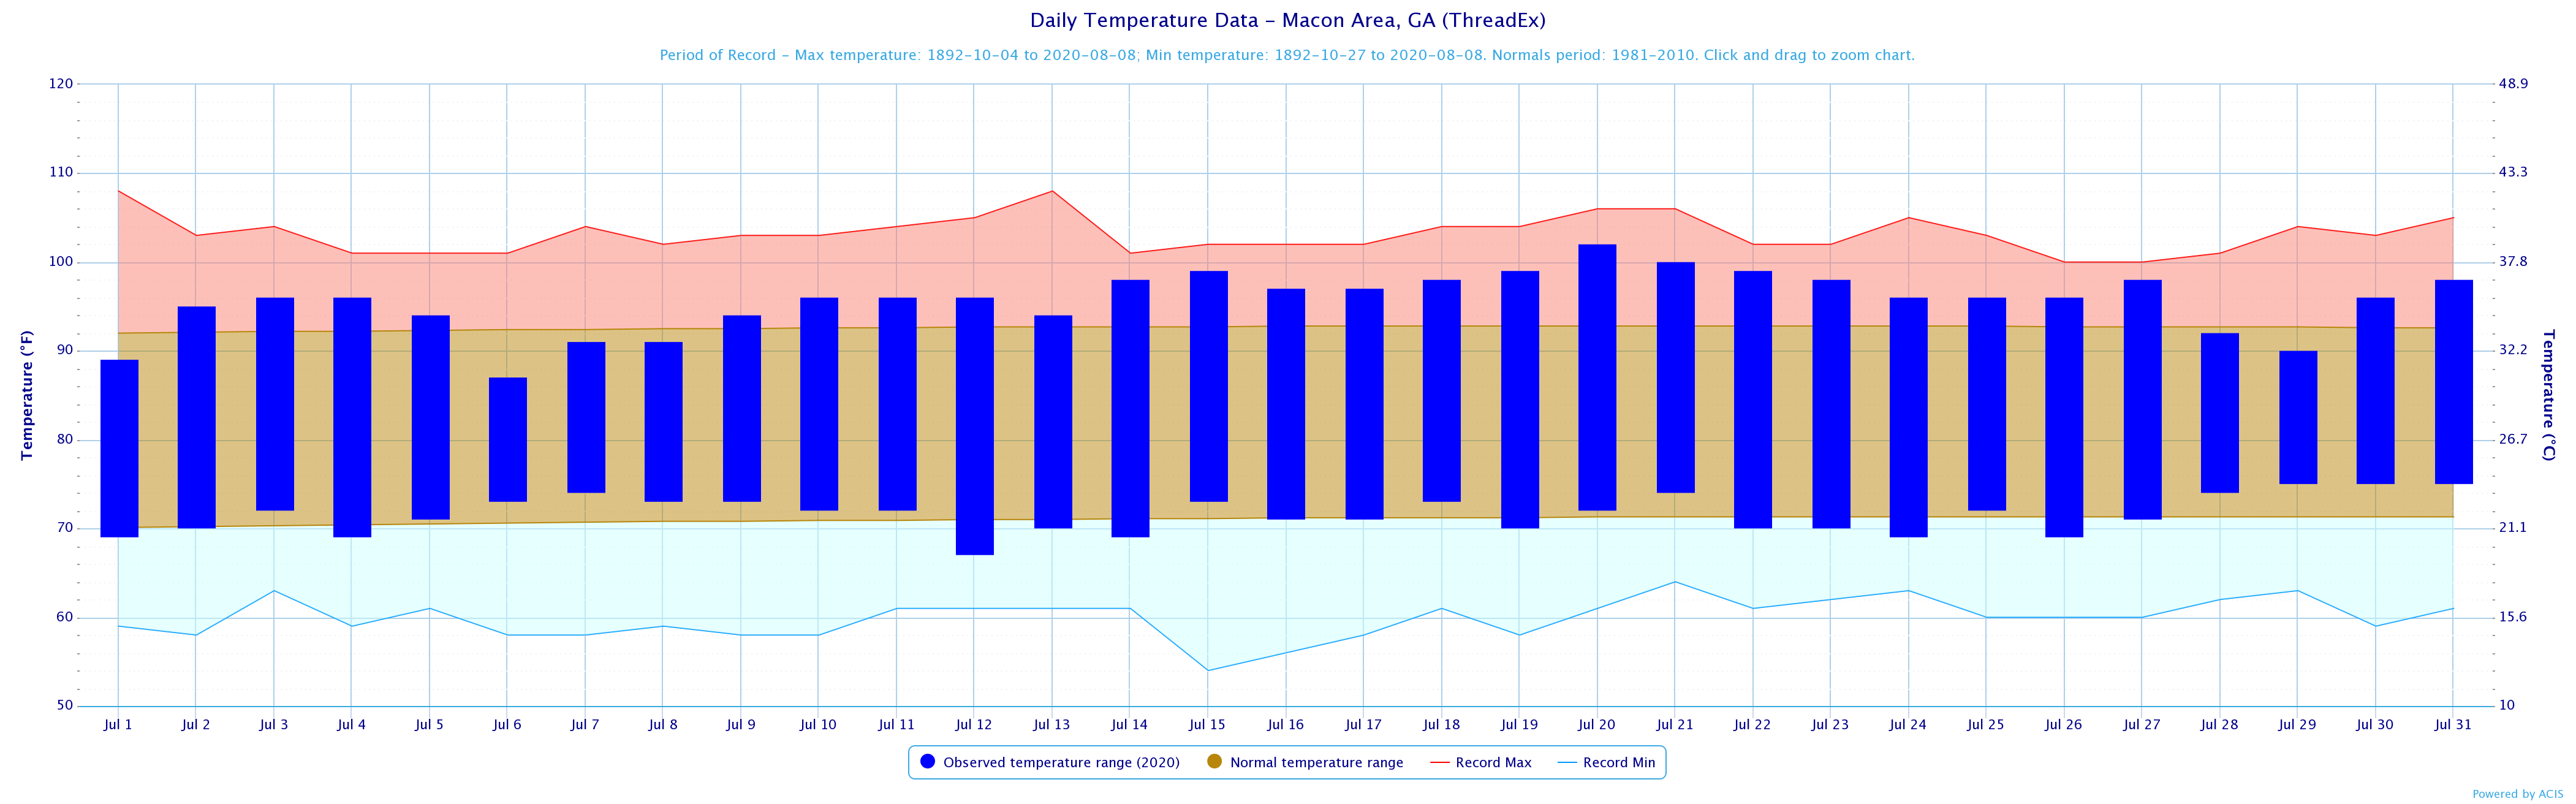
Macon
102
7/20
67
7/12
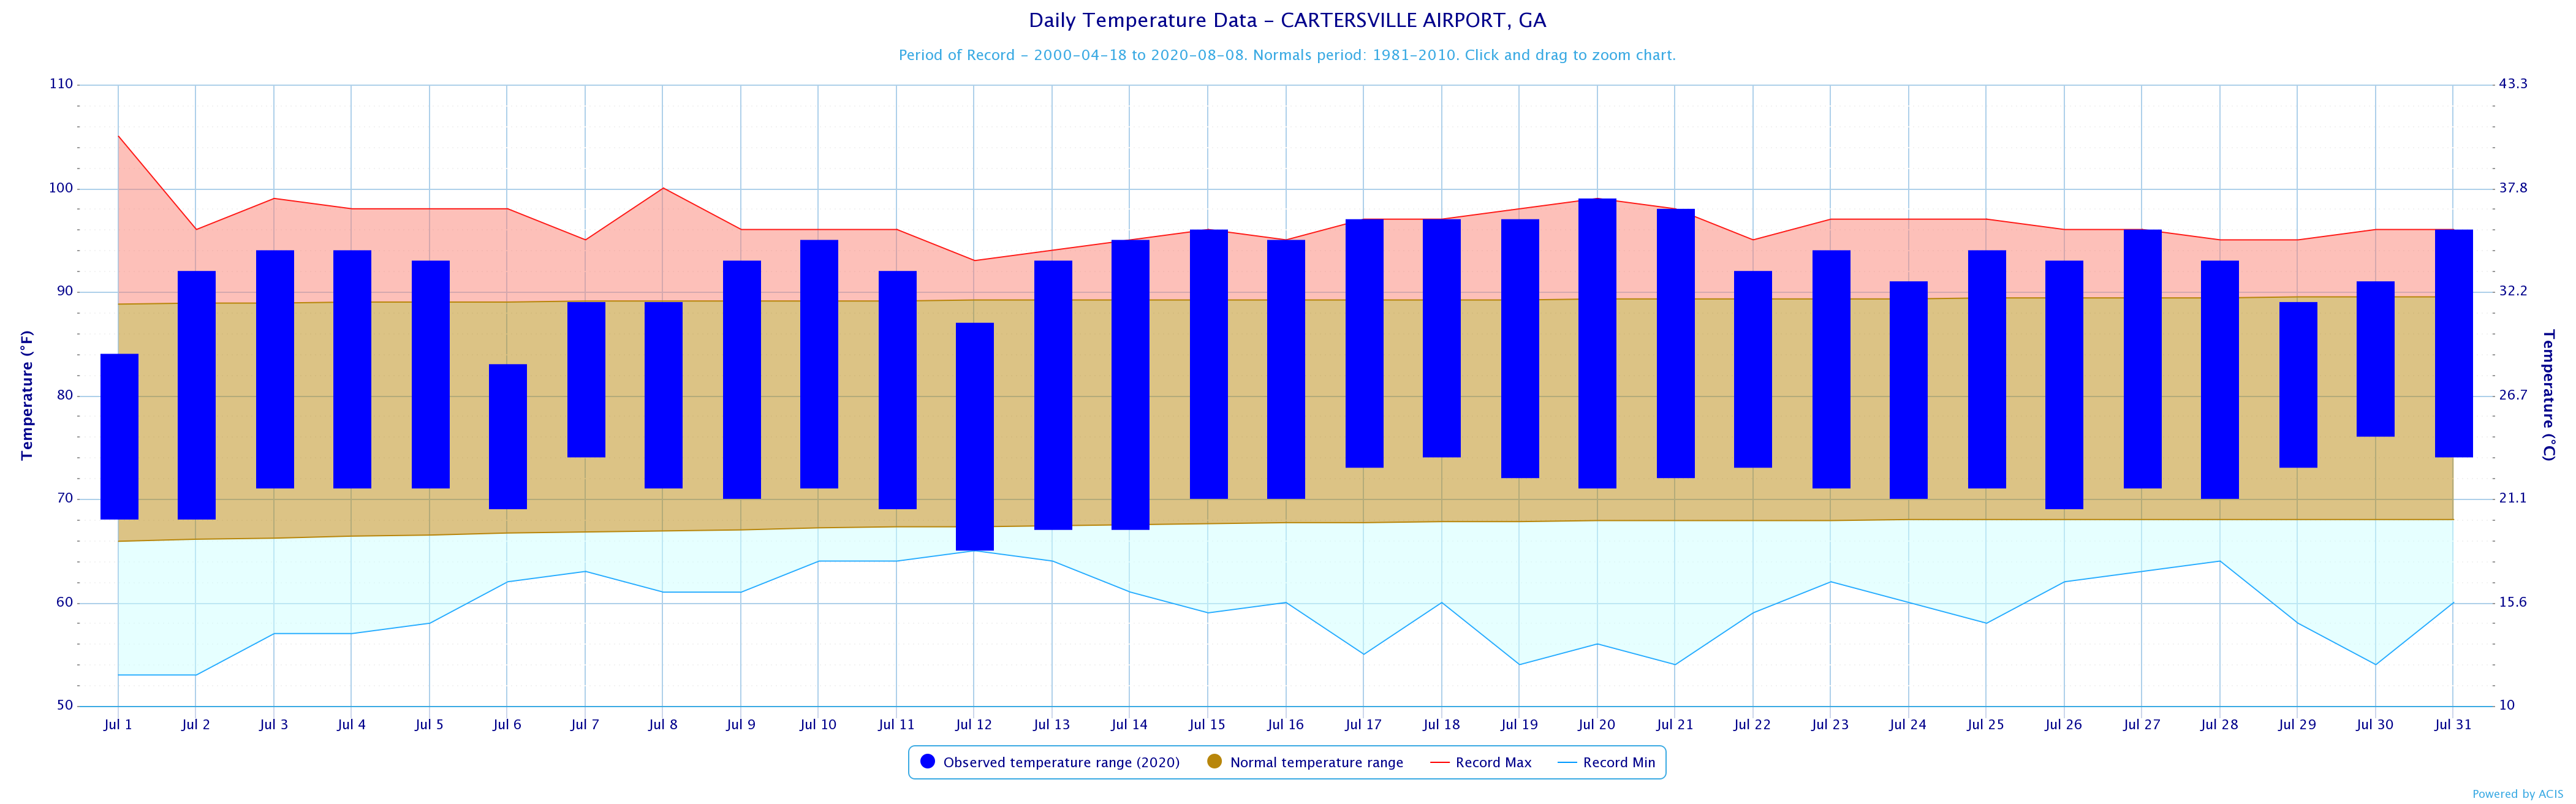
Cartersville
99
7/20*
65
7/12*
Dekalb Peachtree Arpt
96
7/20
65
7/12
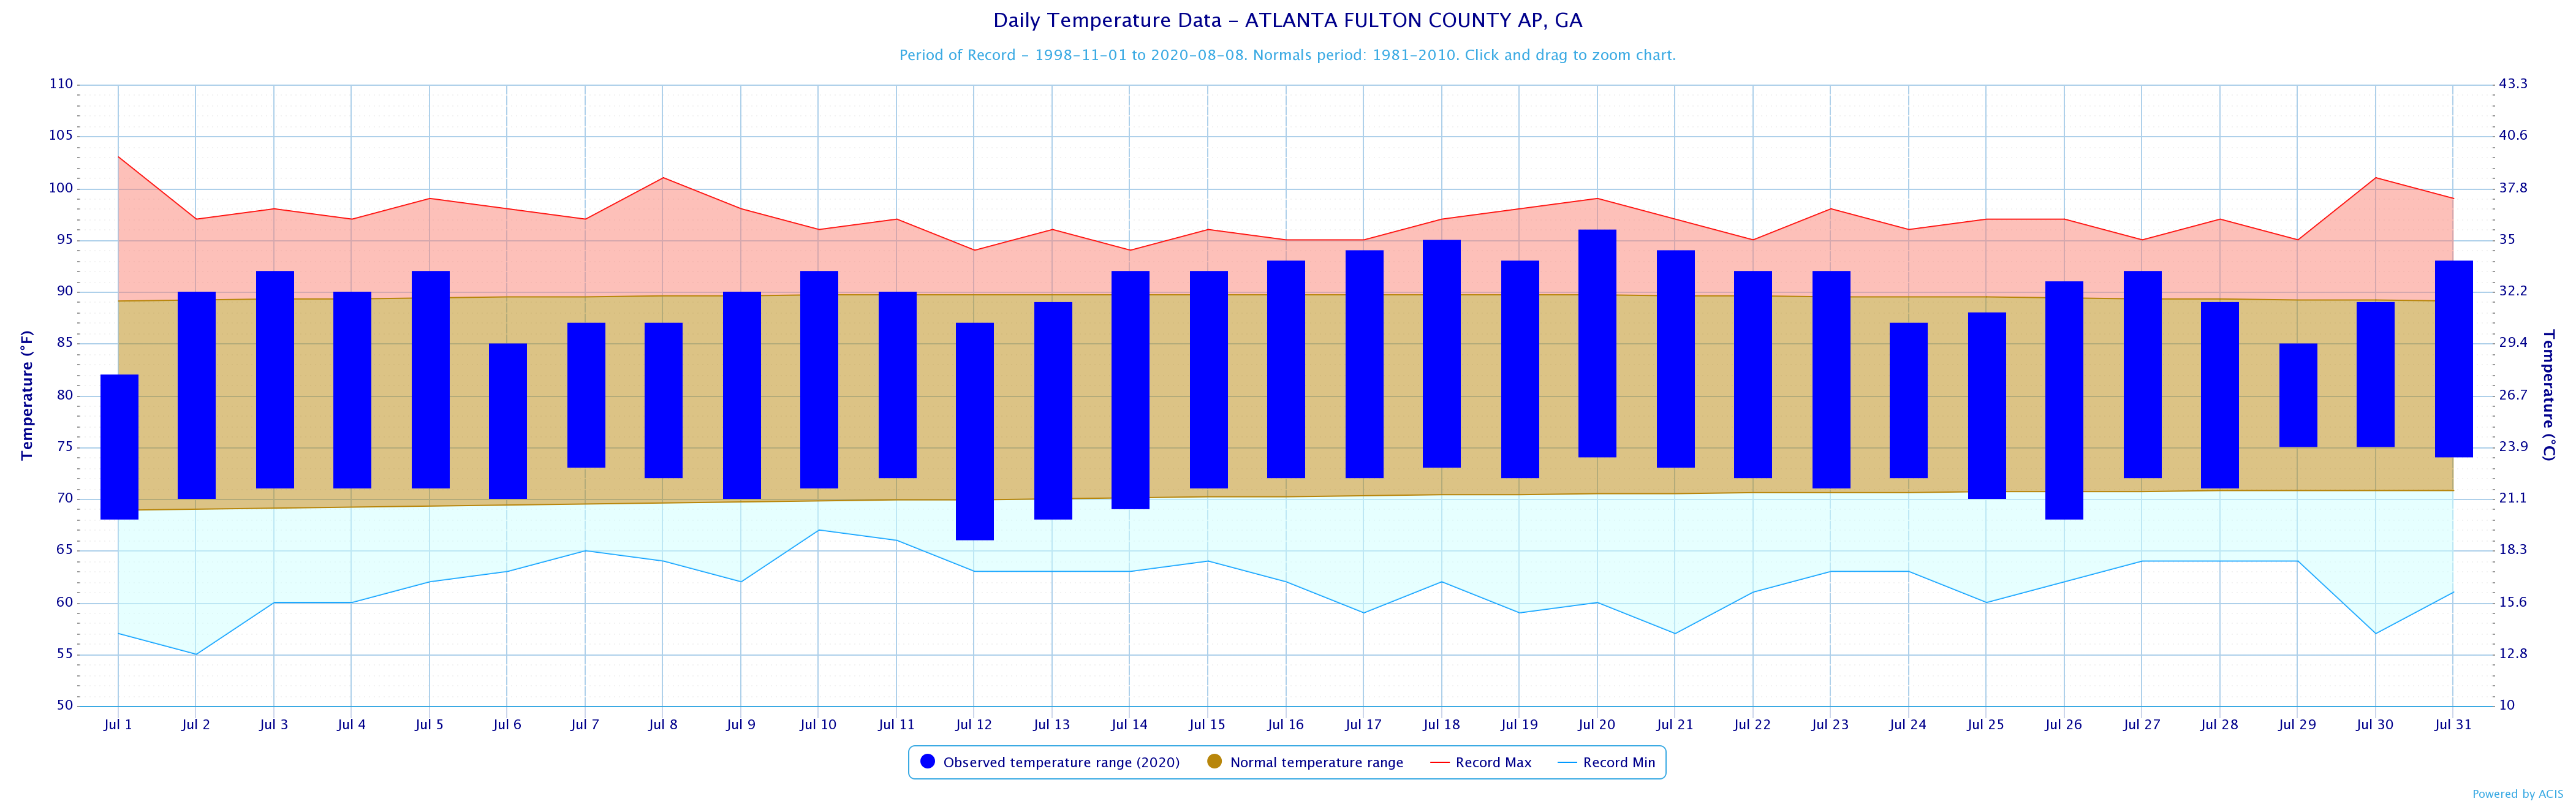
Fulton Co Arpt
96
7/20
66
7/12
Gainesville
95
7/17*,7/18,7/20
66
7/12
Peactree City
96
7/20
64
7/12
Rome
99
7/17,7/19,7/20*
66
7/12,7/13
July 2020 Precipitation Climate Statistics
Climate Site
Total Precipitation
Normal Precipitation
DFN (Departure
From Normal)
1.90
4.47
-2.57
2.60
5.27
-2.67
3.49
4.76
-1.27
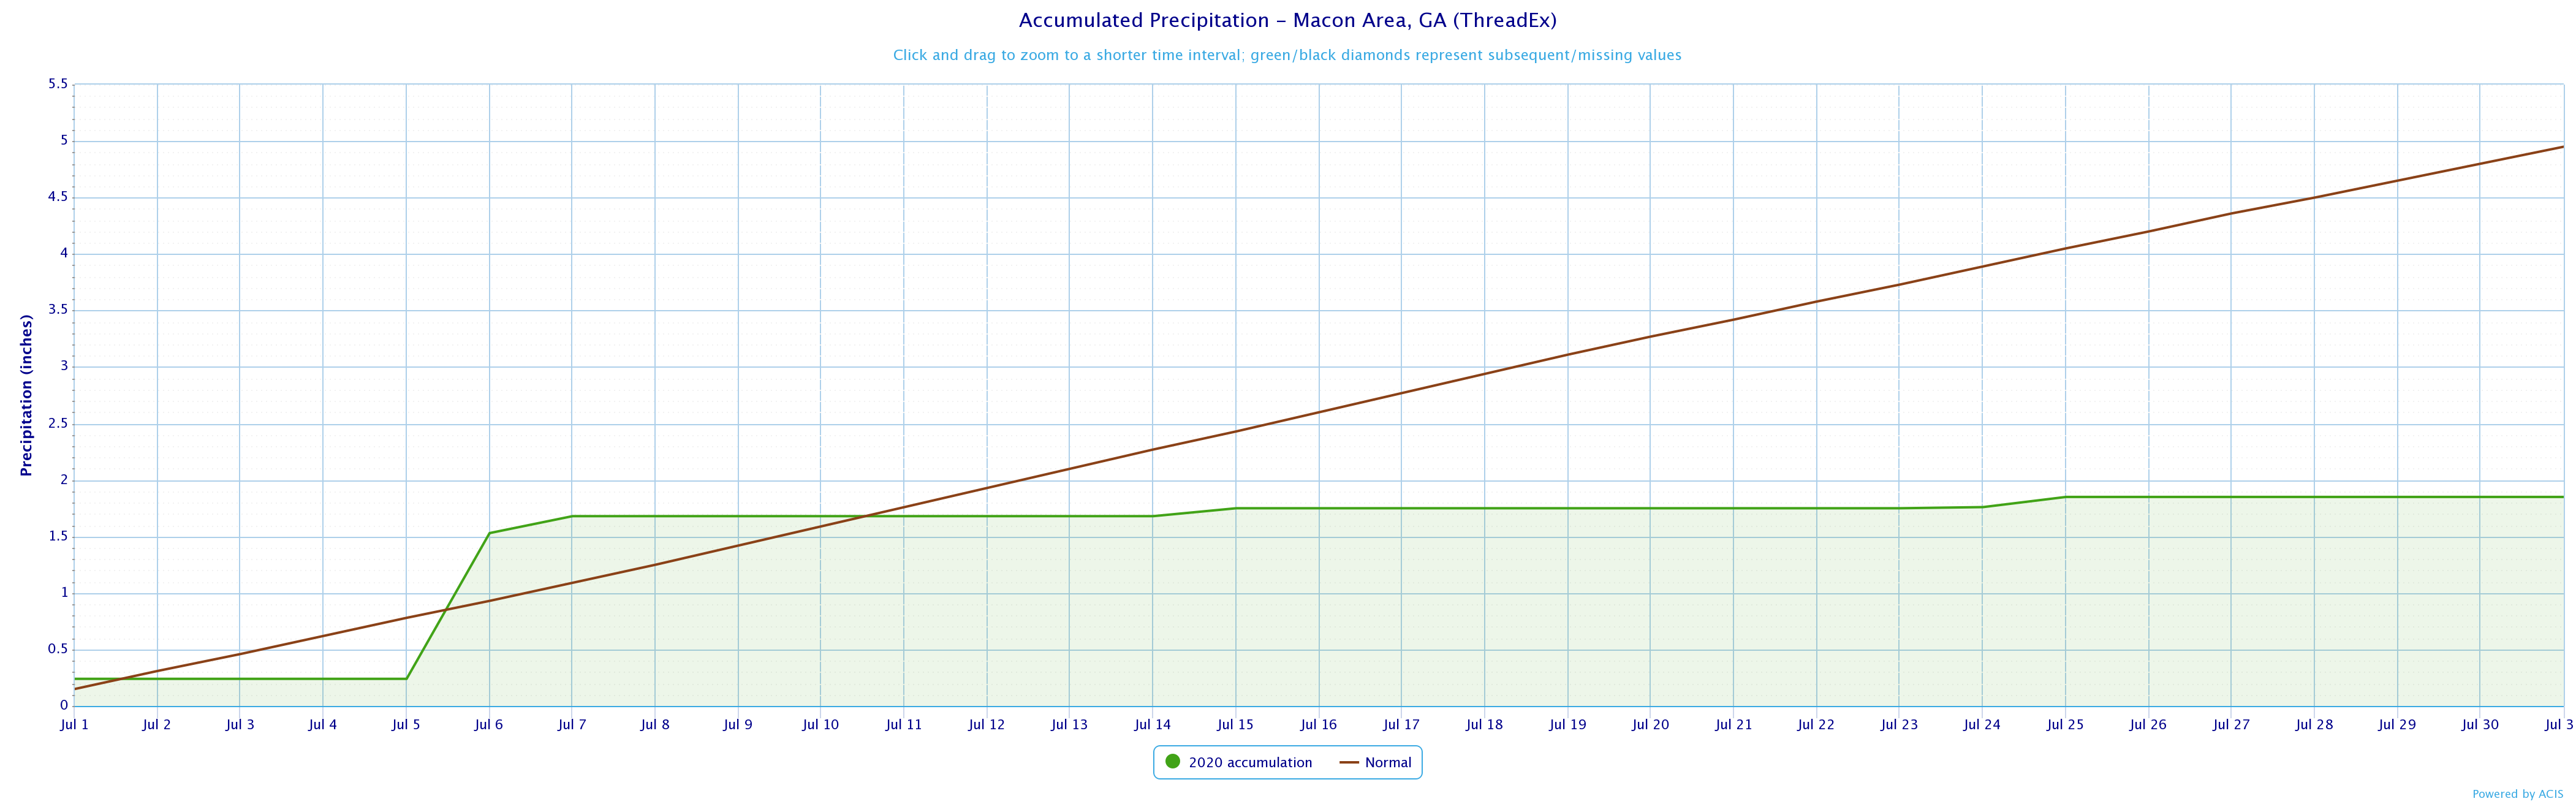
1.85
4.95
-3.10
1.50
4.66
-3.16
5.03
5.02
+0.01
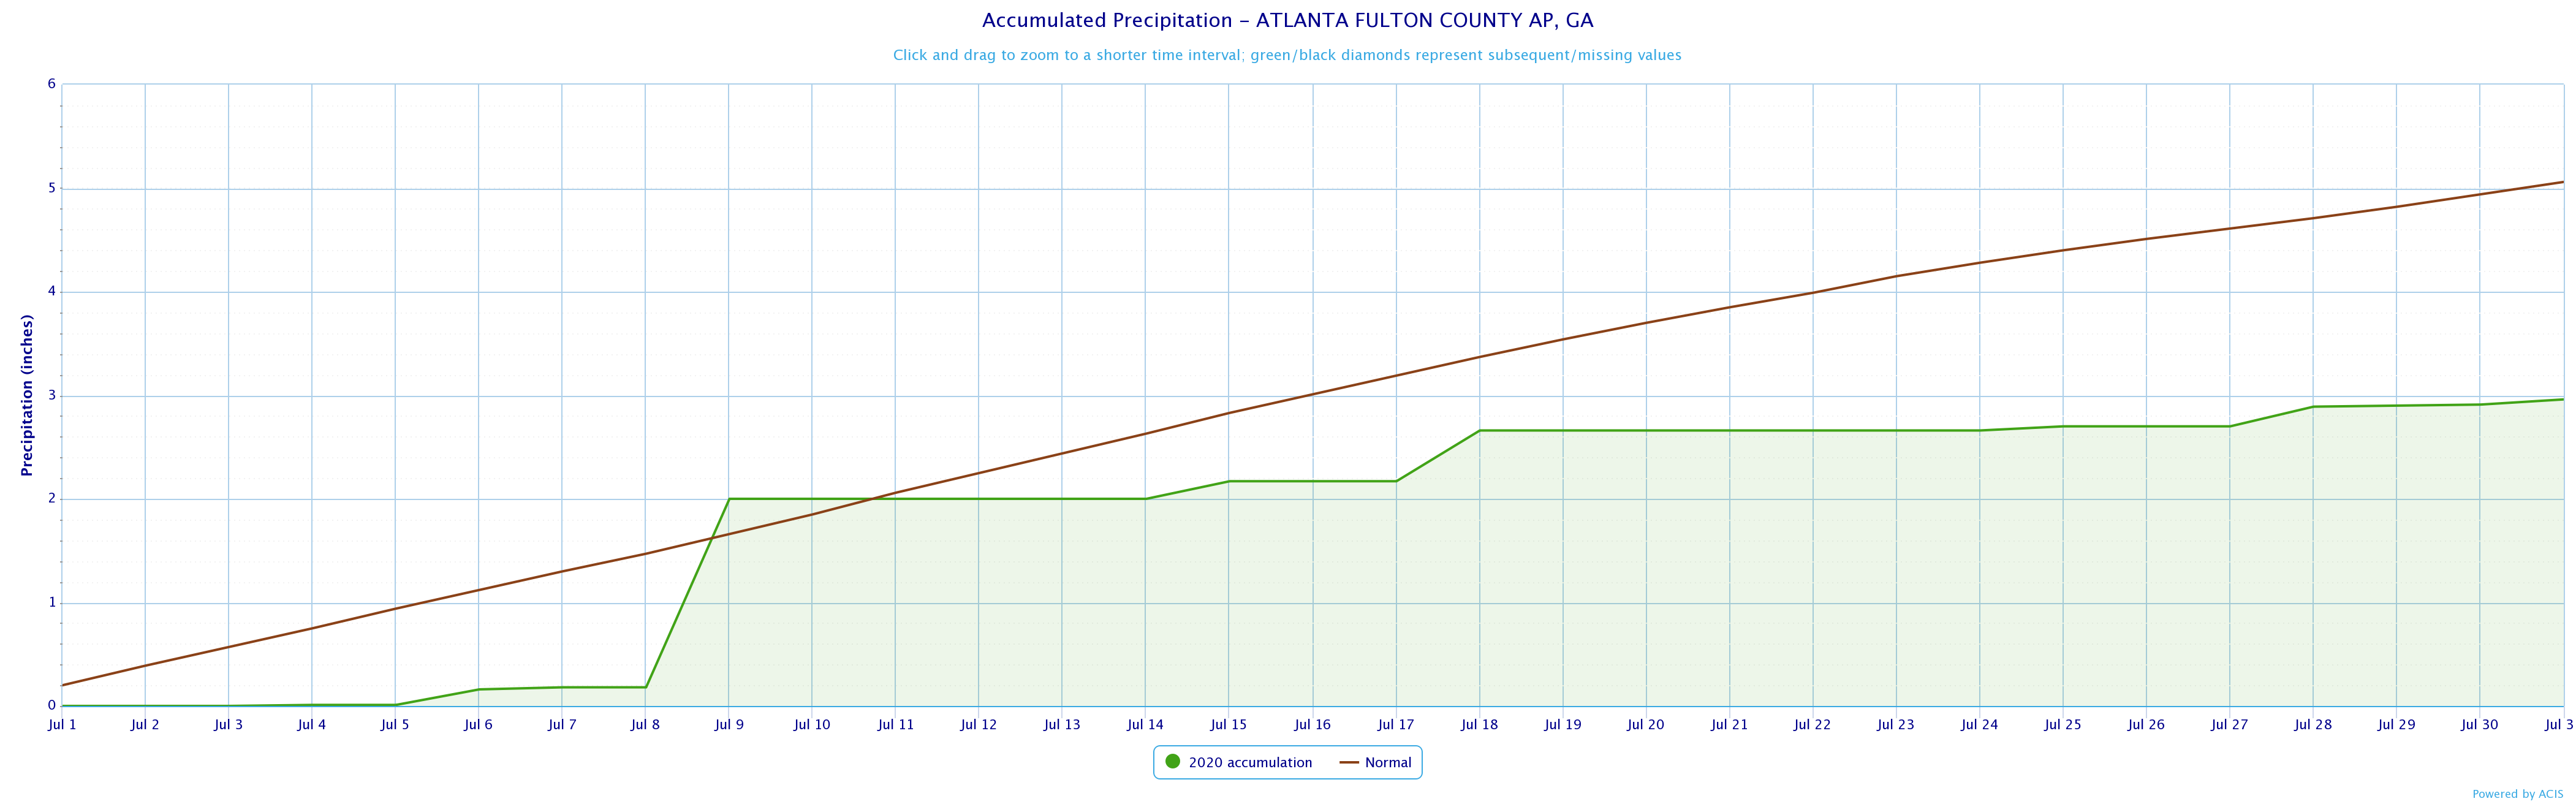
2.96
5.06
-2.10
4.13
4.51
-0.38
3.22
5.26
-2.04
2.42
4.32
-1.90
July 2020 Precipitation Climate Statistics
Climate Site
Maximum Daily Precip
Max P Date
Athens
1.26
7/6
Atlanta
1.21
7/6
Columbus
1.96
7/25
Macon
1.29
7/6
Cartersville
0.53
7/21
Dekalb Peachtree Arpt
2.08
7/21*
Fulton Co Arpt
1.82
7/9
Gainesville
1.71
7/31
Peachtree City
1.09
7/25
Rome
1.64
7/25
Click the links below to explore the temperature and precipitation data across north and central Georgia for the month of July 2020.
Temperature Maps
Precipitation Maps
Temperature Graphs
Precipitation Graphs


.png)


Temperature and precipitation records at our 4 main climate sites are located below.
July 2020 Climate Records
Date
Type
Location
Record
7/18
Highest Min Temp
Athens
A minimum temperature of 77 degrees was reached. This breaks the previous record of 76 degrees, last set in 2015.
Larger events that occurred across north and central Georgia this past July can be found here.
July 2020 Warnings and Local Storm Reports

The August climate outlook is below.


