| Previous Month | Next Month |
|
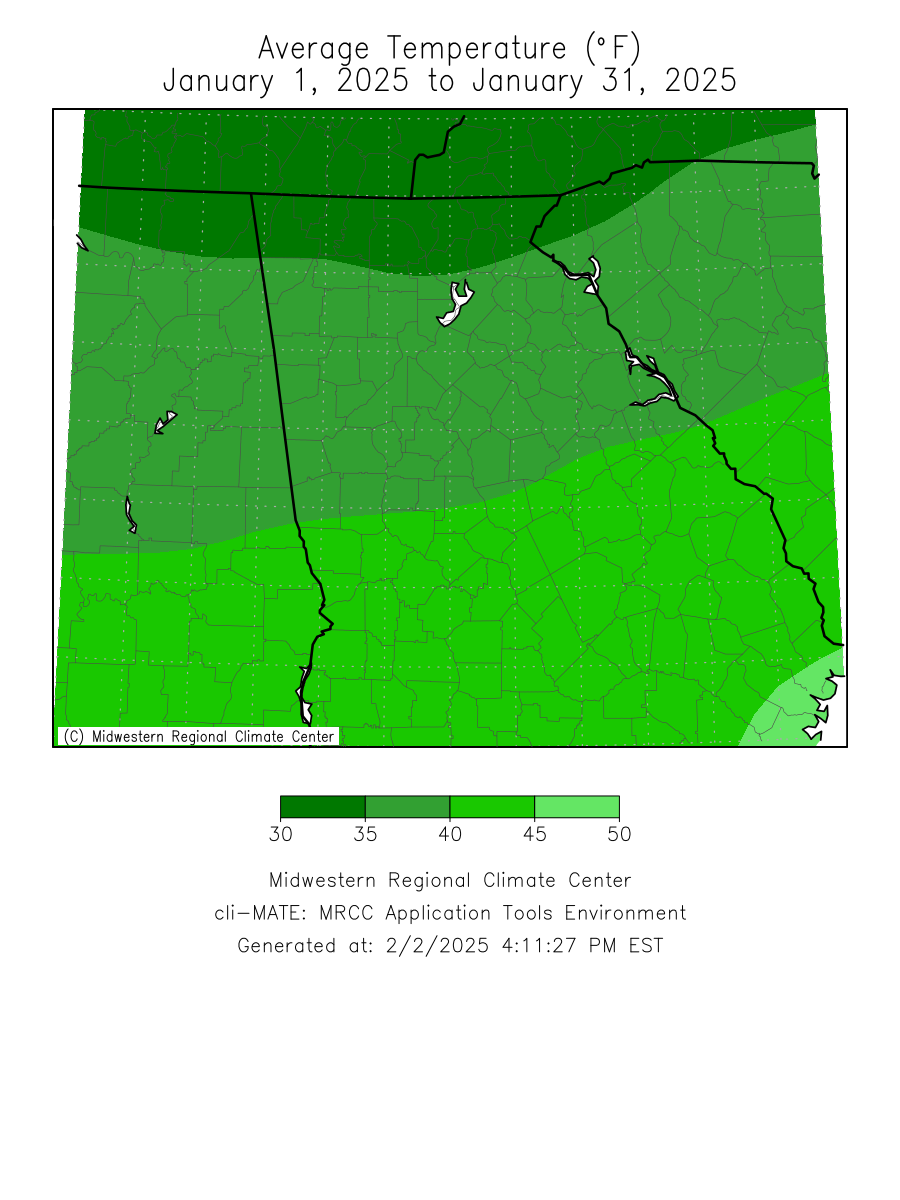
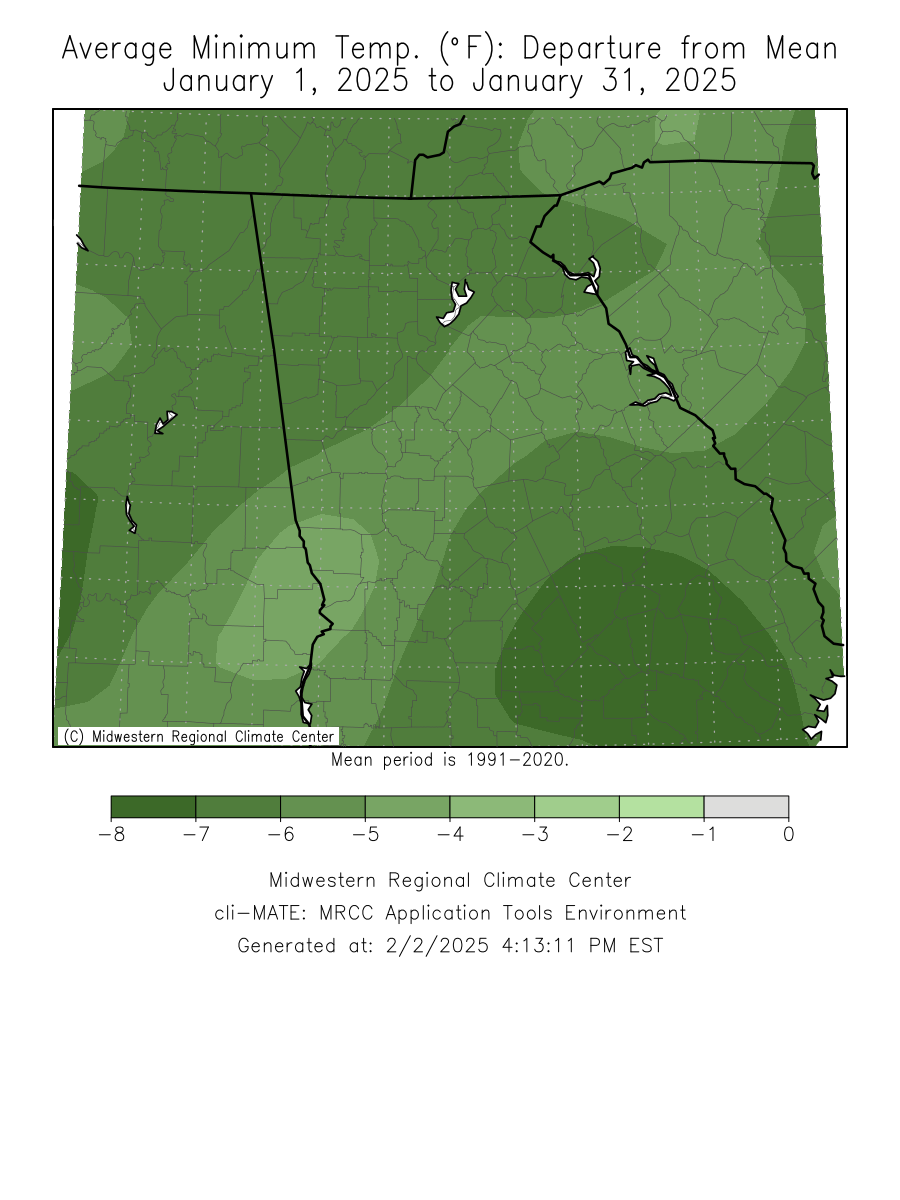
January 2025 Climate Averages
|
|||
|
Climate Site
|
Jan Temp (°F)
|
Average Temp
|
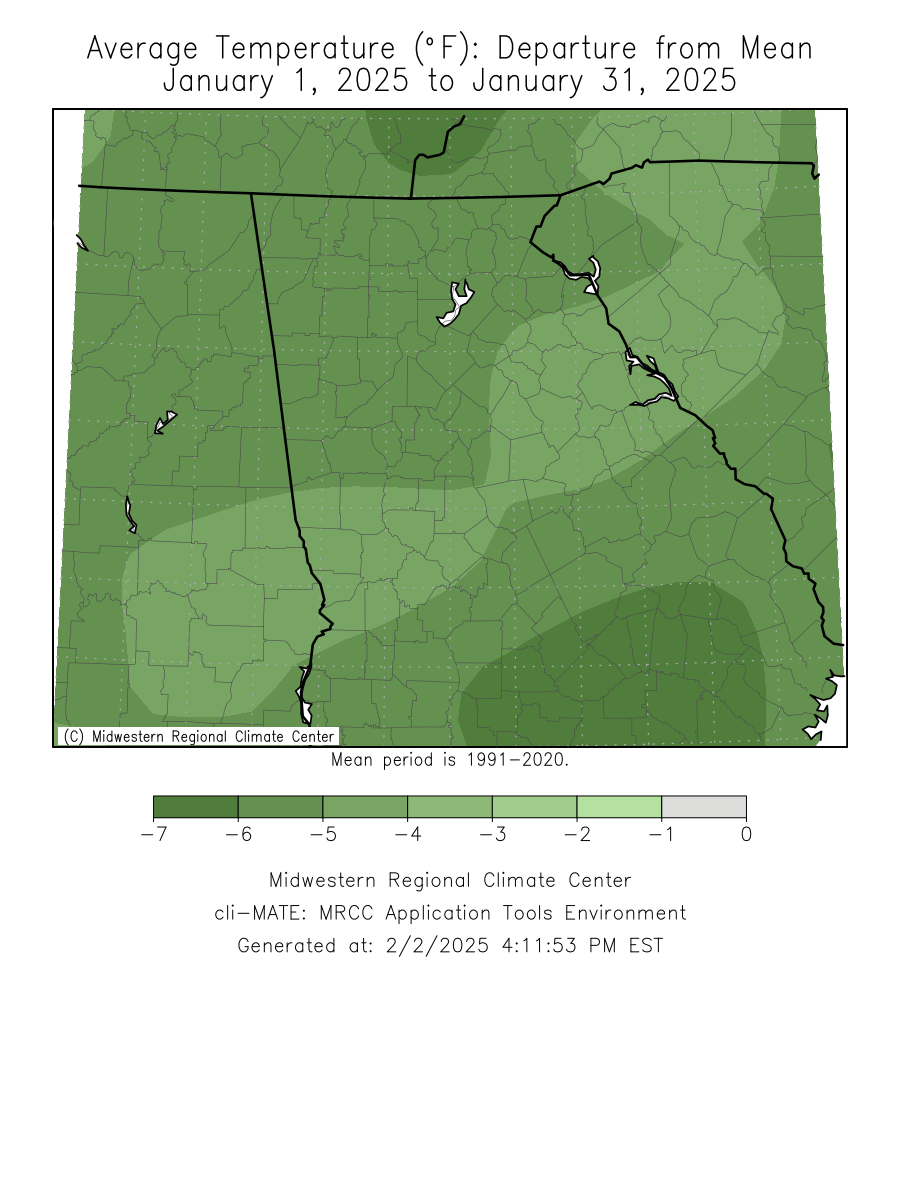
Departure from Normal
|
|
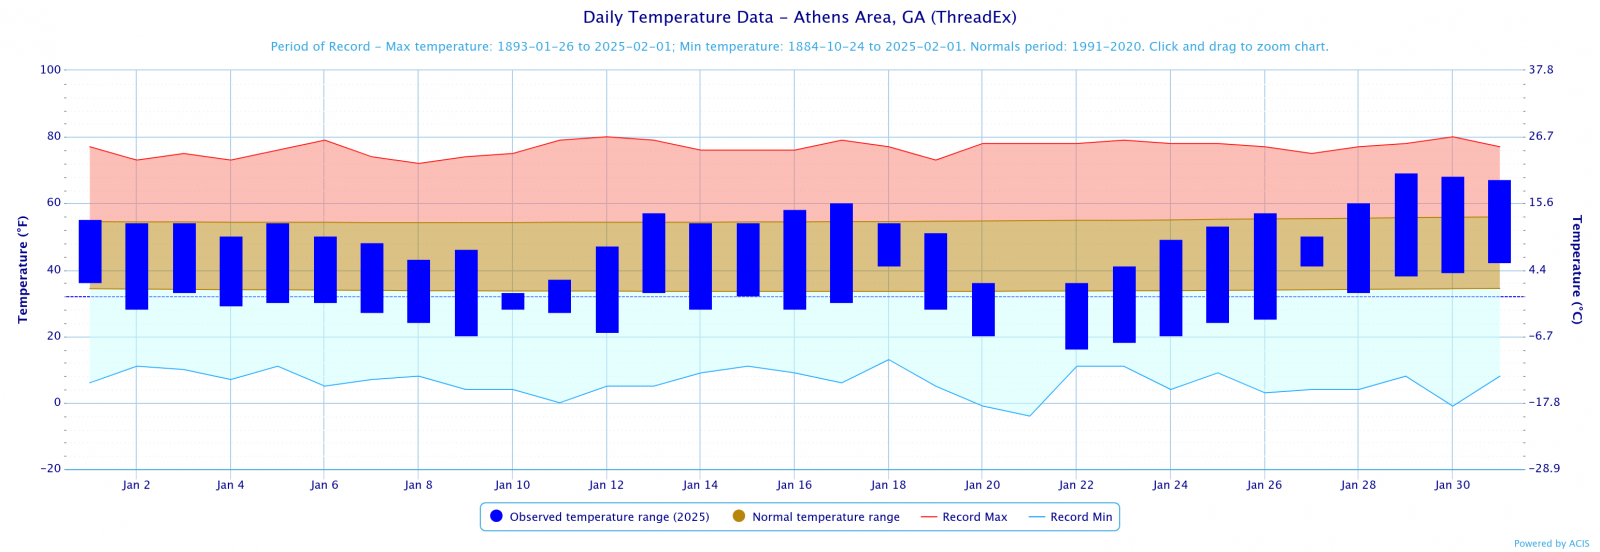
Athens
|
39.9
|
44.3
|
-4.4
|
|
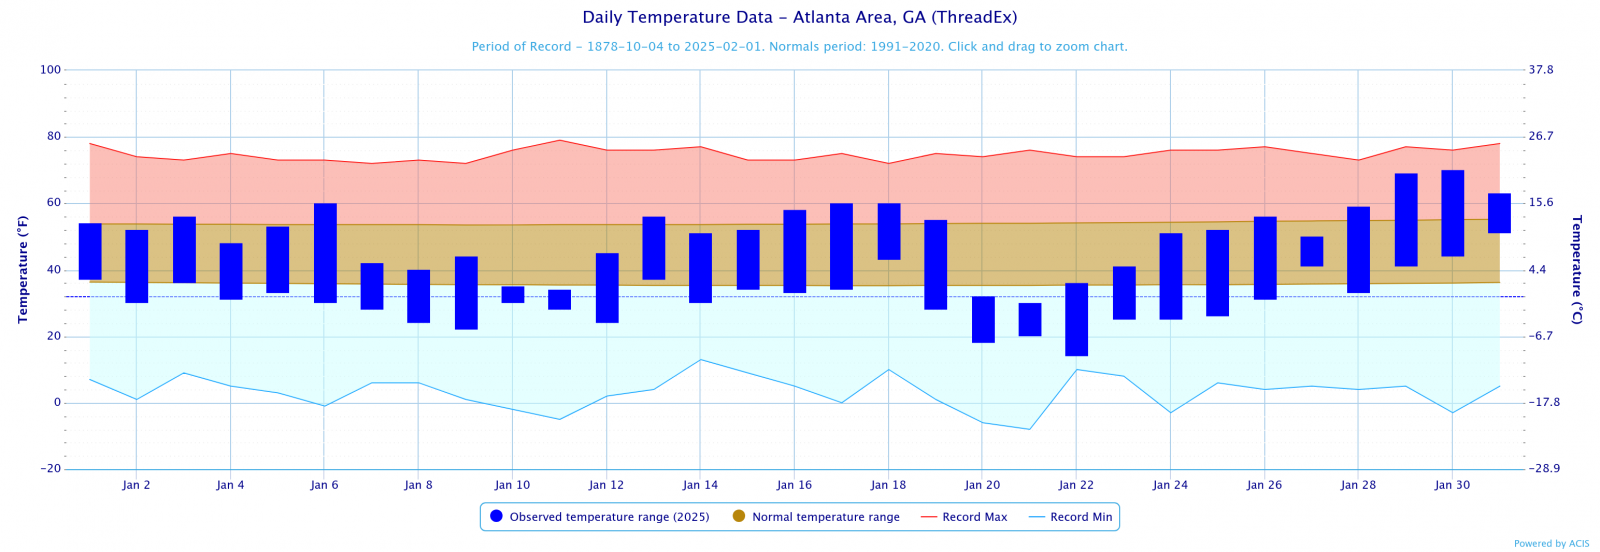
Atlanta
|
40.7
|
44.8
|
-4.1
|
|
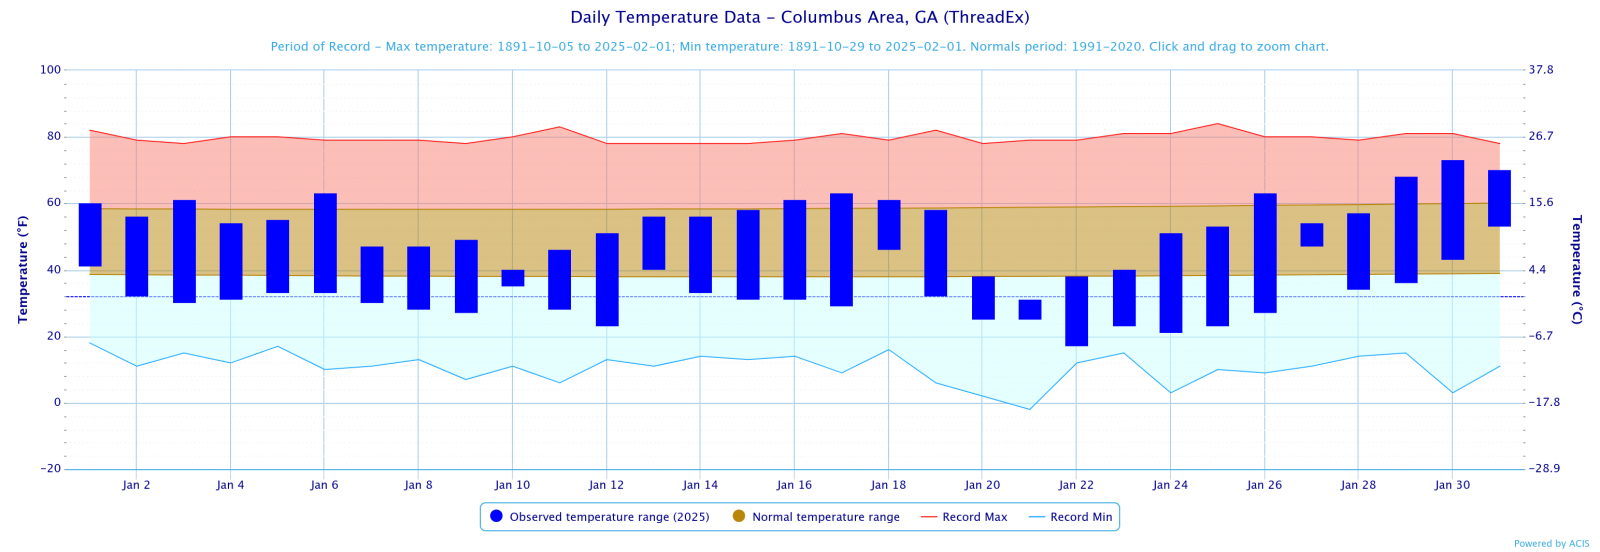
Columbus
|
43.0
|
48.5
|
-5.5
|
|
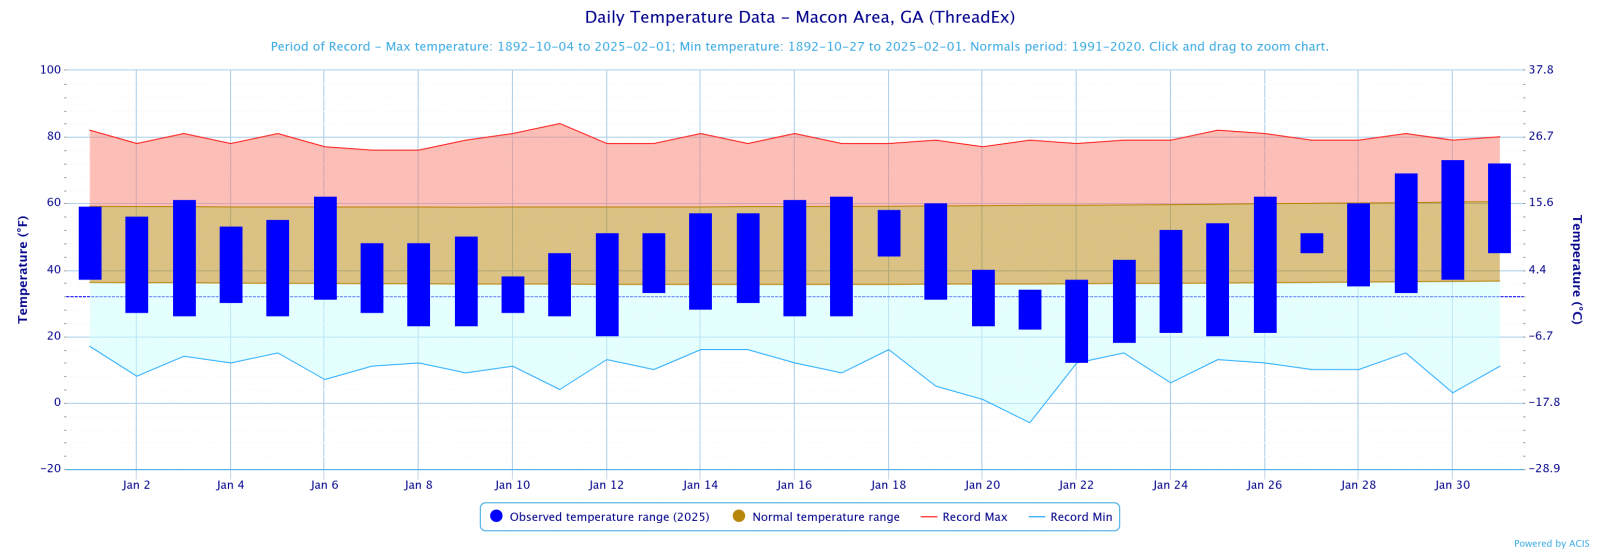
Macon
|
41.2
|
47.6
|
-6.4
|
|
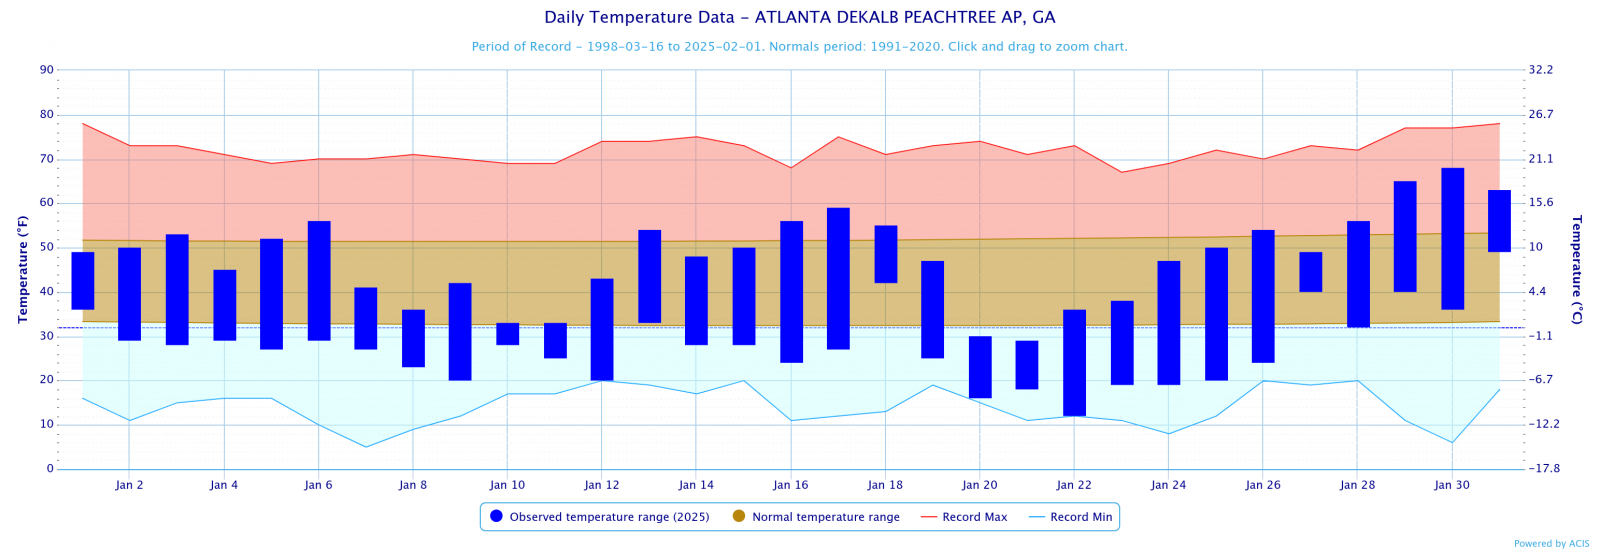
Dekalb Peachtree Arpt
|
37.7
|
42.3
|
-4.6
|
|
Fulton Co Arpt
|
38.7
|
43.6
|
-4.9
|
|
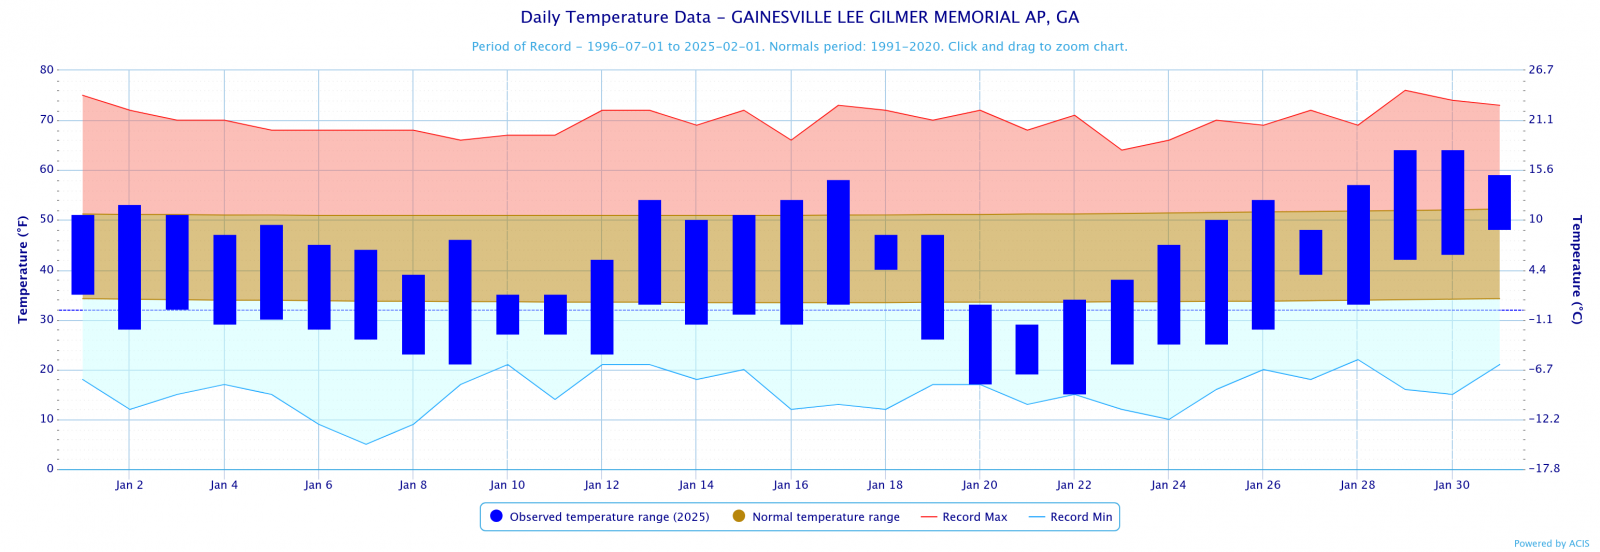
Gainesville
|
38.4
|
42.4
|
-4.0
|
|
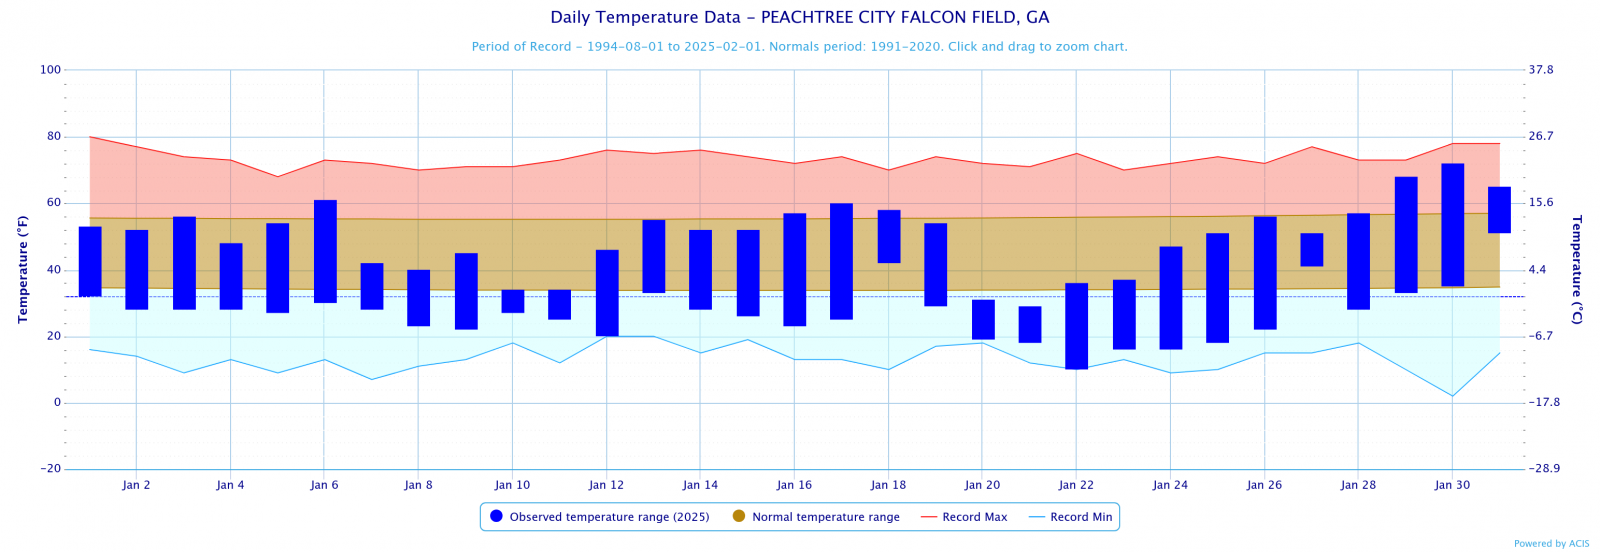
Peachtree City
|
38.5
|
44.9
|
-6.4
|
|
Rome
|
37.4
|
42.3
|
-4.9
|
|
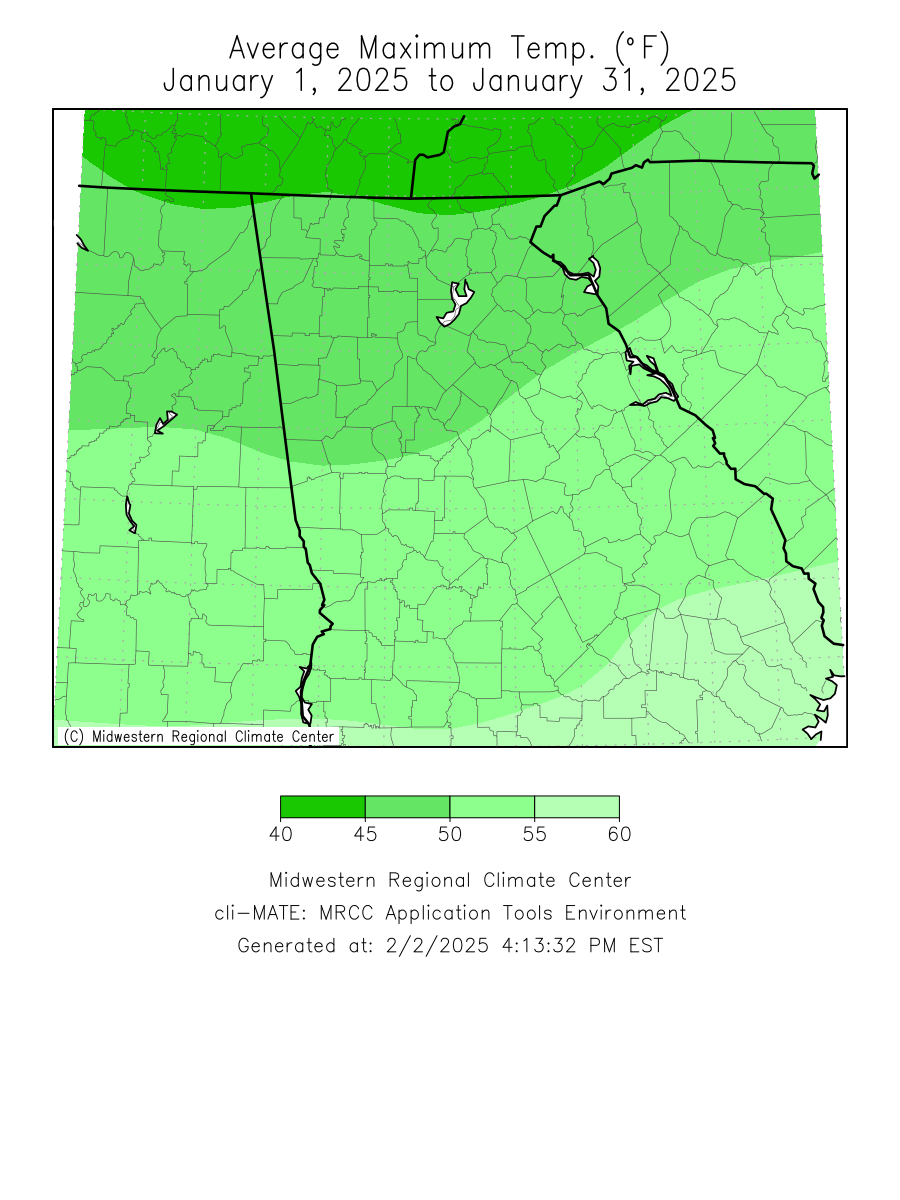
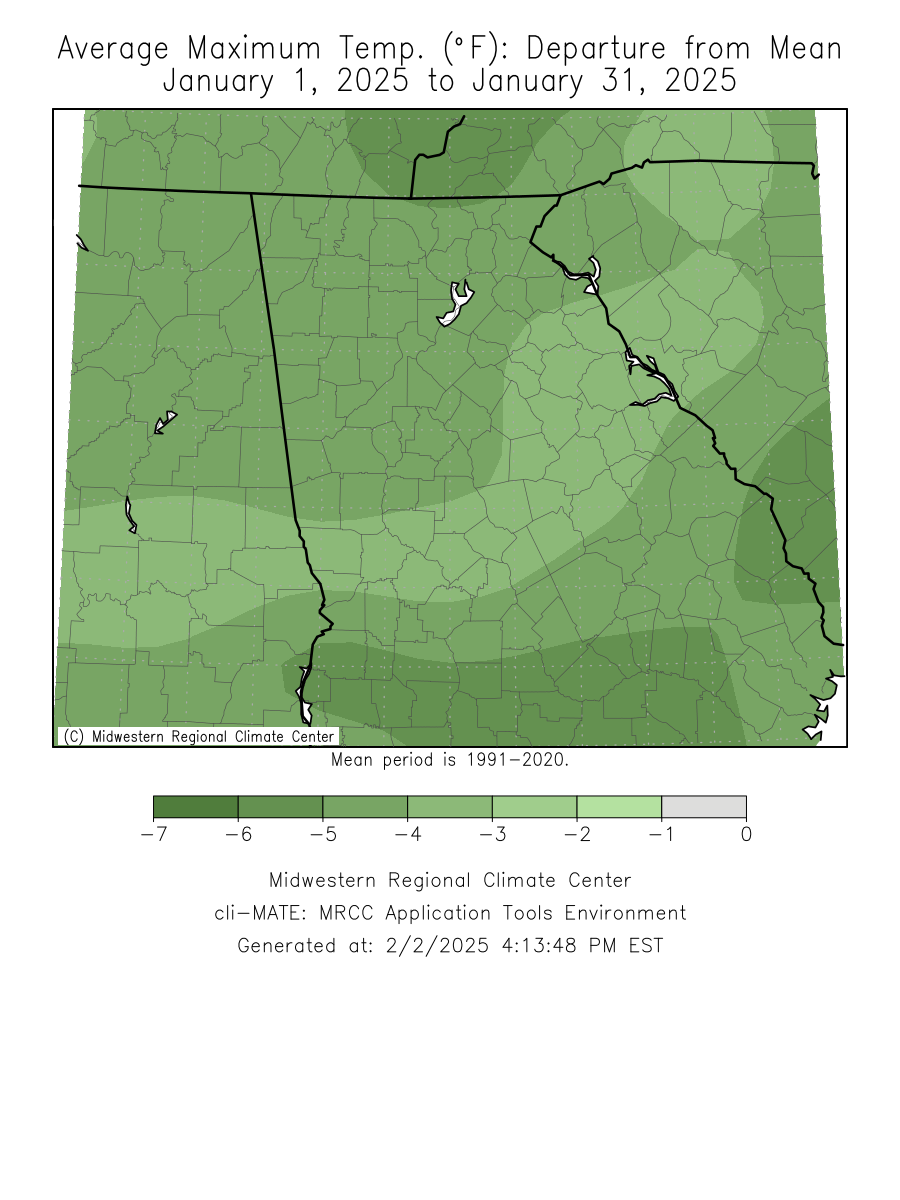
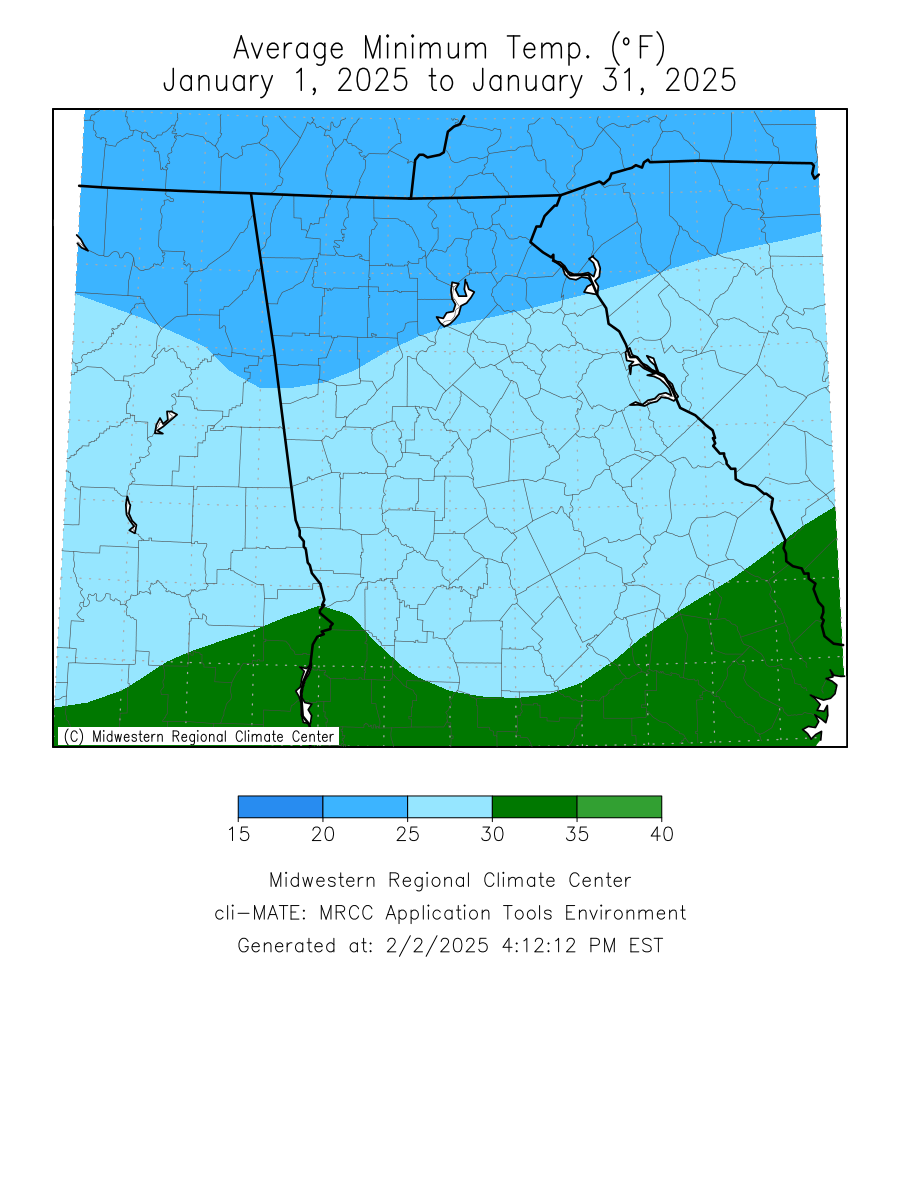
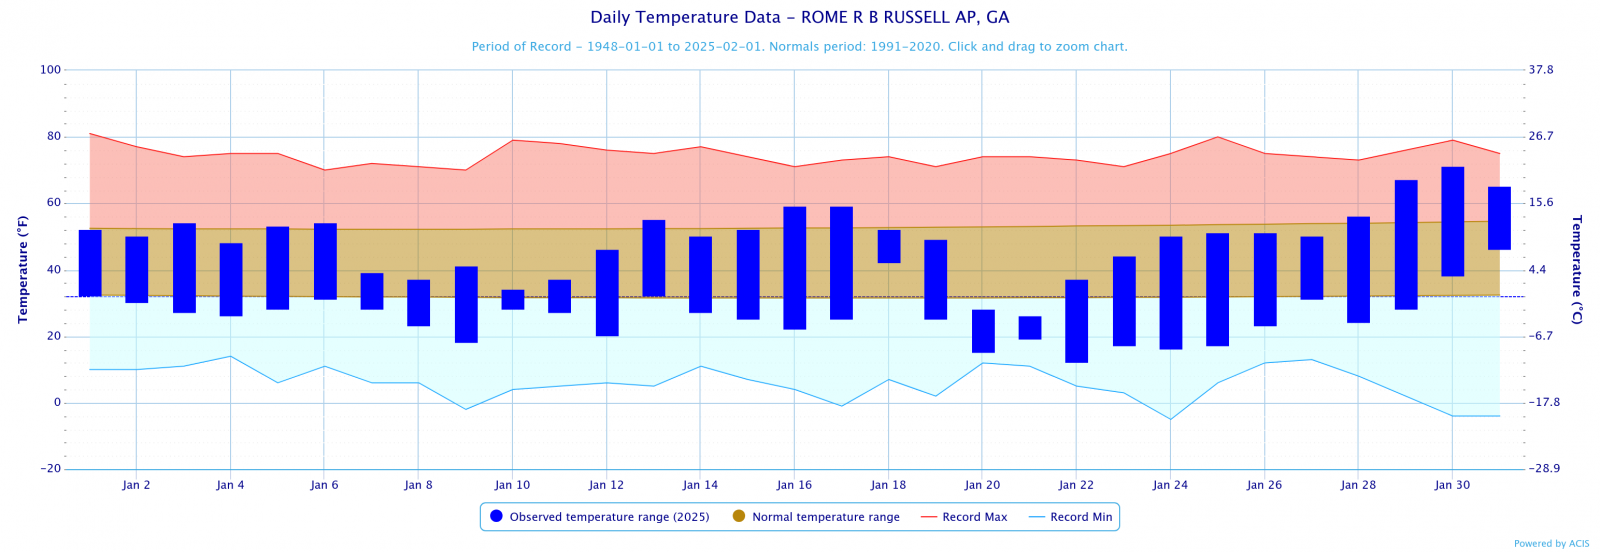
January 2025 Temperature Climate Statistics
|
||||
|
Climate Site |
Maximum Temperature |
Max T Date |
Minimum Temperature
|
Min T Date
|
|
Athens
|
69
|
1/29
|
16
|
1/22
|
|
Atlanta
|
70
|
1/30
|
14
|
1/22
|
|
Columbus
|
73
|
1/30
|
17
|
1/22
|
|
Macon
|
73
|
1/30
|
12
|
1/22
|
|
Dekalb Peachtree Arpt
|
68
|
1/30
|
12
|
1/22
|
|
Fulton Co Arpt
|
72
|
1/30
|
13
|
1/22
|
|
Gainesville
|
64
|
1/29, 30
|
15
|
1/22
|
|
Peachtree City
|
72
|
1/30
|
10
|
1/22
|
|
Rome
|
71
|
1/30
|
12
|
1/22
|
|
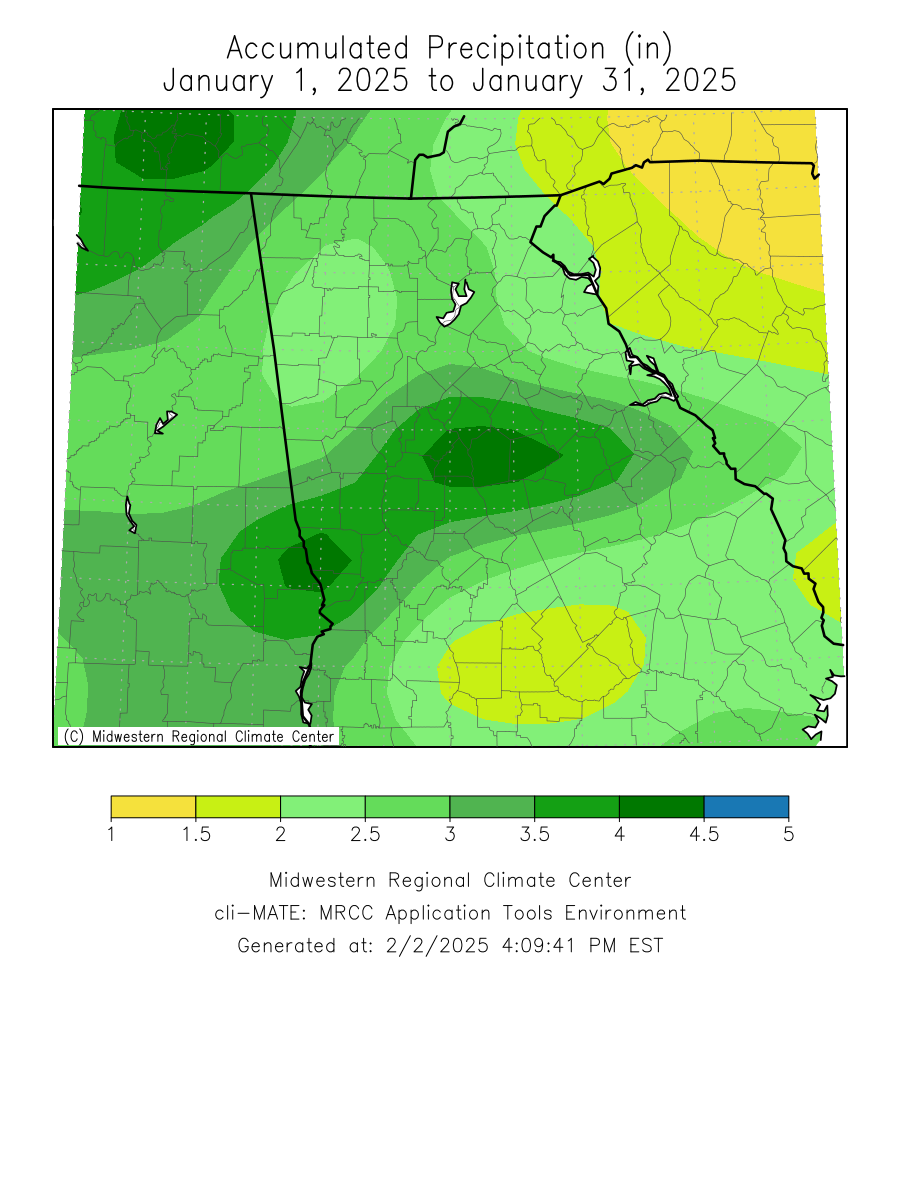
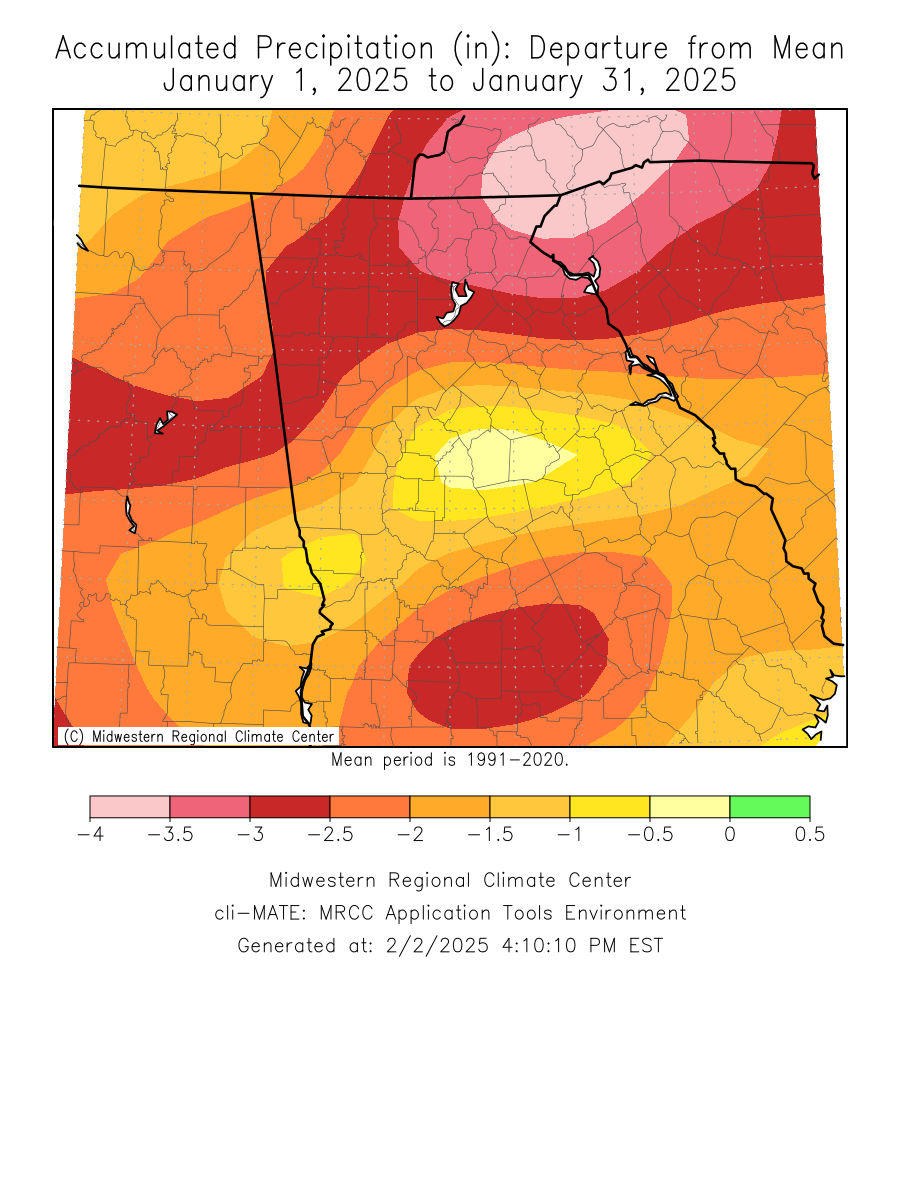
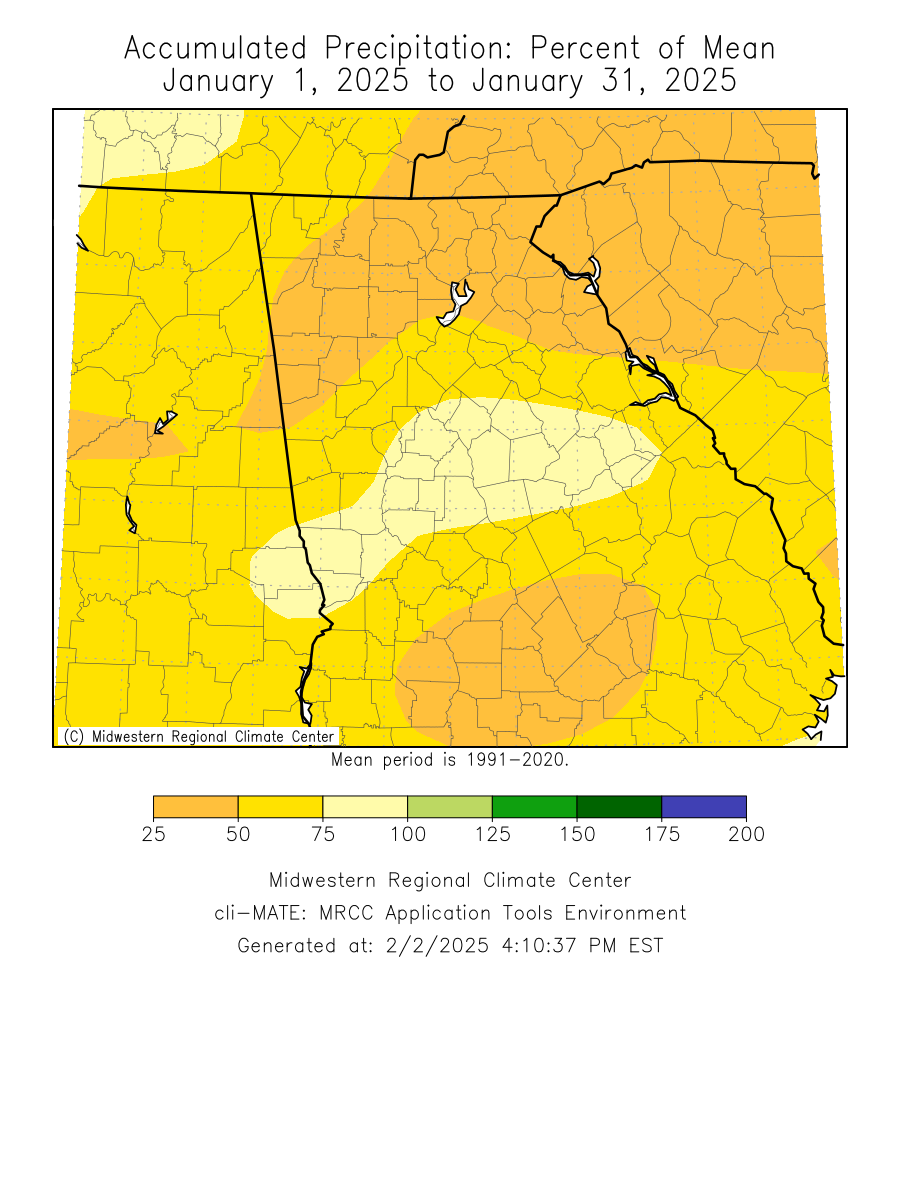
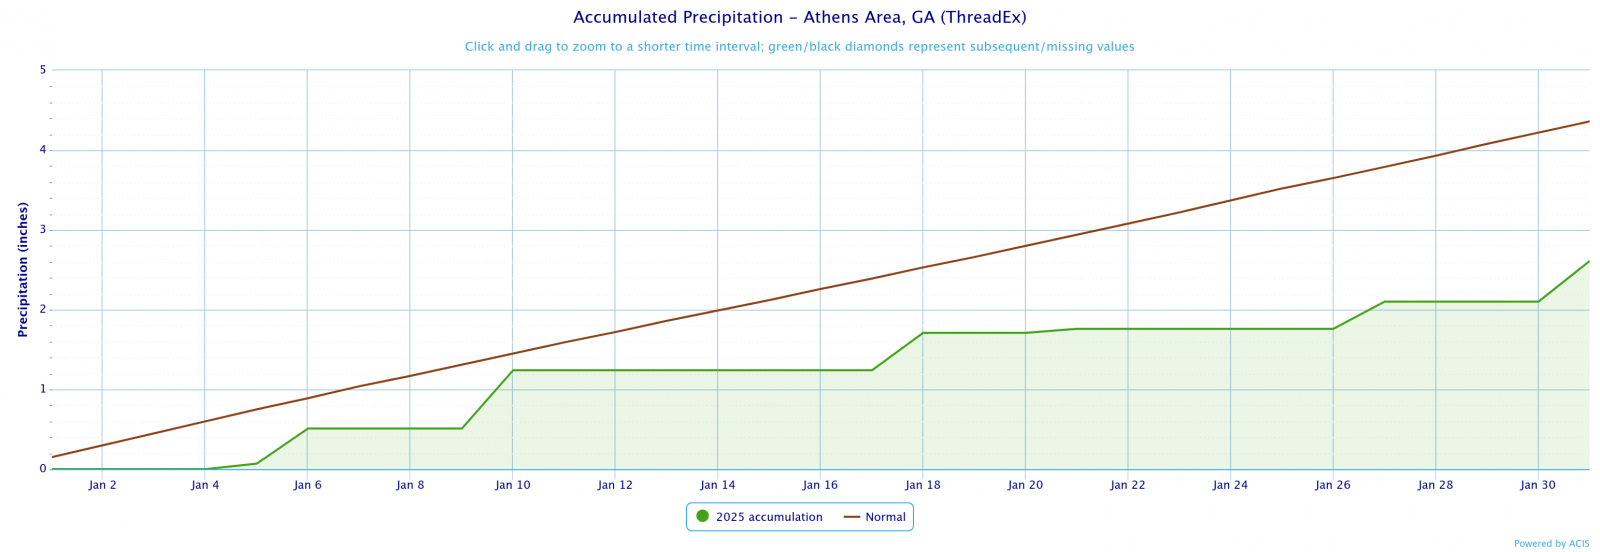
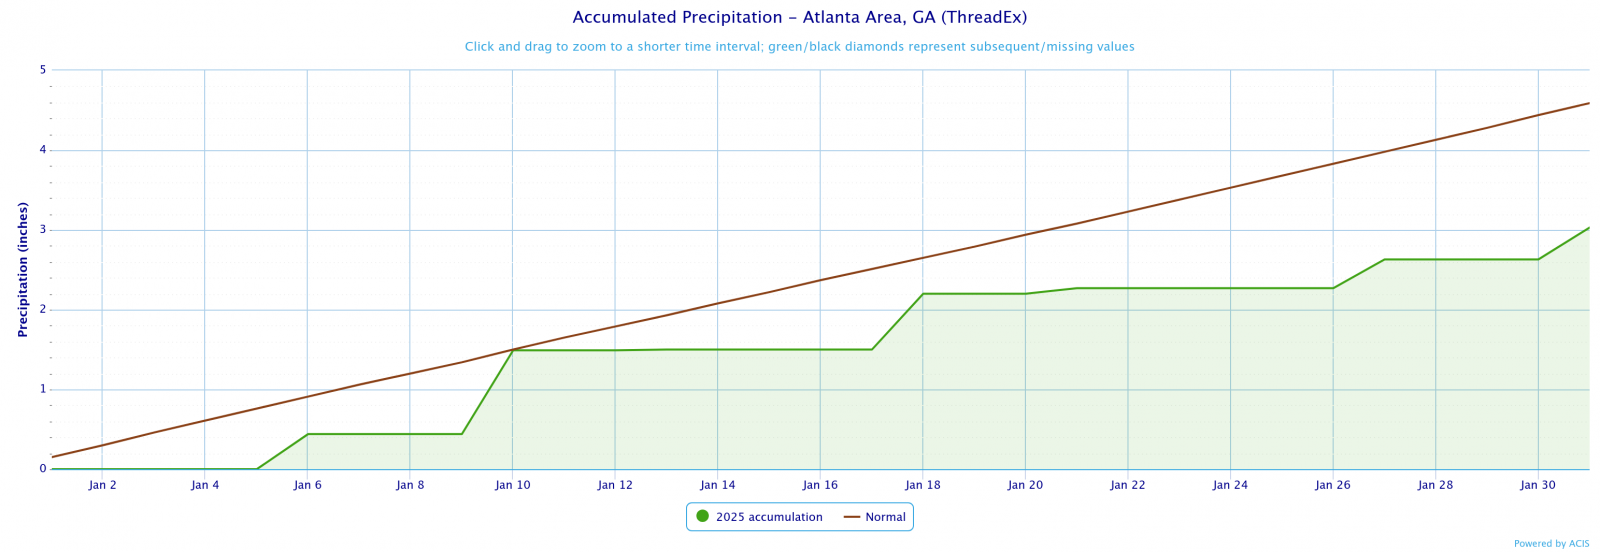
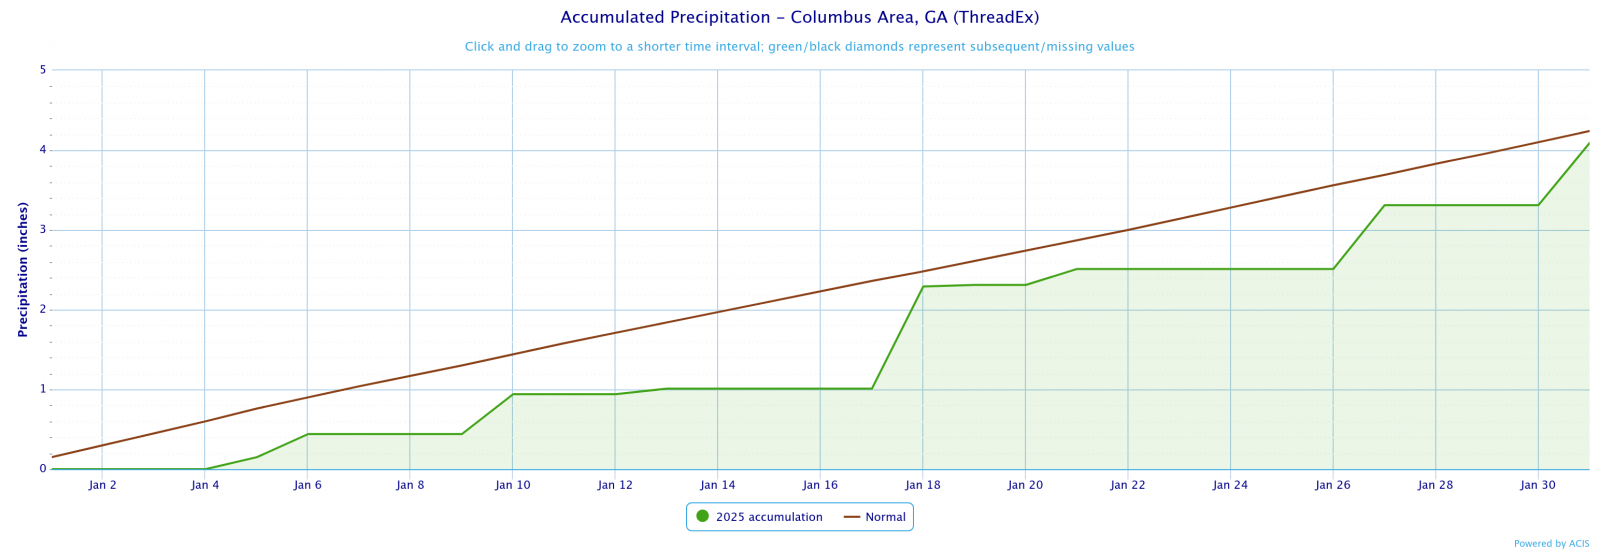
January 2025 Precipitation Climate Statistics
|
|||
|
Climate Site |
Total Precipitation |
Average Precipitation
|
DFN (Departure From Normal)
|
|
Athens
|
2.61
|
4.36
|
-1.75
|
|
Atlanta
|
3.20
|
4.56
|
-1.39
|
|
Columbus
|
4.09
|
4.24
|
-0.15
|
|
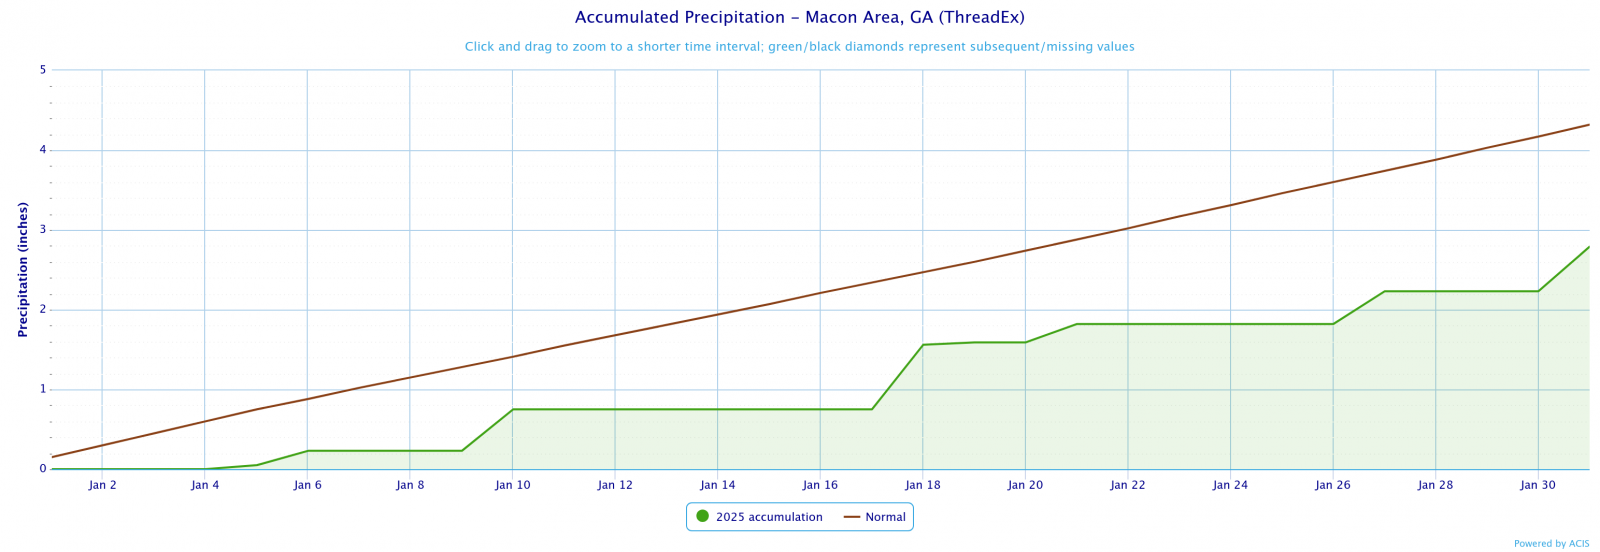
Macon
|
2.79
|
4.32
|
-1.53
|
|
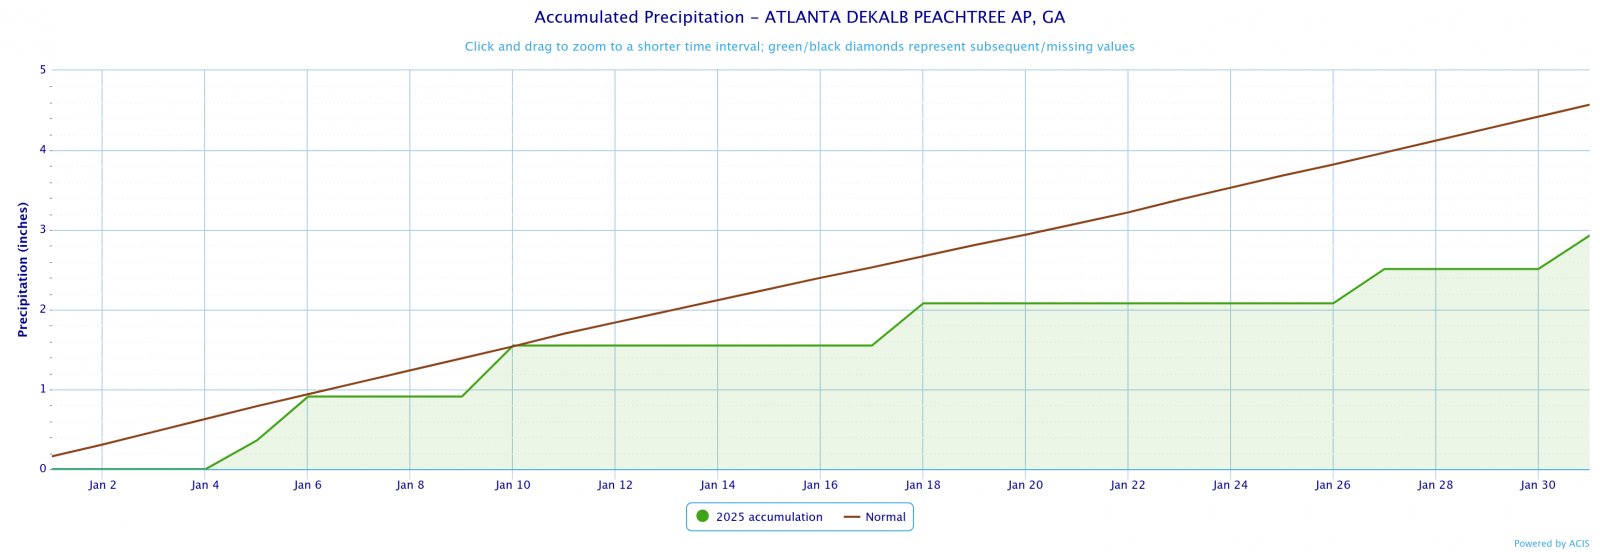
Dekalb Peachtree Arpt
|
2.93
|
4.57
|
-1.64
|
|
Fulton County Arpt
|
3.07
|
4.25
|
-1.18
|
|
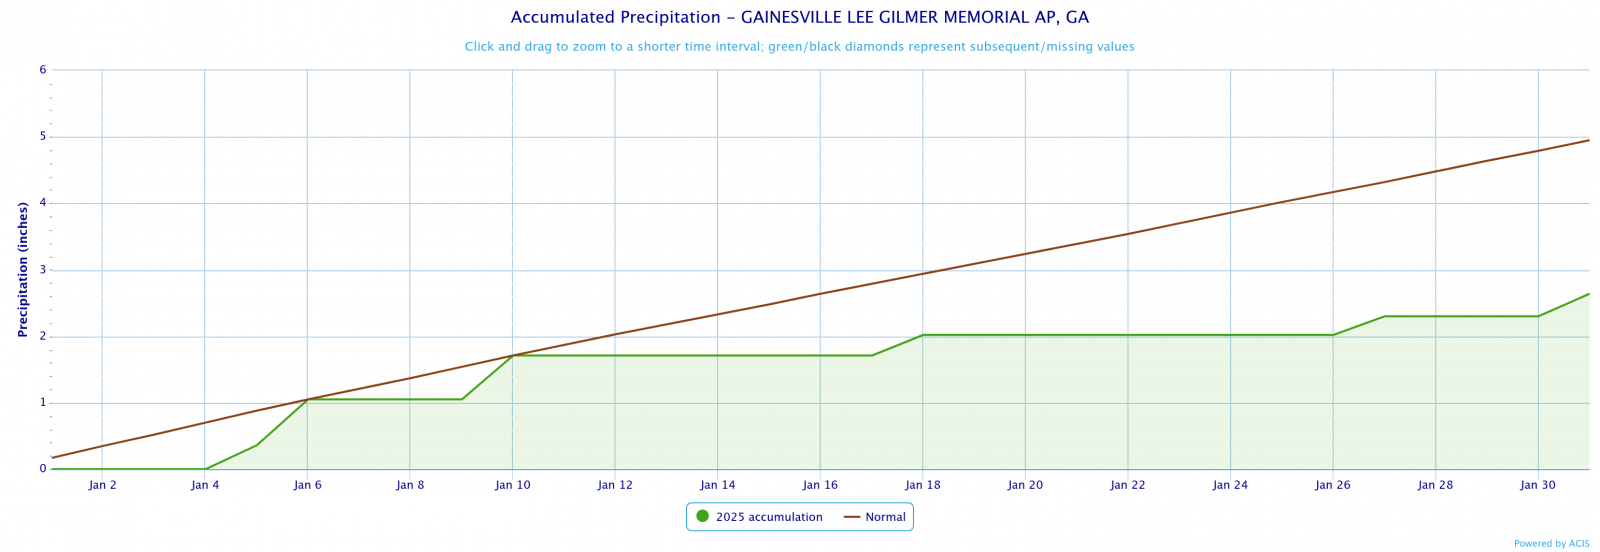
Gainesville
|
2.64
|
4.95
|
-2.31
|
|
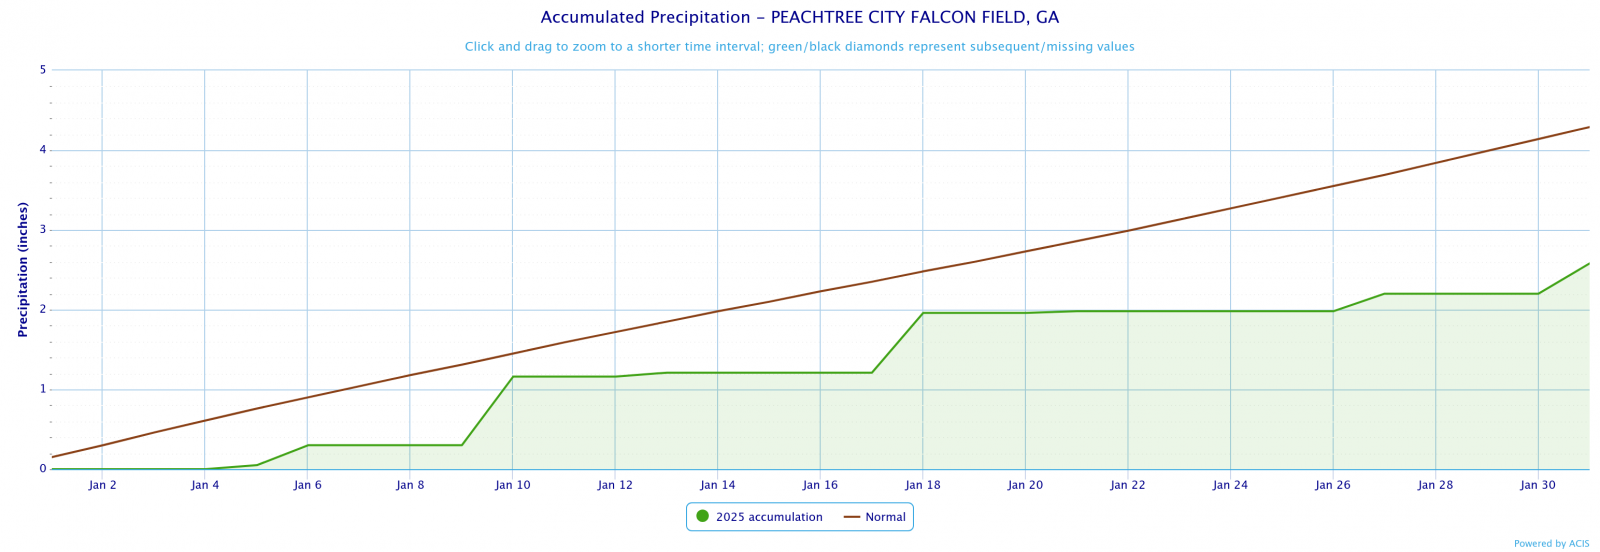
Peachtree City
|
2.58
|
4.29
|
-1.71
|
|
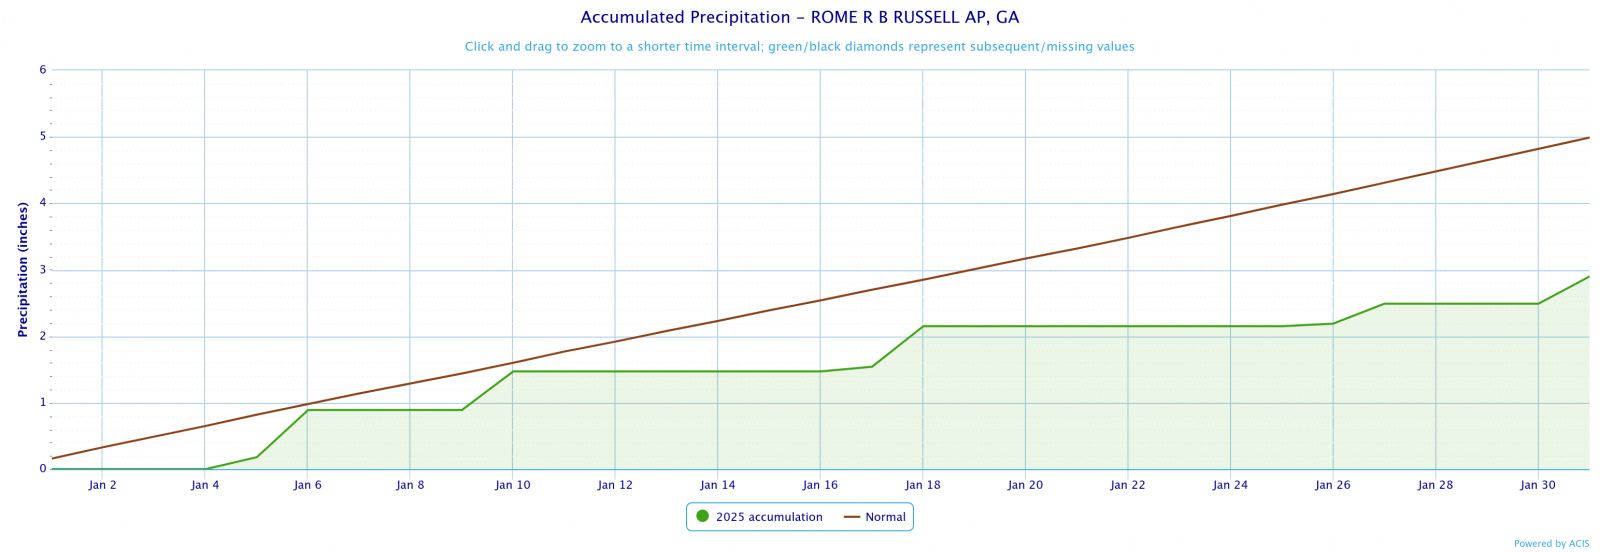
Rome
|
2.90
|
4.99
|
-2.09
|
|
January 2025 Precipitation Climate Statistics
|
||||
|
Climate Site |
Maximum Daily Precip (in inches) |
Max P Date |
||
|
Athens
|
0.73
|
1/10
|
||
|
Atlanta
|
1.05
|
1/10
|
||
|
Columbus
|
1.28
|
1/18
|
||
|
Macon
|
0.84
|
1/9
|
||
|
Dekalb Peachtree Arpt
|
0.91
|
1/9
|
||
|
Fulton Co Arpt
|
1.00
|
1/5
|
||
|
Gainesville
|
1.05
|
1/9
|
||
|
Peachtree City
|
0.86
|
1/9
|
||
|
Rome
|
0.89
|
1/5
|
||
Data prepared by NWS Peachtree City/Atlanta
| Temperature Maps | Precipitation Maps |
| Temperature Graphs | Precipitation Graphs |
|
January 2025 Climate Records
|
|||
|
Date
|
Type
|
Location
|
Records set over a 24 hour period
|
|
1/10
|
Snow
|
Atlanta |
A record 24 hour snowfall total was set at 2.10".
|
|
1/21
|
Snow
|
Atlanta |
A record 24 hour snowfall total was set at 1.10".
|
|
1/12
|
Min T
|
Macon |
Macon fell to 12°F which breaks the record of 13°F in 1985
|
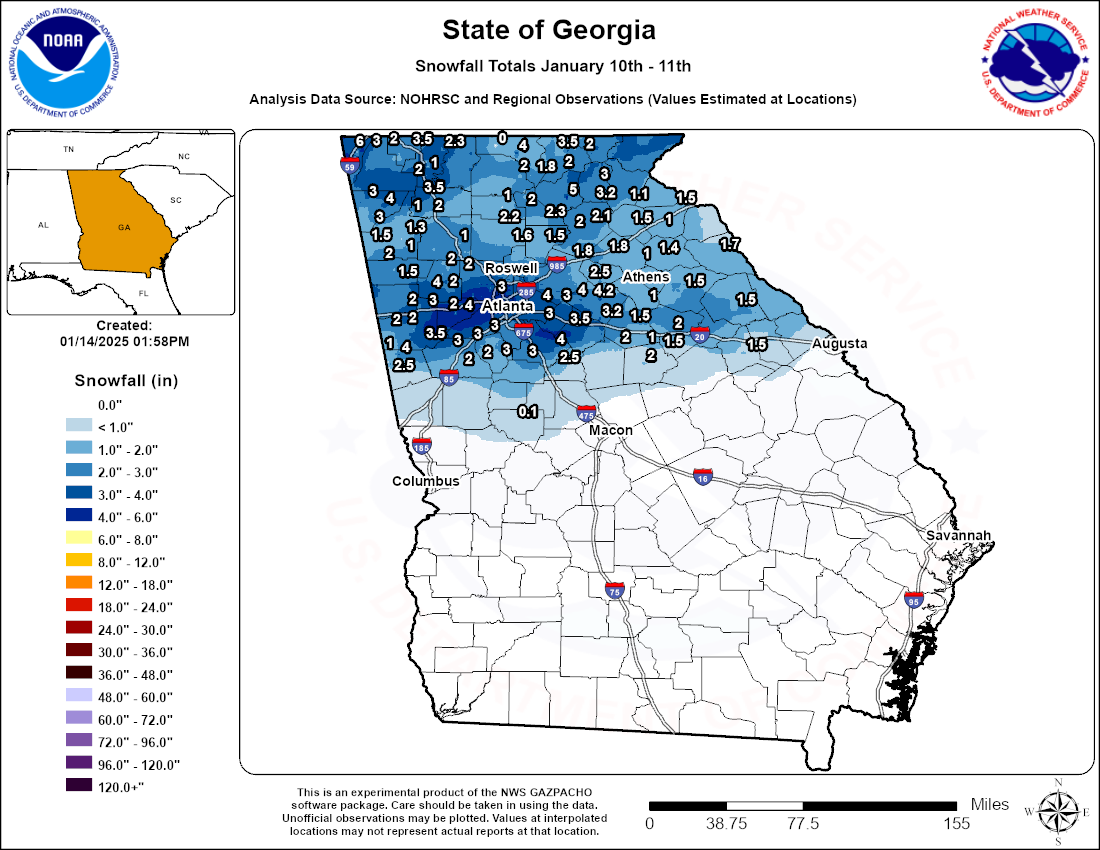
Winter Storm #1 January 10th:
An Arctic airmass was entrenched across the eastern United States during mid January. As an area of low pressure developed over the northern coast of the Gulf and pushed eastward, moisture spread northward into the lingering cold airmass beginning during the early morning hours of January 10th. Temperatures throughout the atmospheric column were initially cold enough for snow across north Georgia on the morning of Friday, January 10th. However, warm air advection aloft led to a changeover to mostly freezing rain across most of north Georgia by the afternoon and evening hours. By the time the precipitation ended, several inches of snow as well as one-tenth to one-third of an inch of freezing rain had accumulated across most of north Georgia.
 |
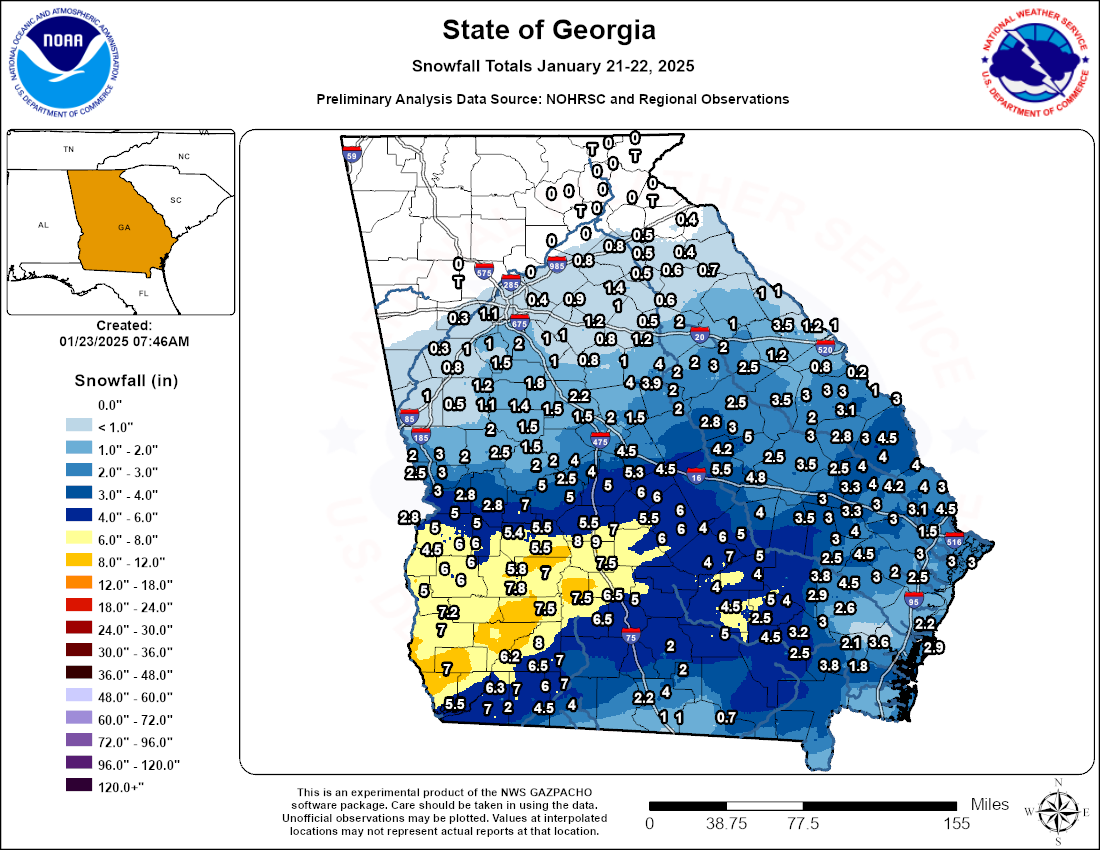
Winter Storm #2 January 21st:
The second Arctic airmass of the year was entrenched across the eastern United States during mid- to-late January. As an area of low pressure developed over the Texas Gulf coast and pushed eastward to the northern Gulf coast, moisture spread northward into the lingering cold airmass beginning during the late morning of January 21st. Initially, a deep layer of dry air was in place early on the 21st before the moisture was able to moisten the column. With temperatures throughout the atmospheric column below freezing throughout the day on Tuesday the 21st, snow was able to fall in central Georgia and portions of north Georgia. By early evening, dry air took over most areas north of Macon and Columbus resulting in the end of the snowfall event, but in portions of central Georgia moisture stayed resulting in snowfall banding throughout the evening and early morning hours before tapering off. By the time the precipitation ended, several inches of snow (with one area close to ten inches) had accumulated across most of central Georgia with up to an inch observed closer to metro Atlanta. Due to the cold temperatures in the mid 20s and rush hour traffic, as soon as the snow fell it melted and refroze instantly on the roadways leading to icy roads for many Tuesday evening into Wednesday morning as temps struggled to reach above freezing until Thursday.
 |
Based on the Climate Prediction Center's outlook for February, north and central Georgia has a 50%-60% chance of above normal temperatures; while parts of southern and central Georgia has a 60%-70% chance of seeing above normal temperatures. North and central Georgia has equal chances of above or below normal precipitation.
 |
 |
Data prepared by NWS Peachtree City/Atlanta.

