| Previous Month | Next Month |
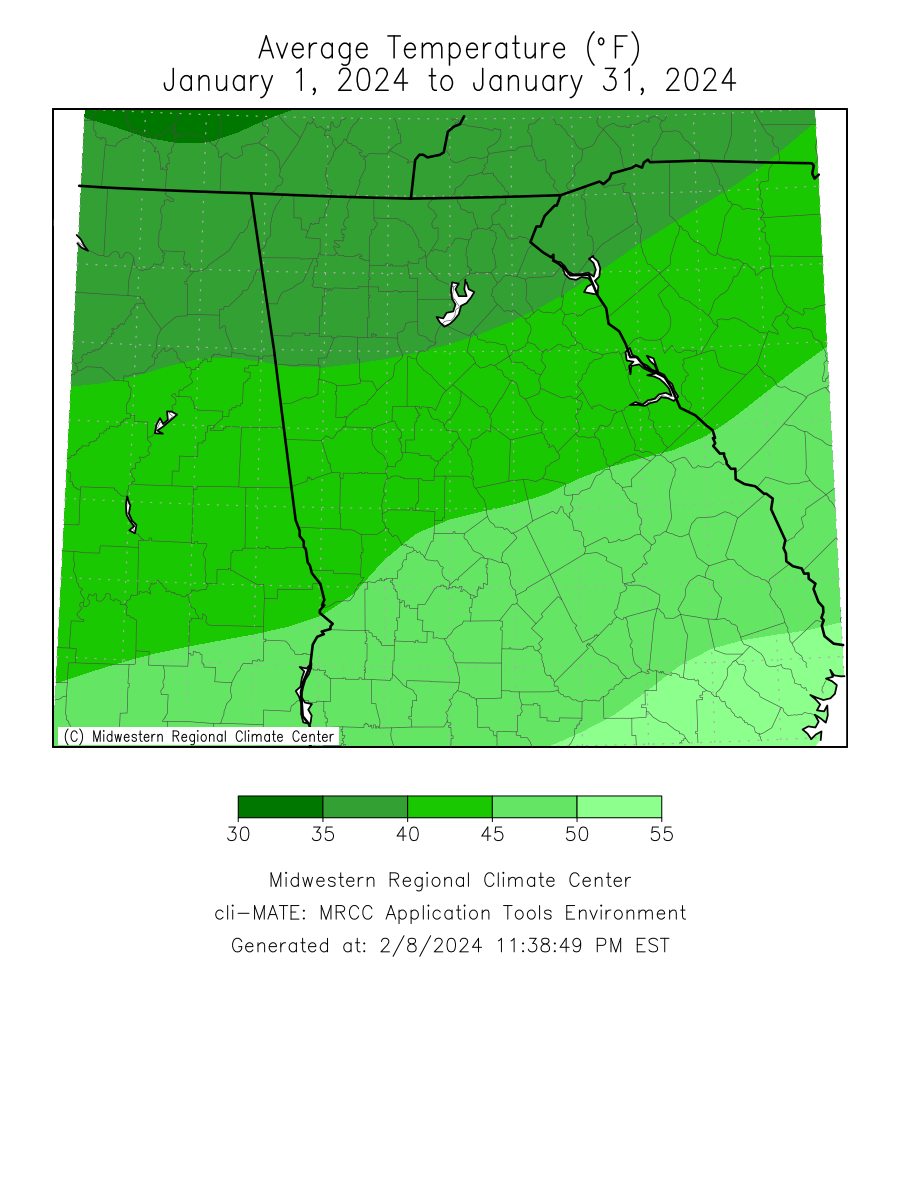
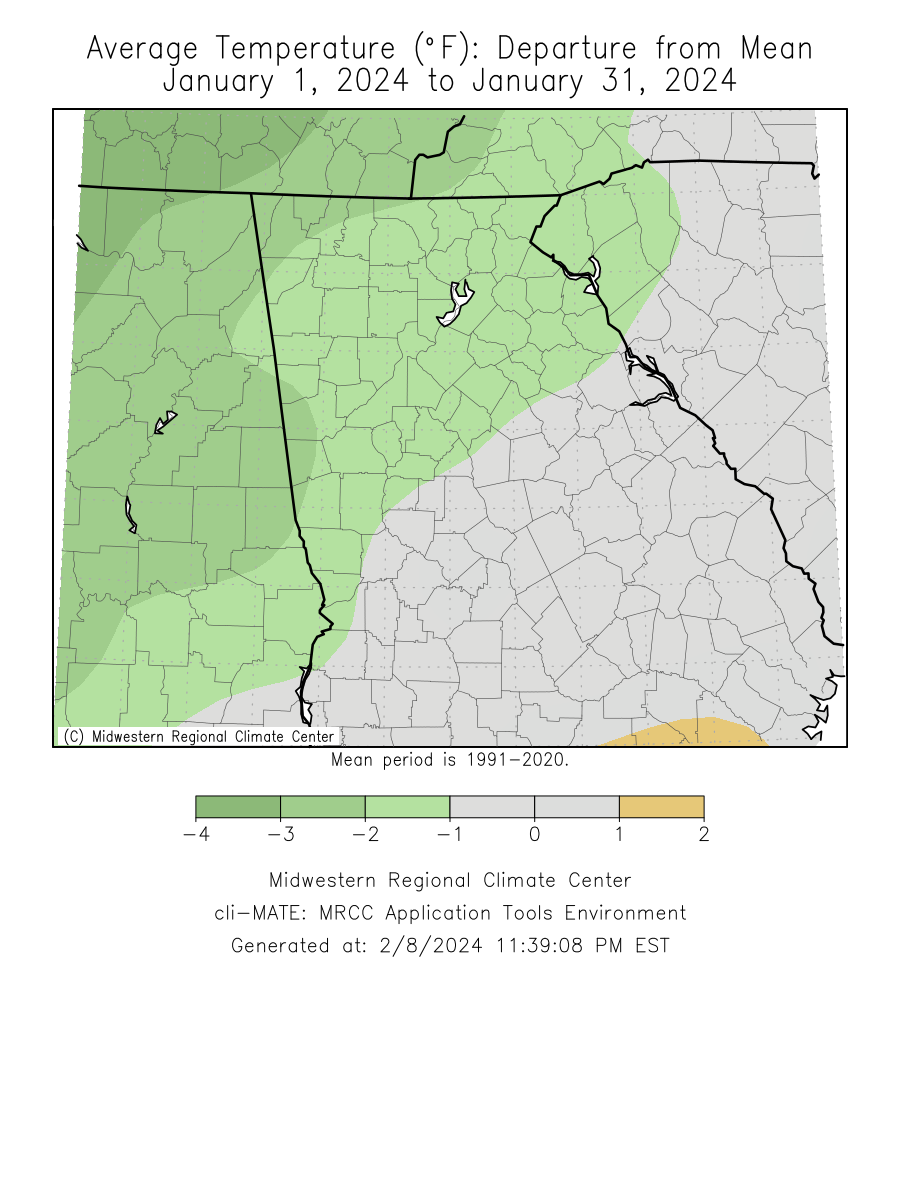
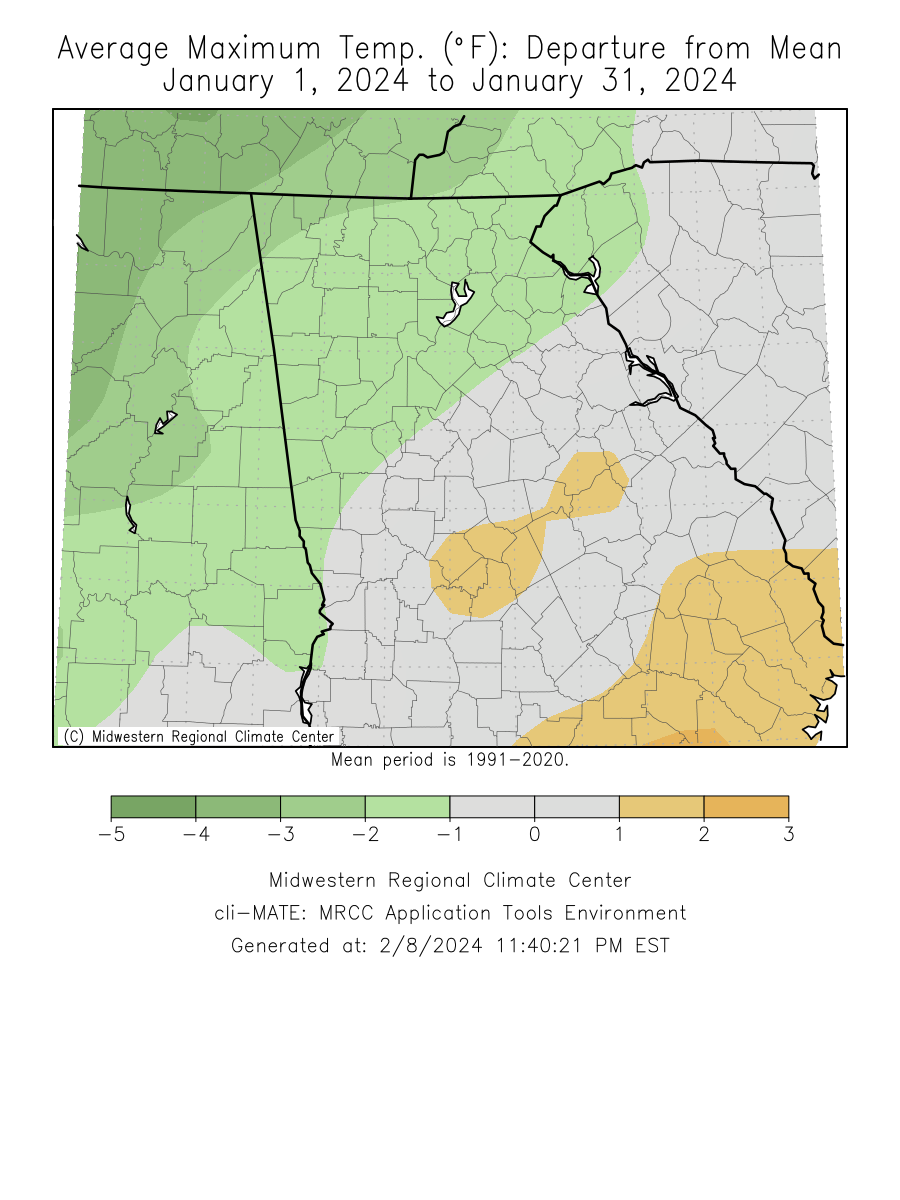
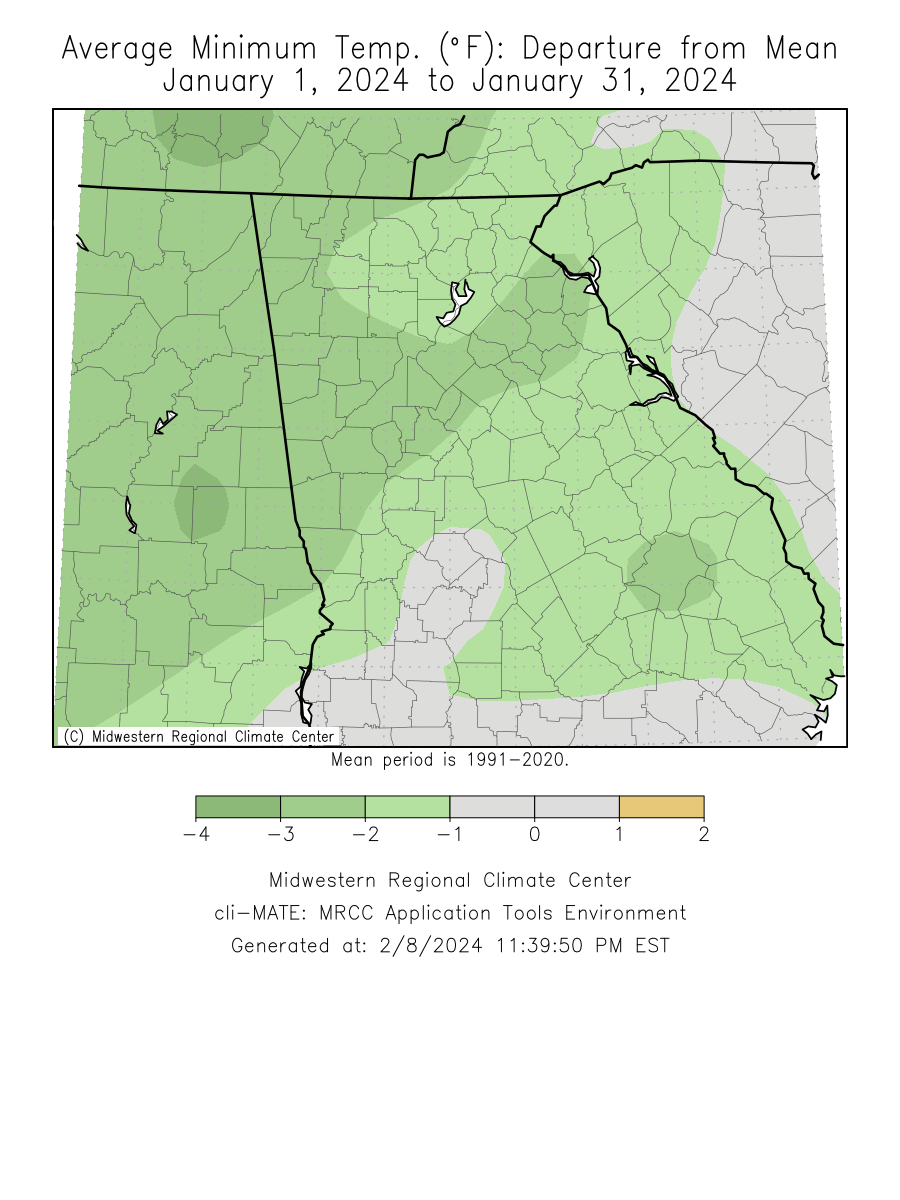
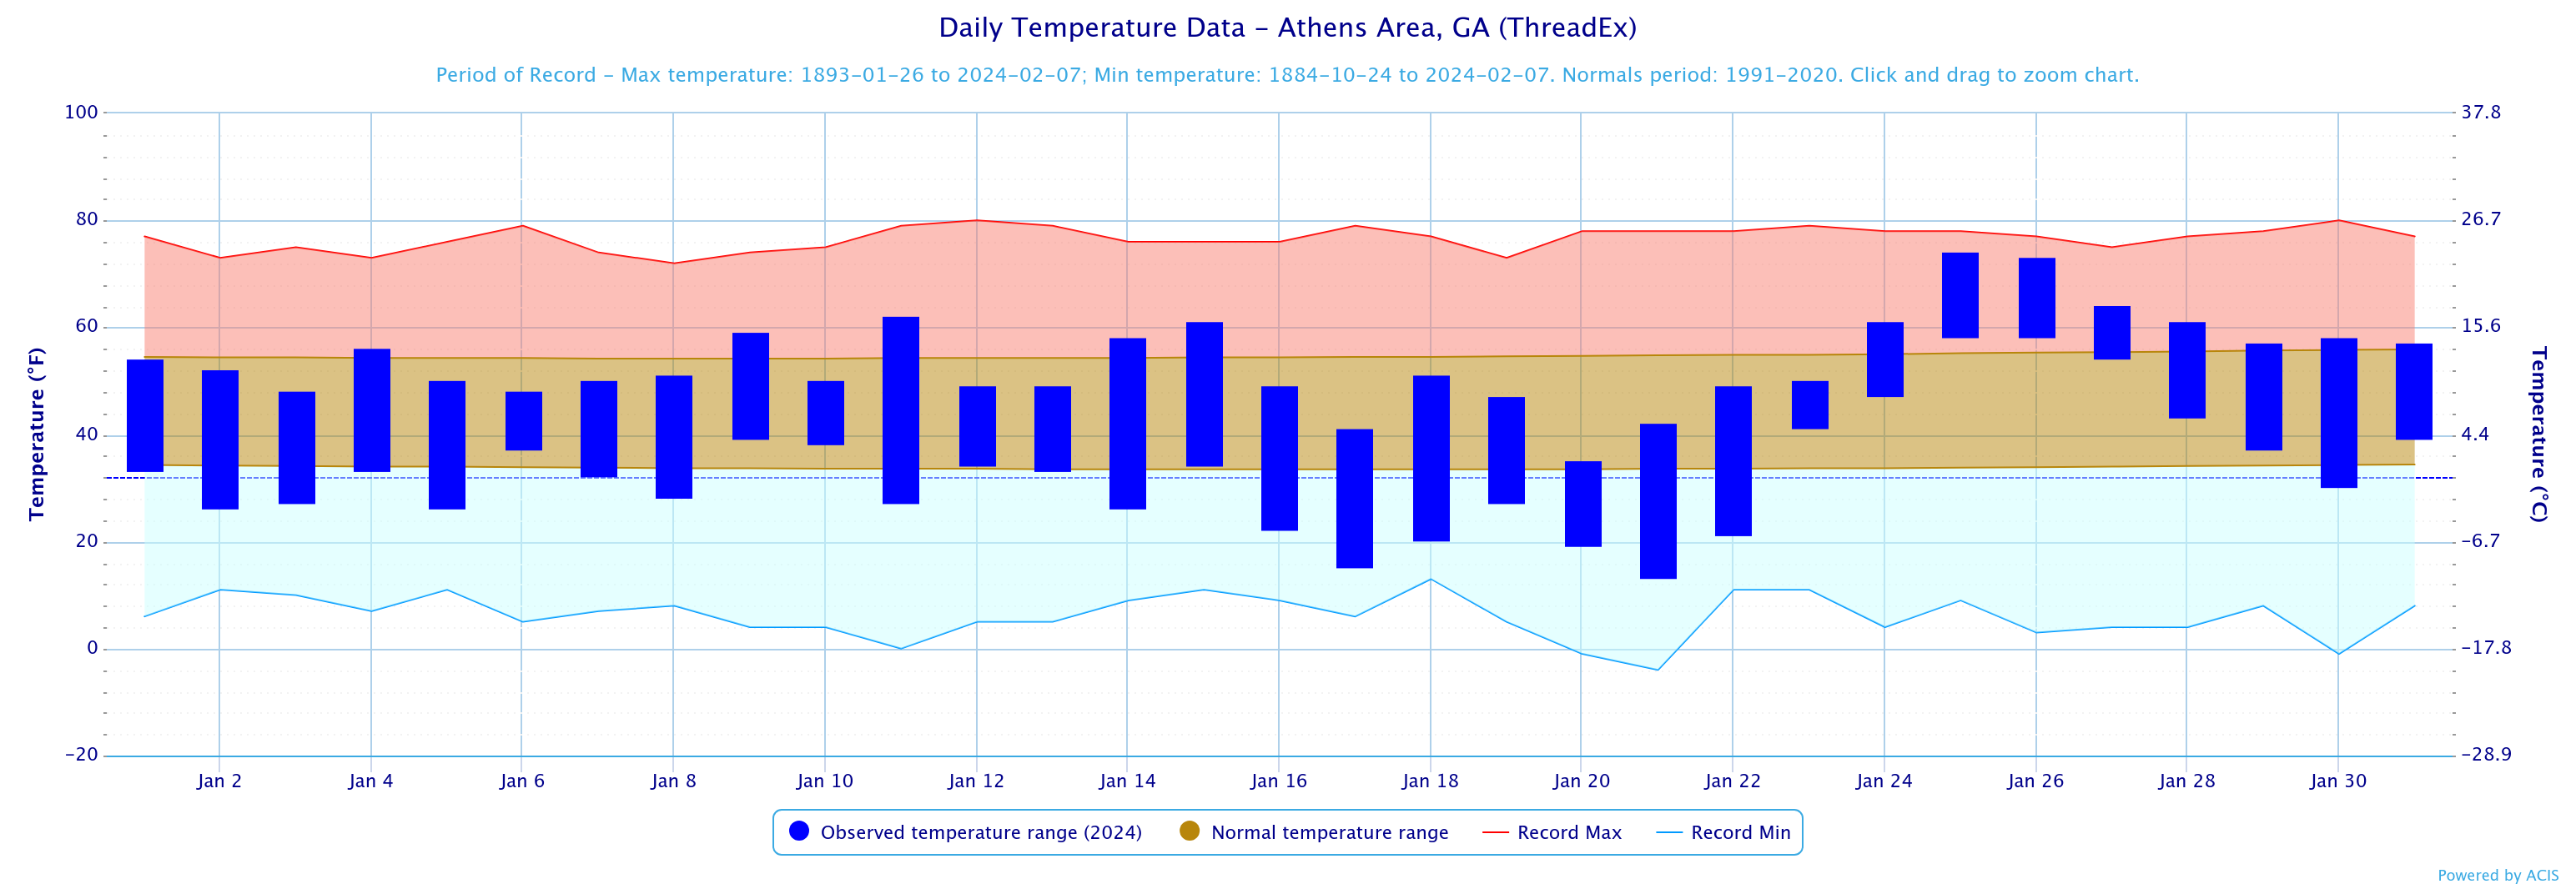
Temperatures through the month of January were a degree below normal. Precipitation through the month of January was around 3 inches above normal.
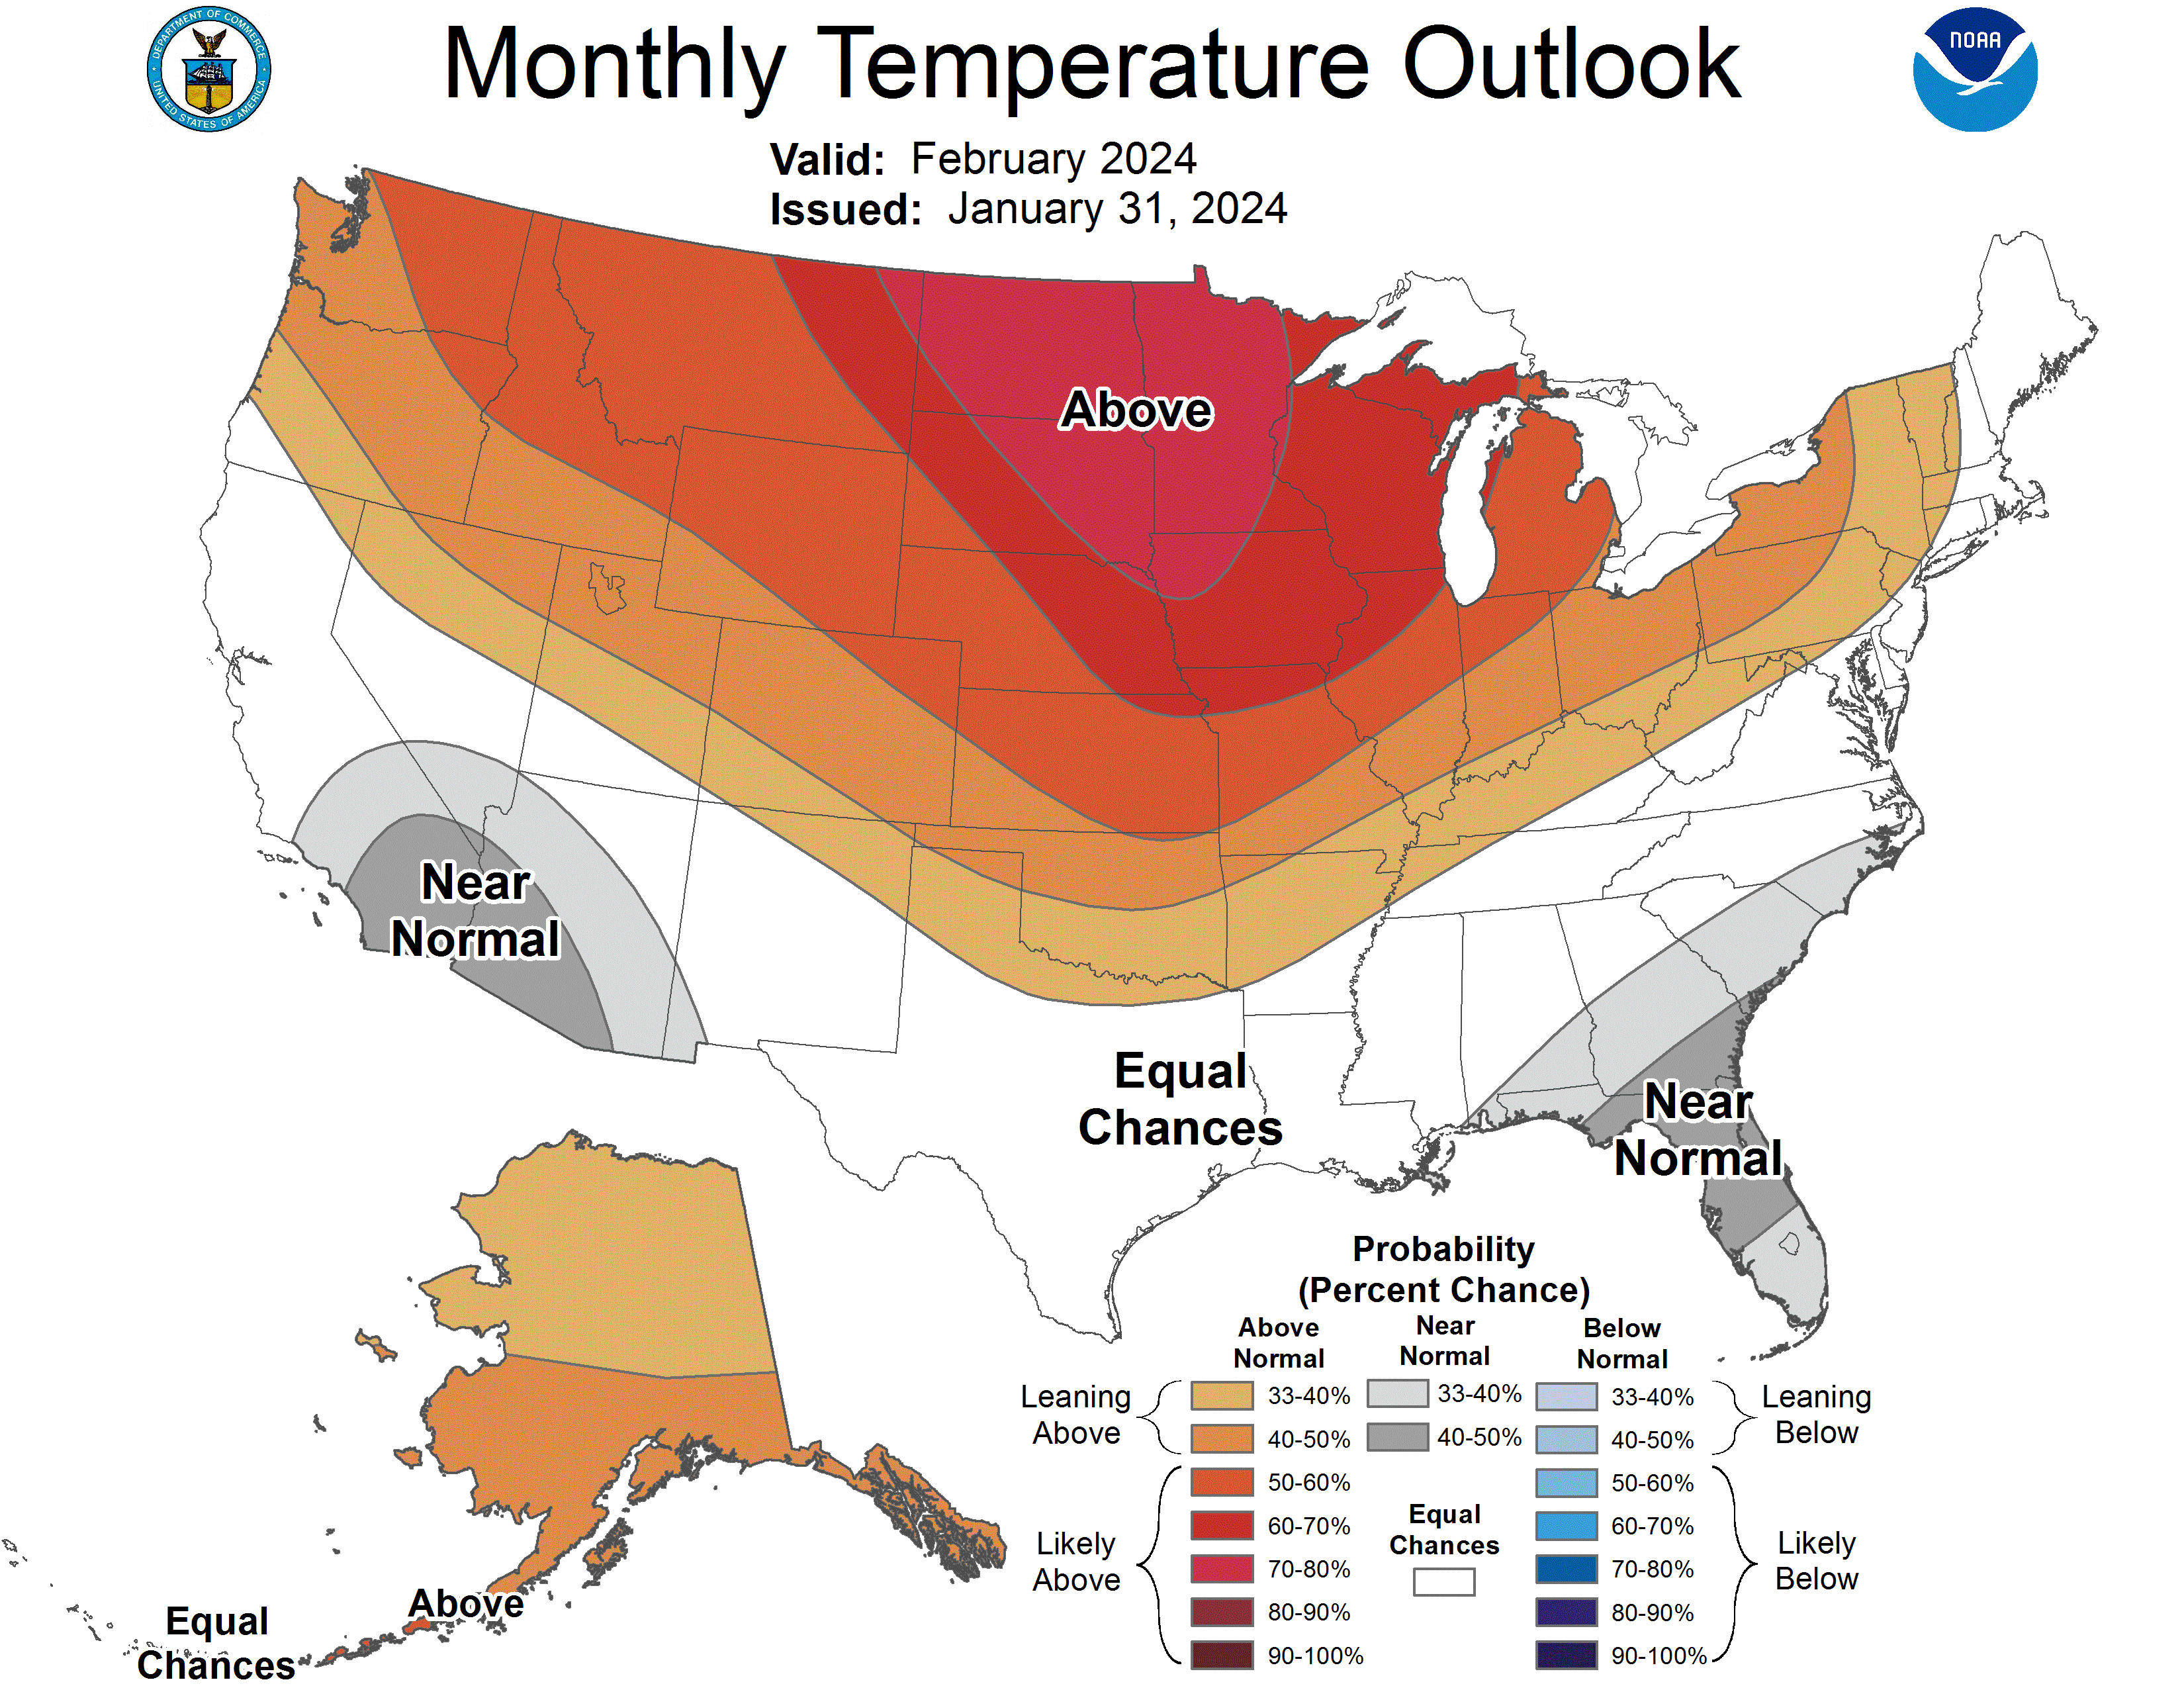
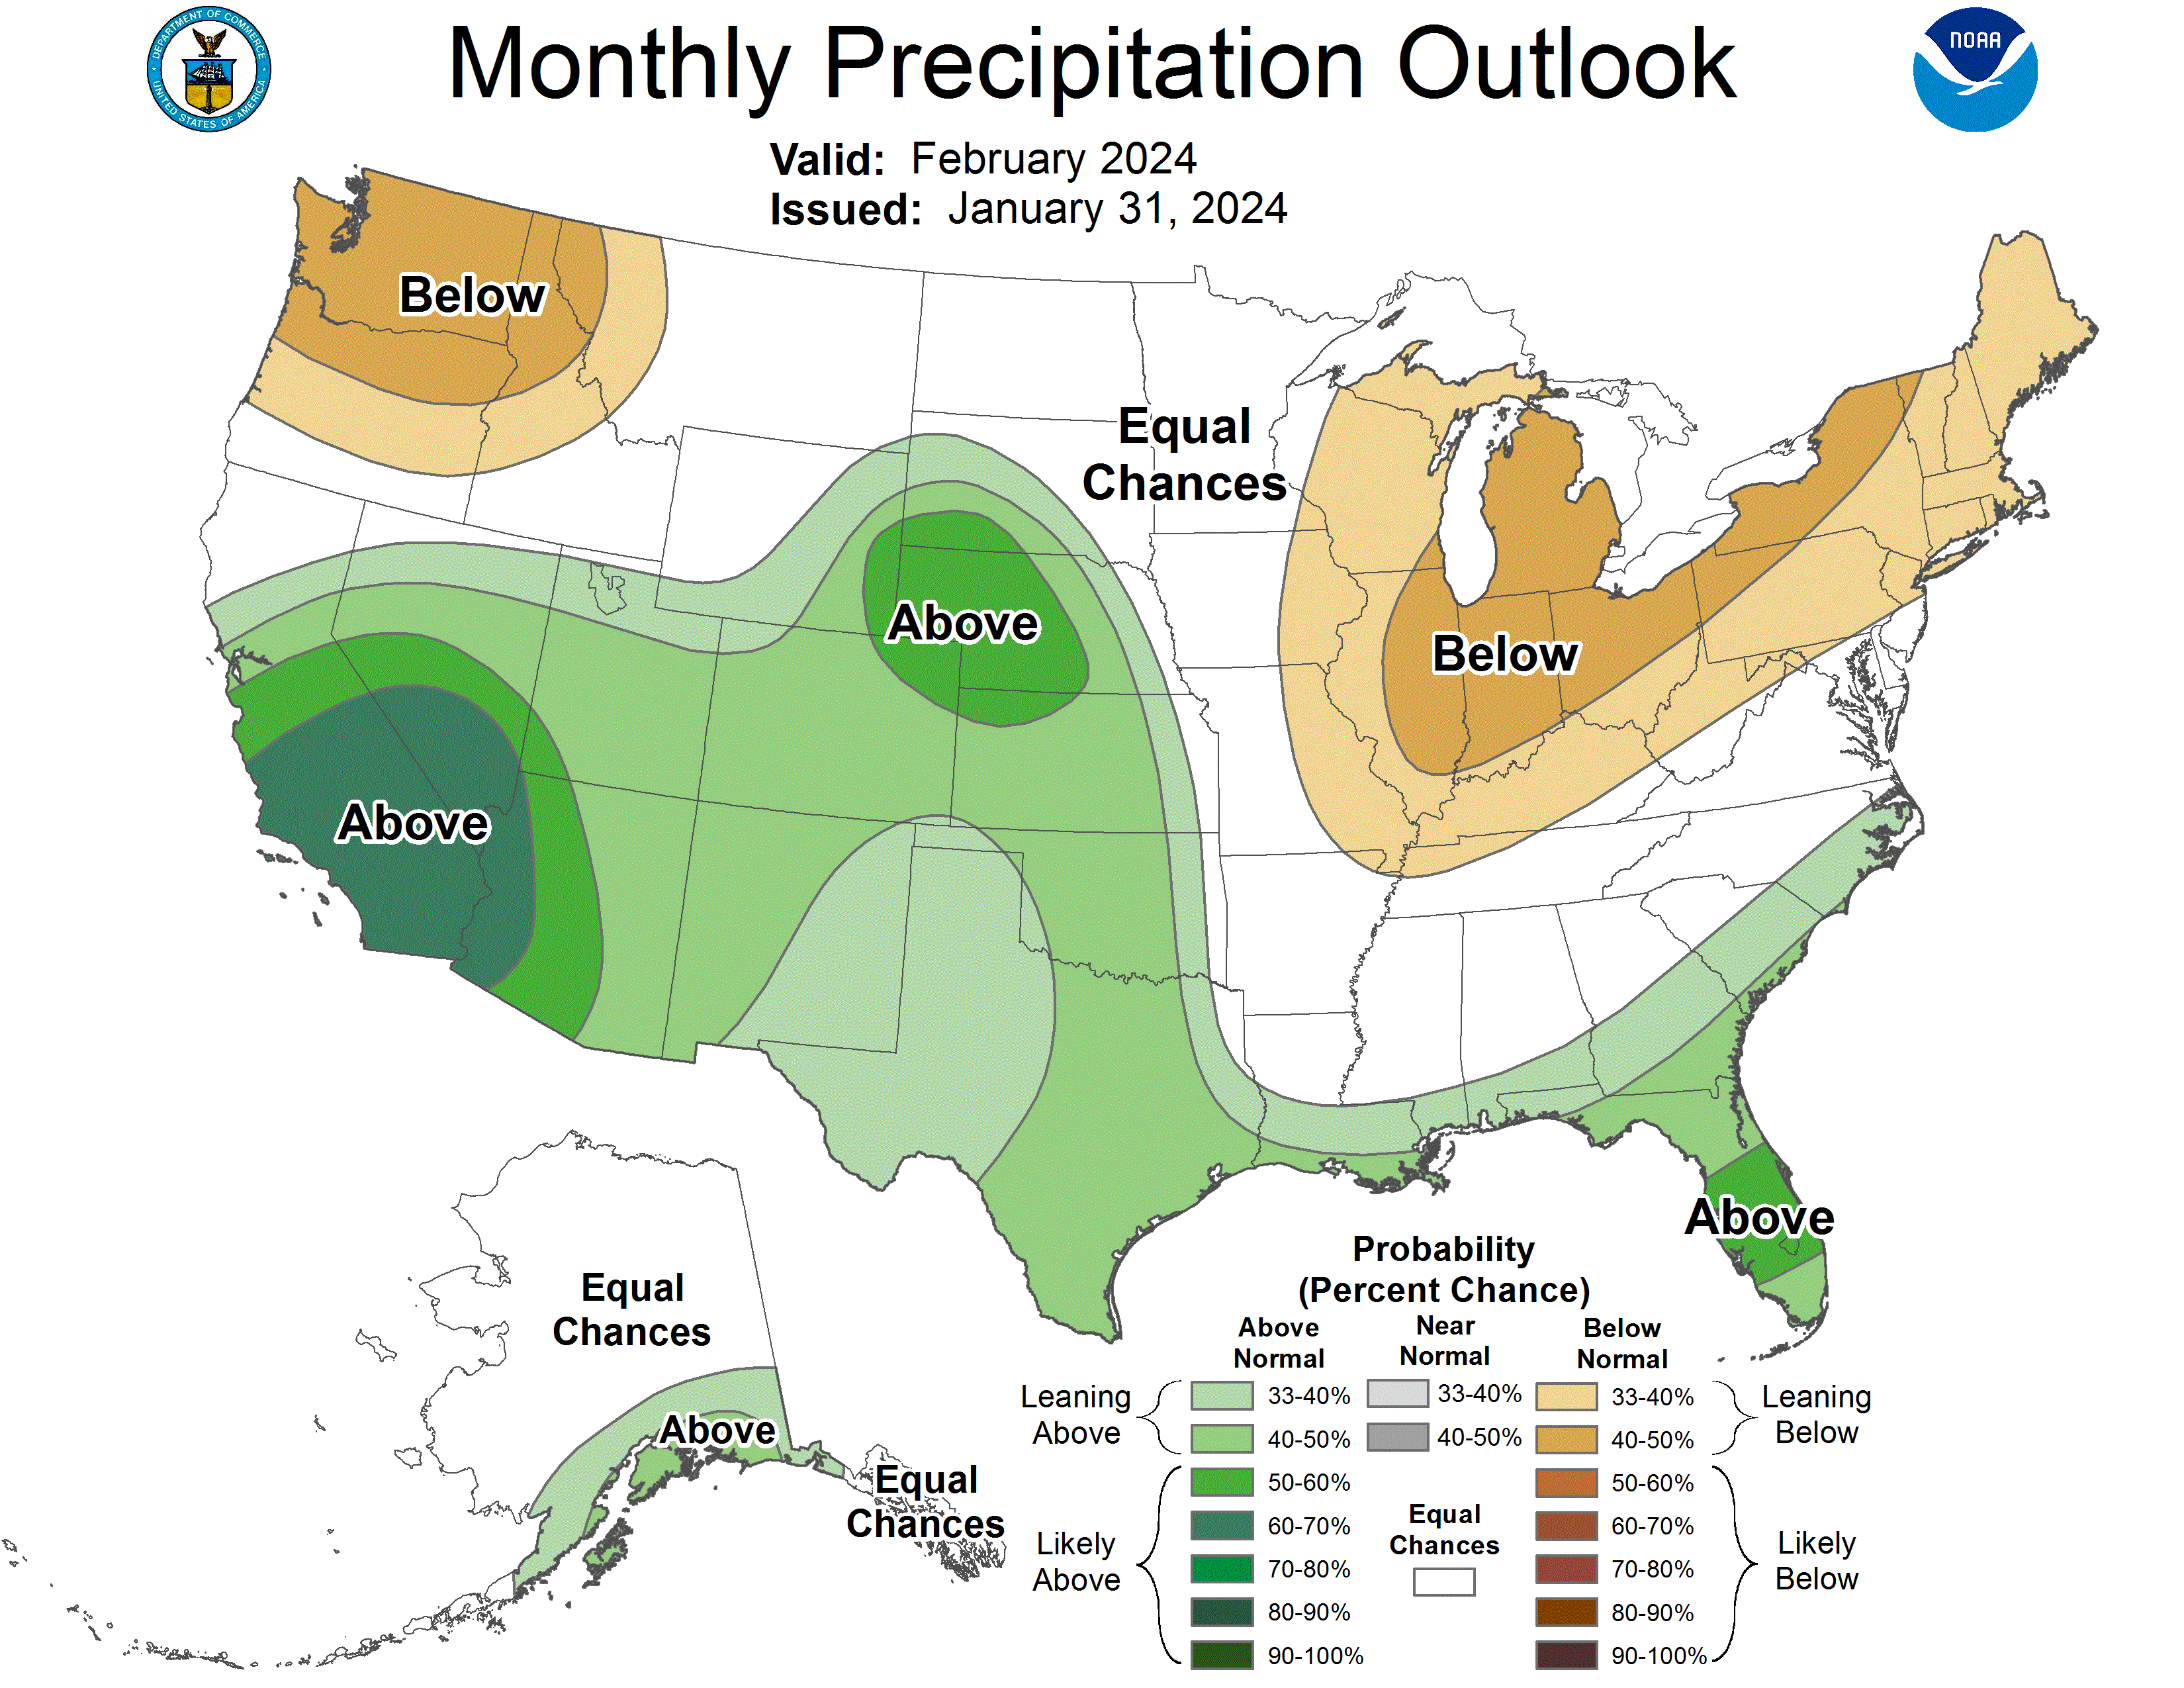
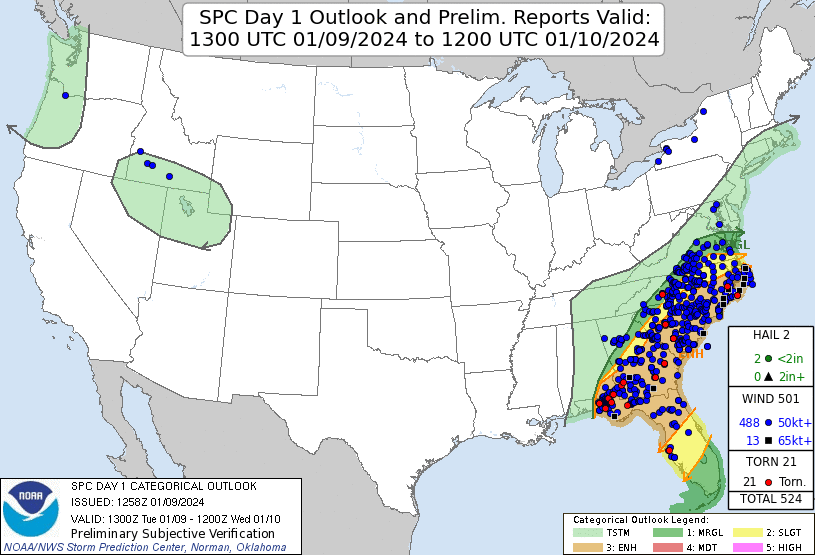
Climate Site Temperatures Precipitation Climate Site Maximum Temperature Max T Date Climate Site Total Precipitation DFN (Departure Climate Site Maximum Daily Precip (in inches) Max P Date Data prepared by NWS Peachtree City/Atlanta January 9, 2024 Severe Weather Outbreak A line of thunderstorms moved across Georgia during the morning and early afternoon hours of the 9th. Most of the severe thunderstorms was collocated with the greatest instability across South-Central and East-Central Georgia. However, increased shear along the base of CAD was enough to organize an embedded cell which traversed the Atlanta Metro Area. This cell developed a brief circulation, necessitating a tornado warning. In total, rainfall amounts of 2 to 3.5 inches were common, with isolated amounts of 4.5 to 8 inches. These amounts produced flooding and flash flooding over the area, and contributed to the improvement of drought conditions over north Georgia. Based on the Climate Prediction Center's outlook for February, Georgia has equal chances of above or below normal temperatures. North and central Georgia has equal chances of above or below normal precipitation. Data prepared by NWS Peachtree City/Atlanta.
Overview
Climate Graphs
Records
Events
February Outlook
Below are the overview stats for January 2024 for our 10 climate sites.
January 2024 Monthly Rankings
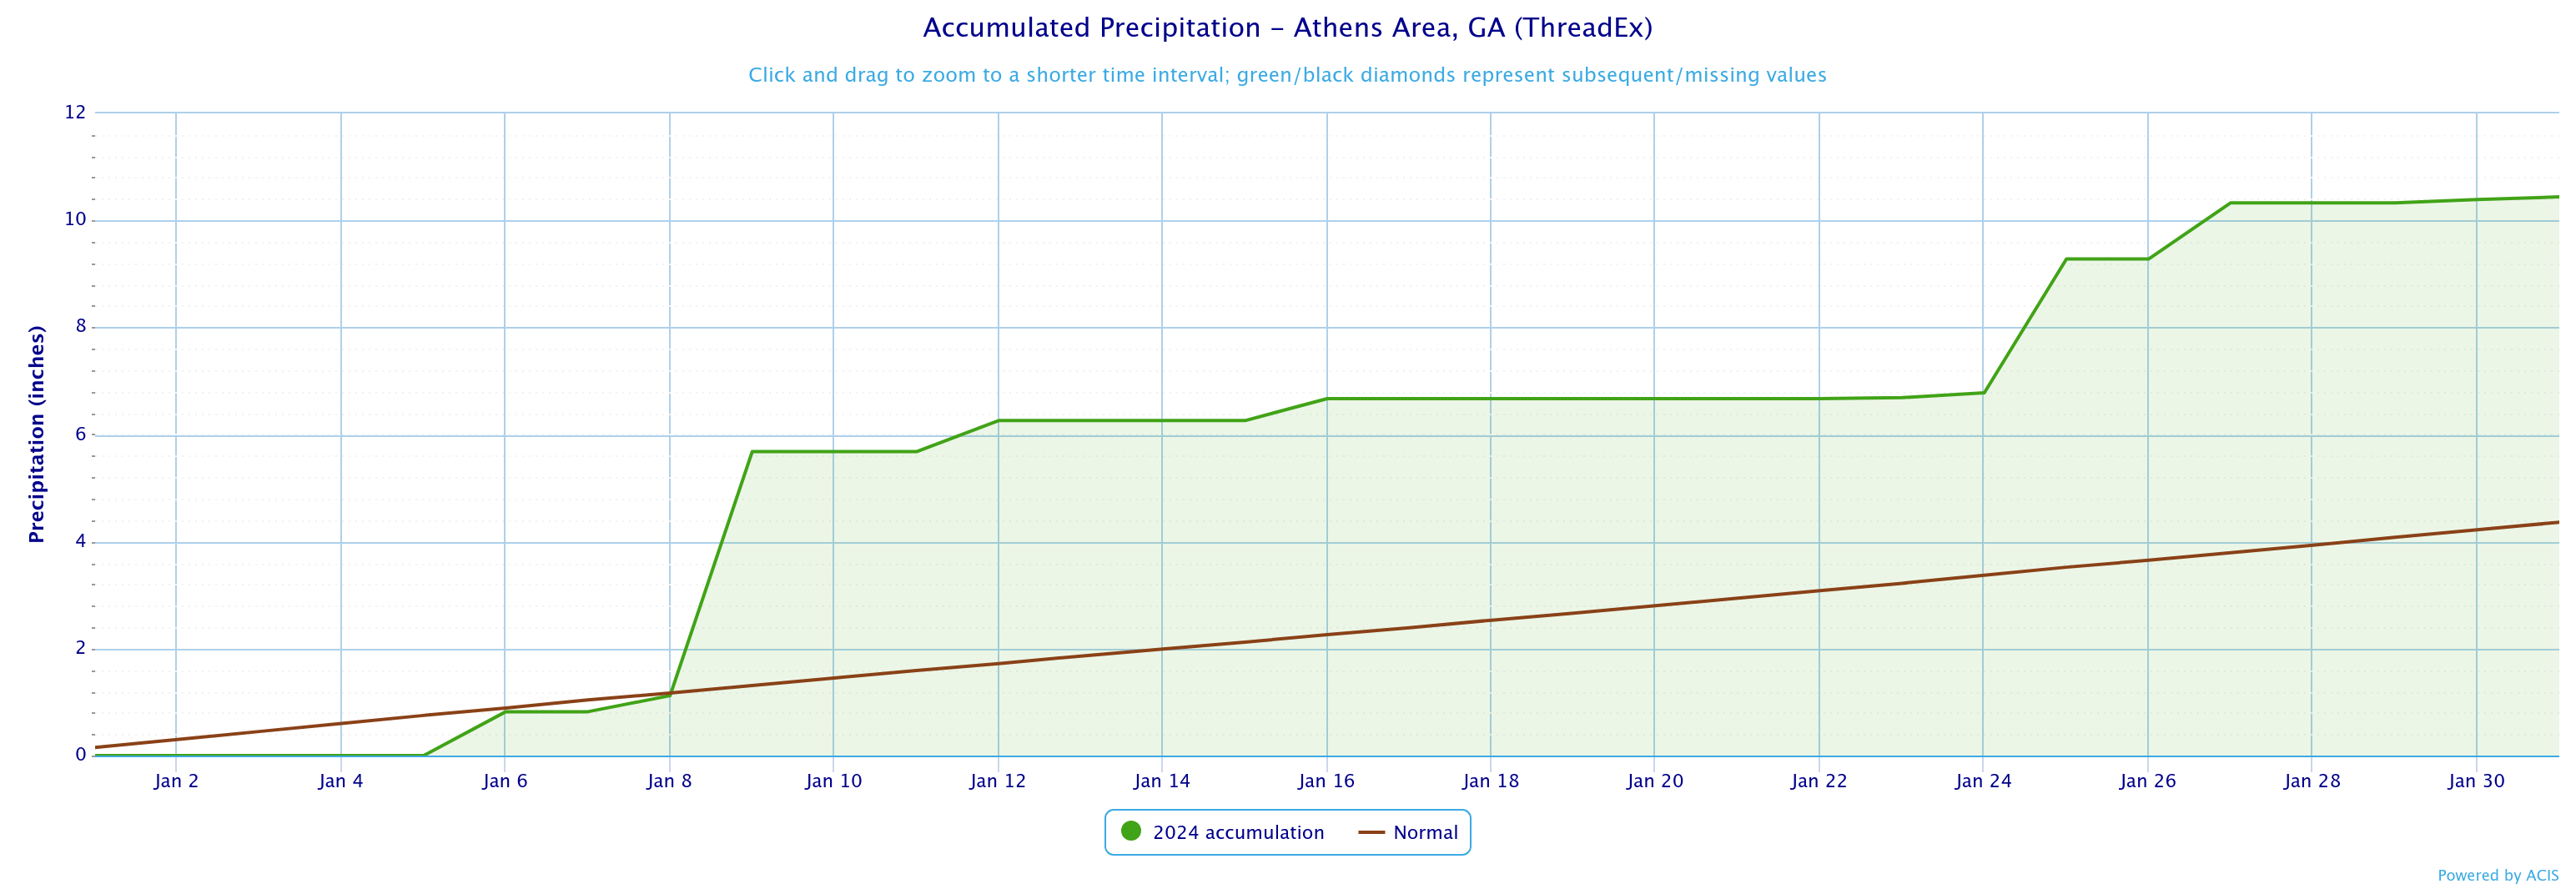
Athens
59th Coldest
2nd Wettest
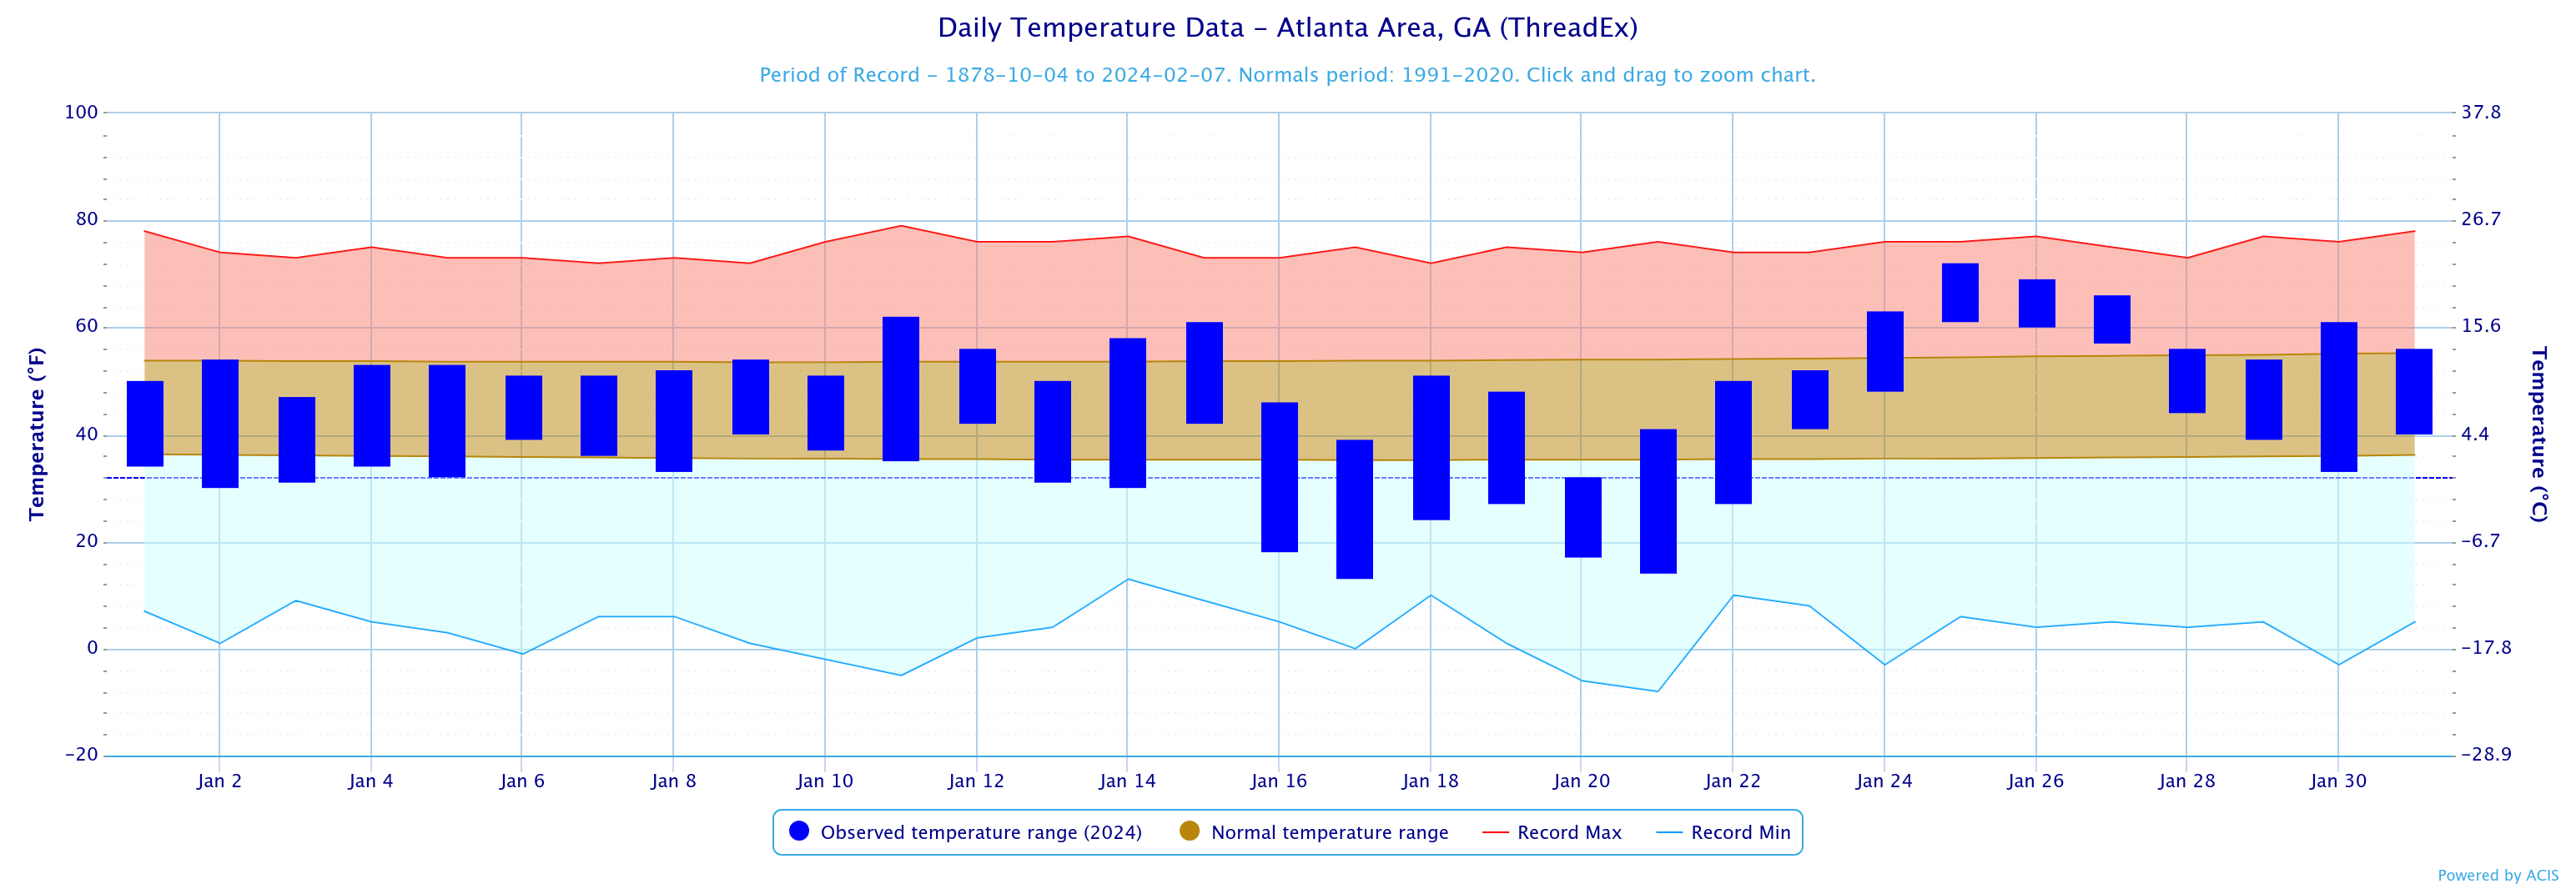
Atlanta
59th Warmest
25th Wettest
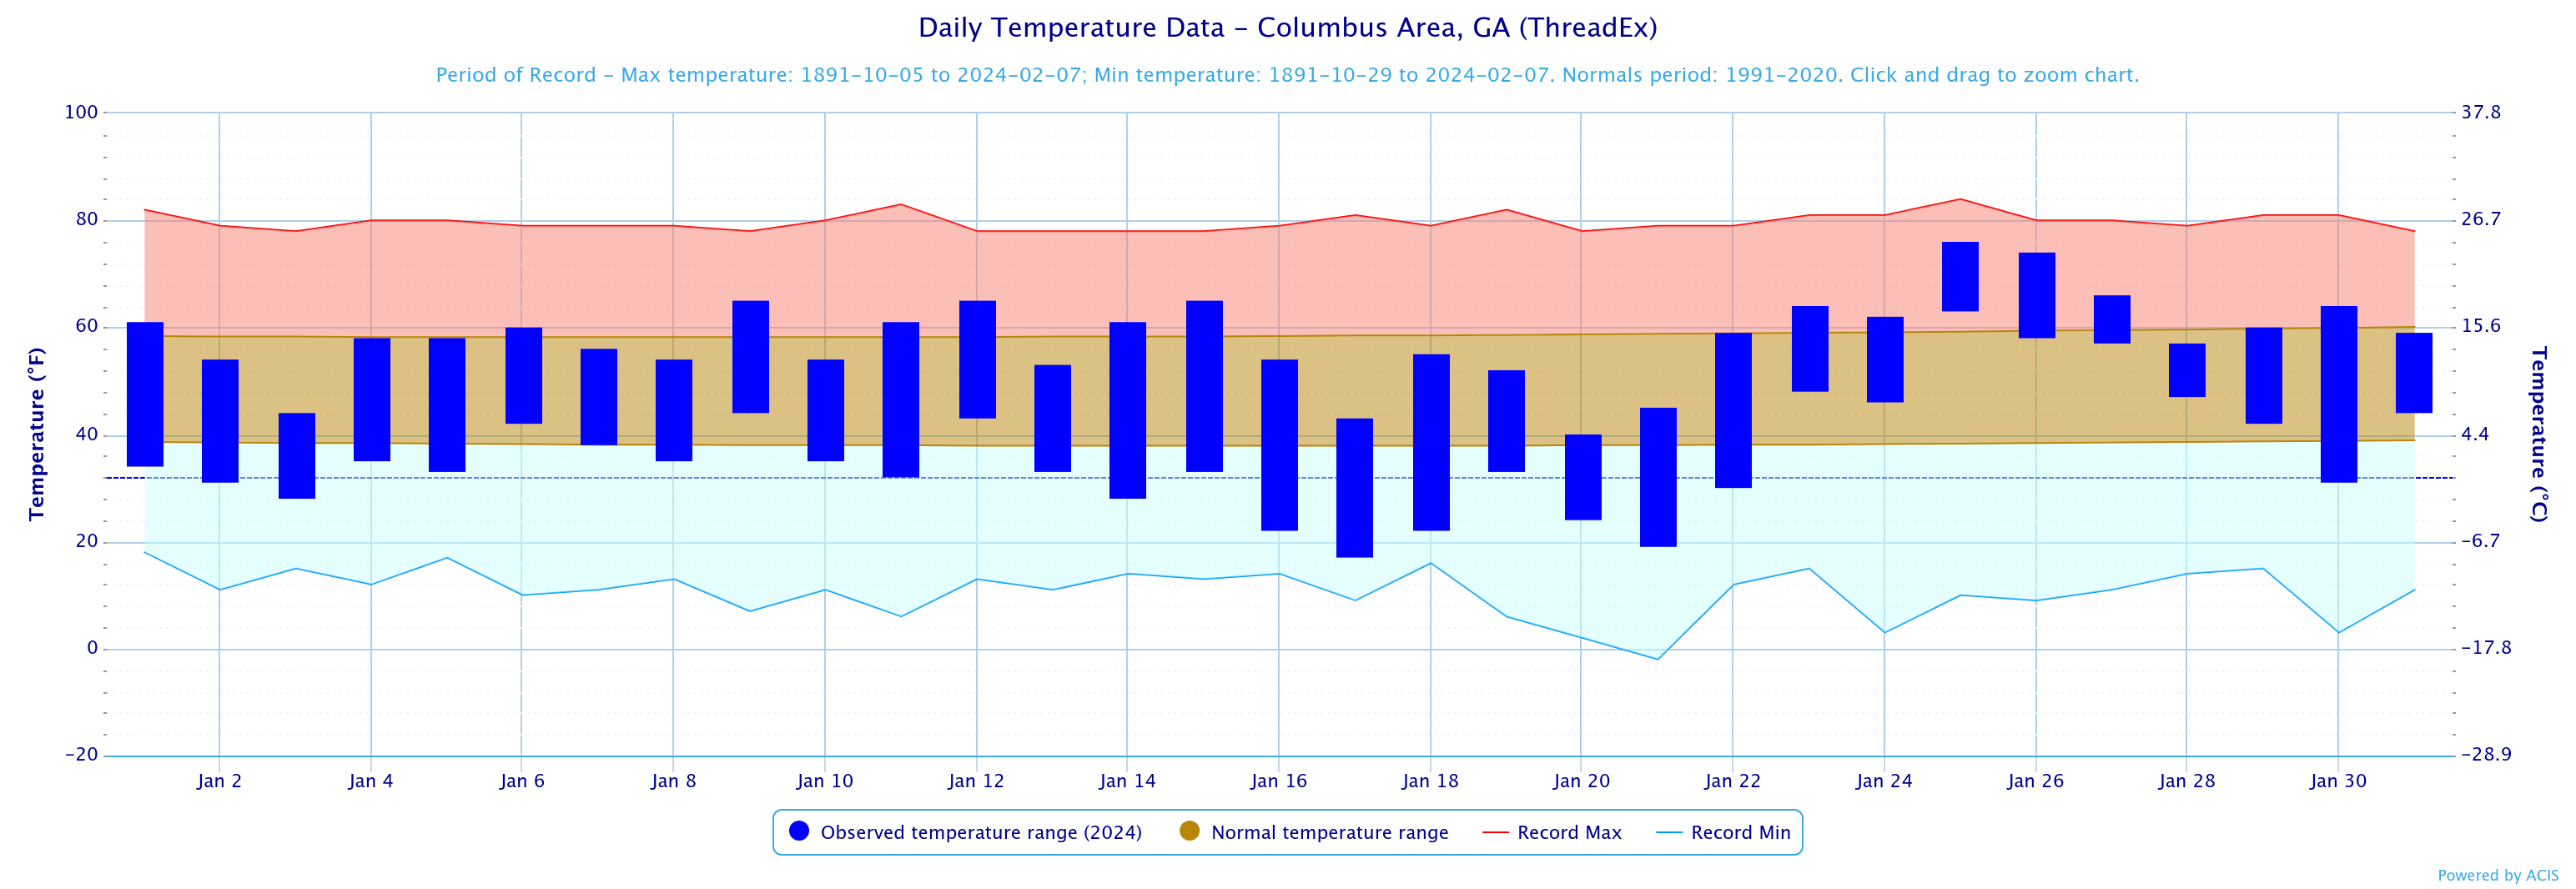
Columbus
56th Coldest
21st Wettest
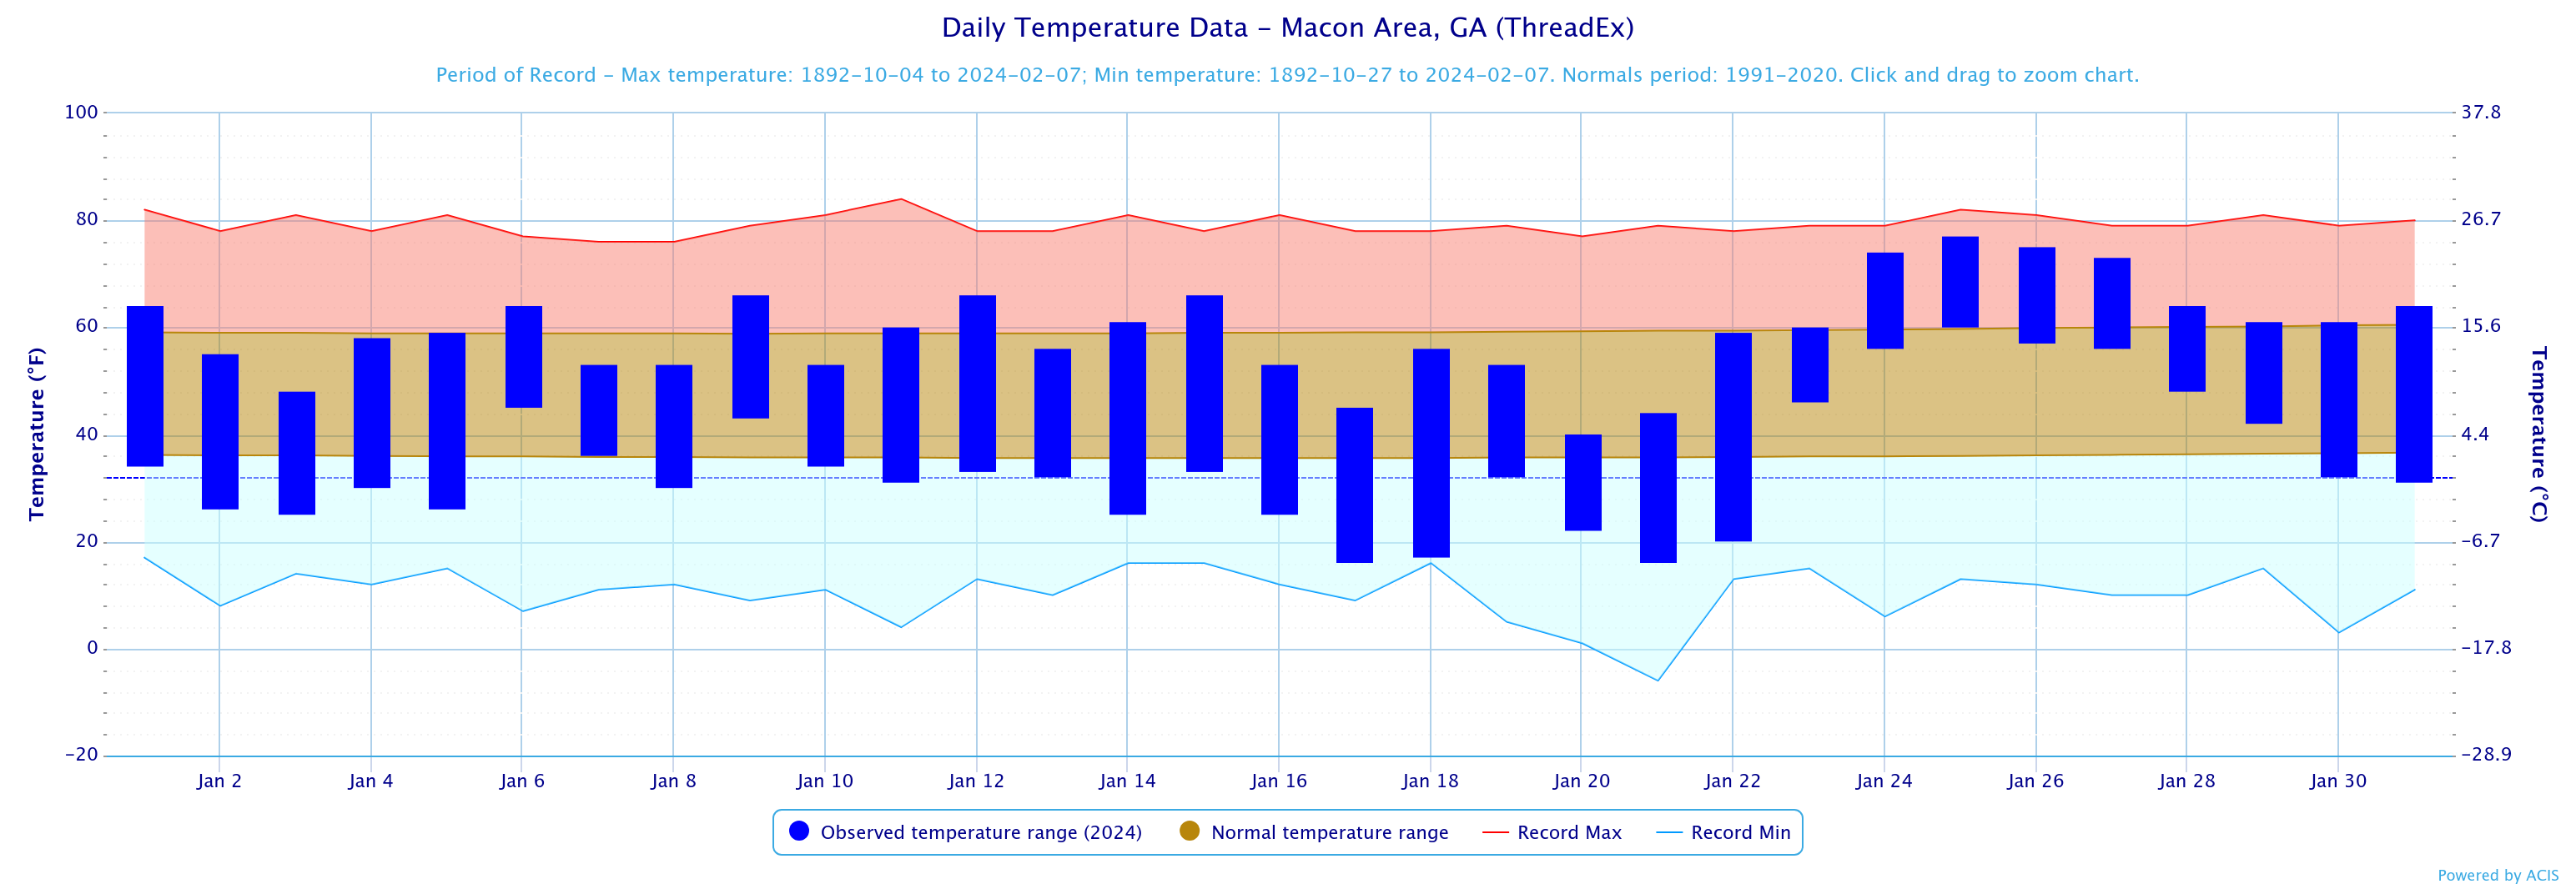
Macon
59th Coldest
27th Wettest
January 2024 Climate Averages
Climate Site
Sep Temp (°F)
Average Temp
Departure from Normal
Athens
43.3
44.3
-1.0
Atlanta
44.3
44.8
1
Columbus
47.2
48.5
-1.3
Macon
46.8
47.6
-0.8
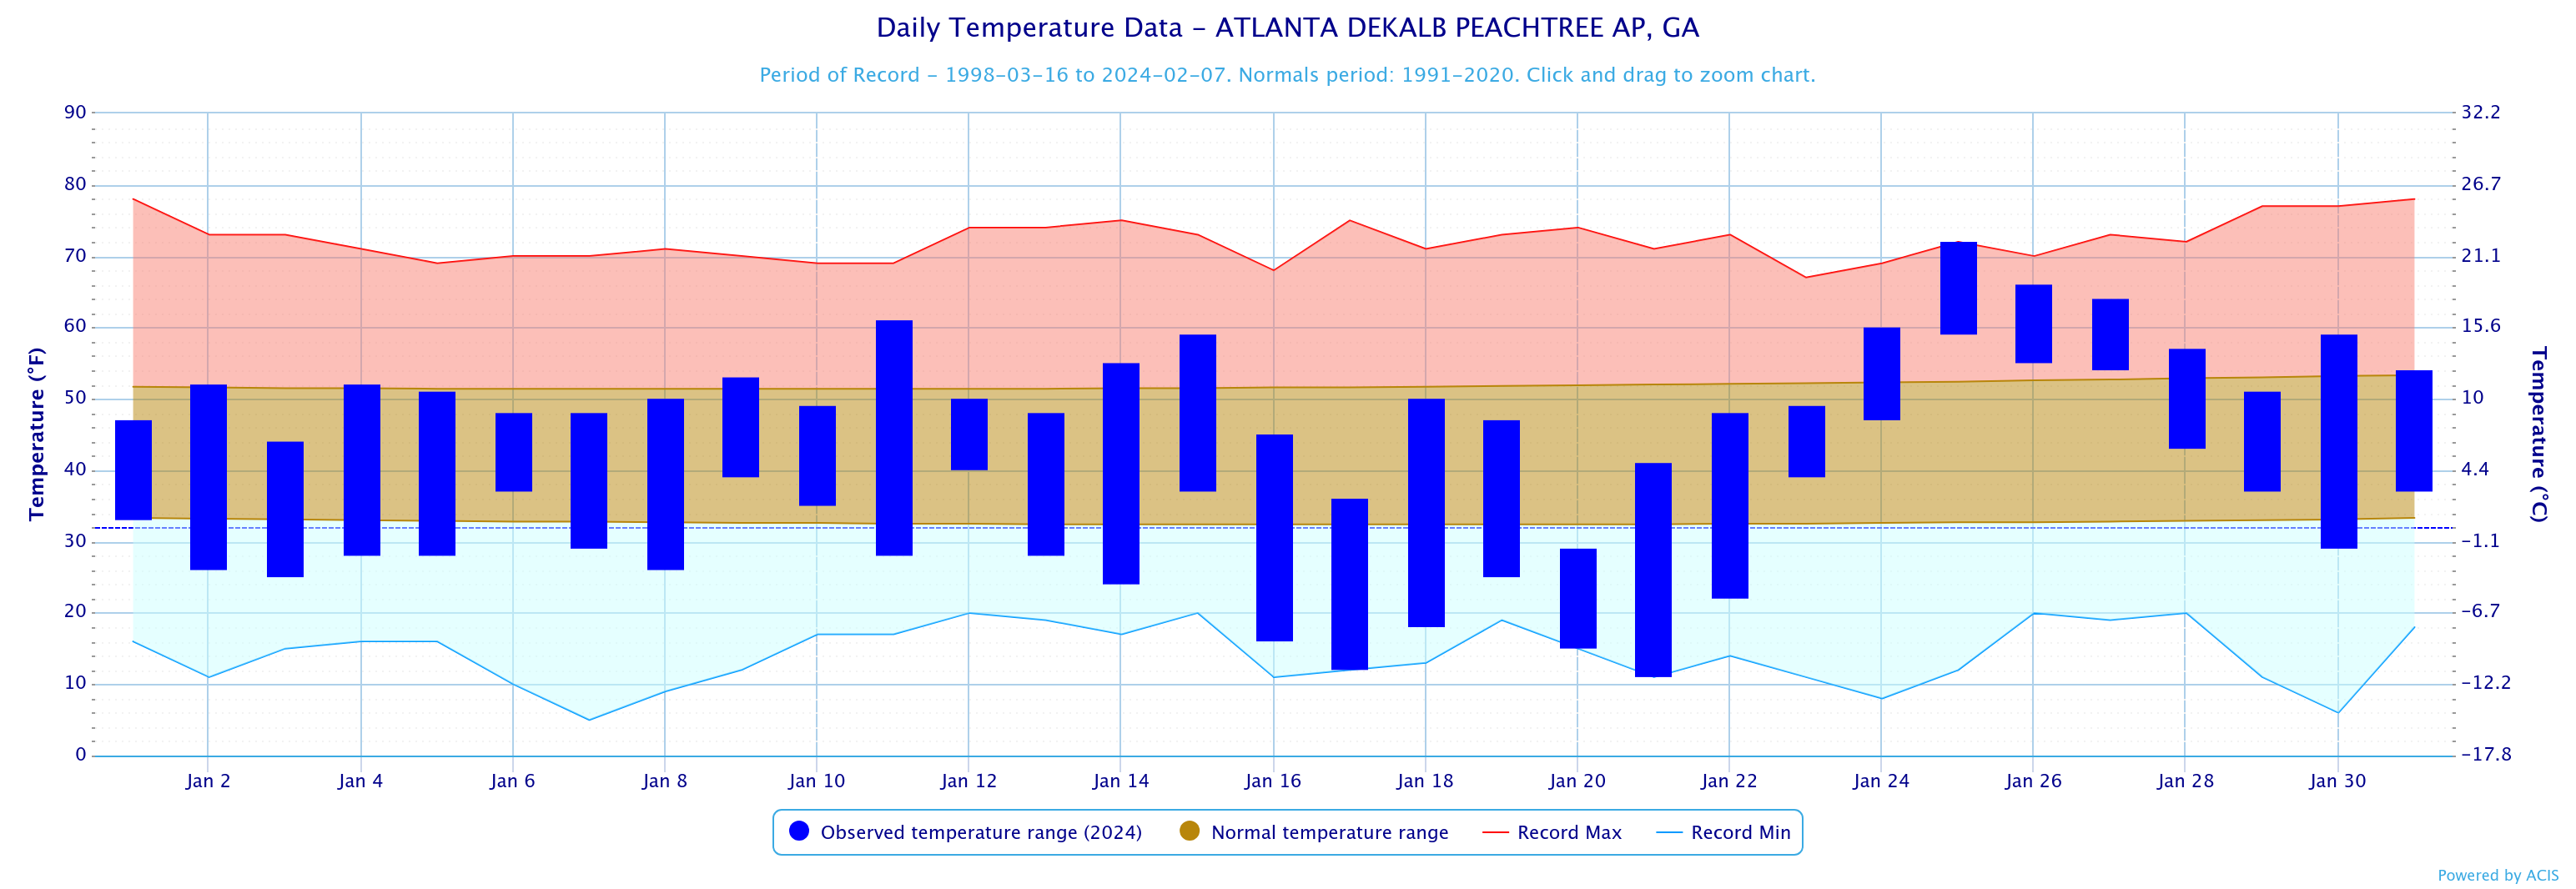
Dekalb Peachtree Arpt
41.6
42.3
-0.7
Fulton Co Arpt
42.5
43.6
-1.1
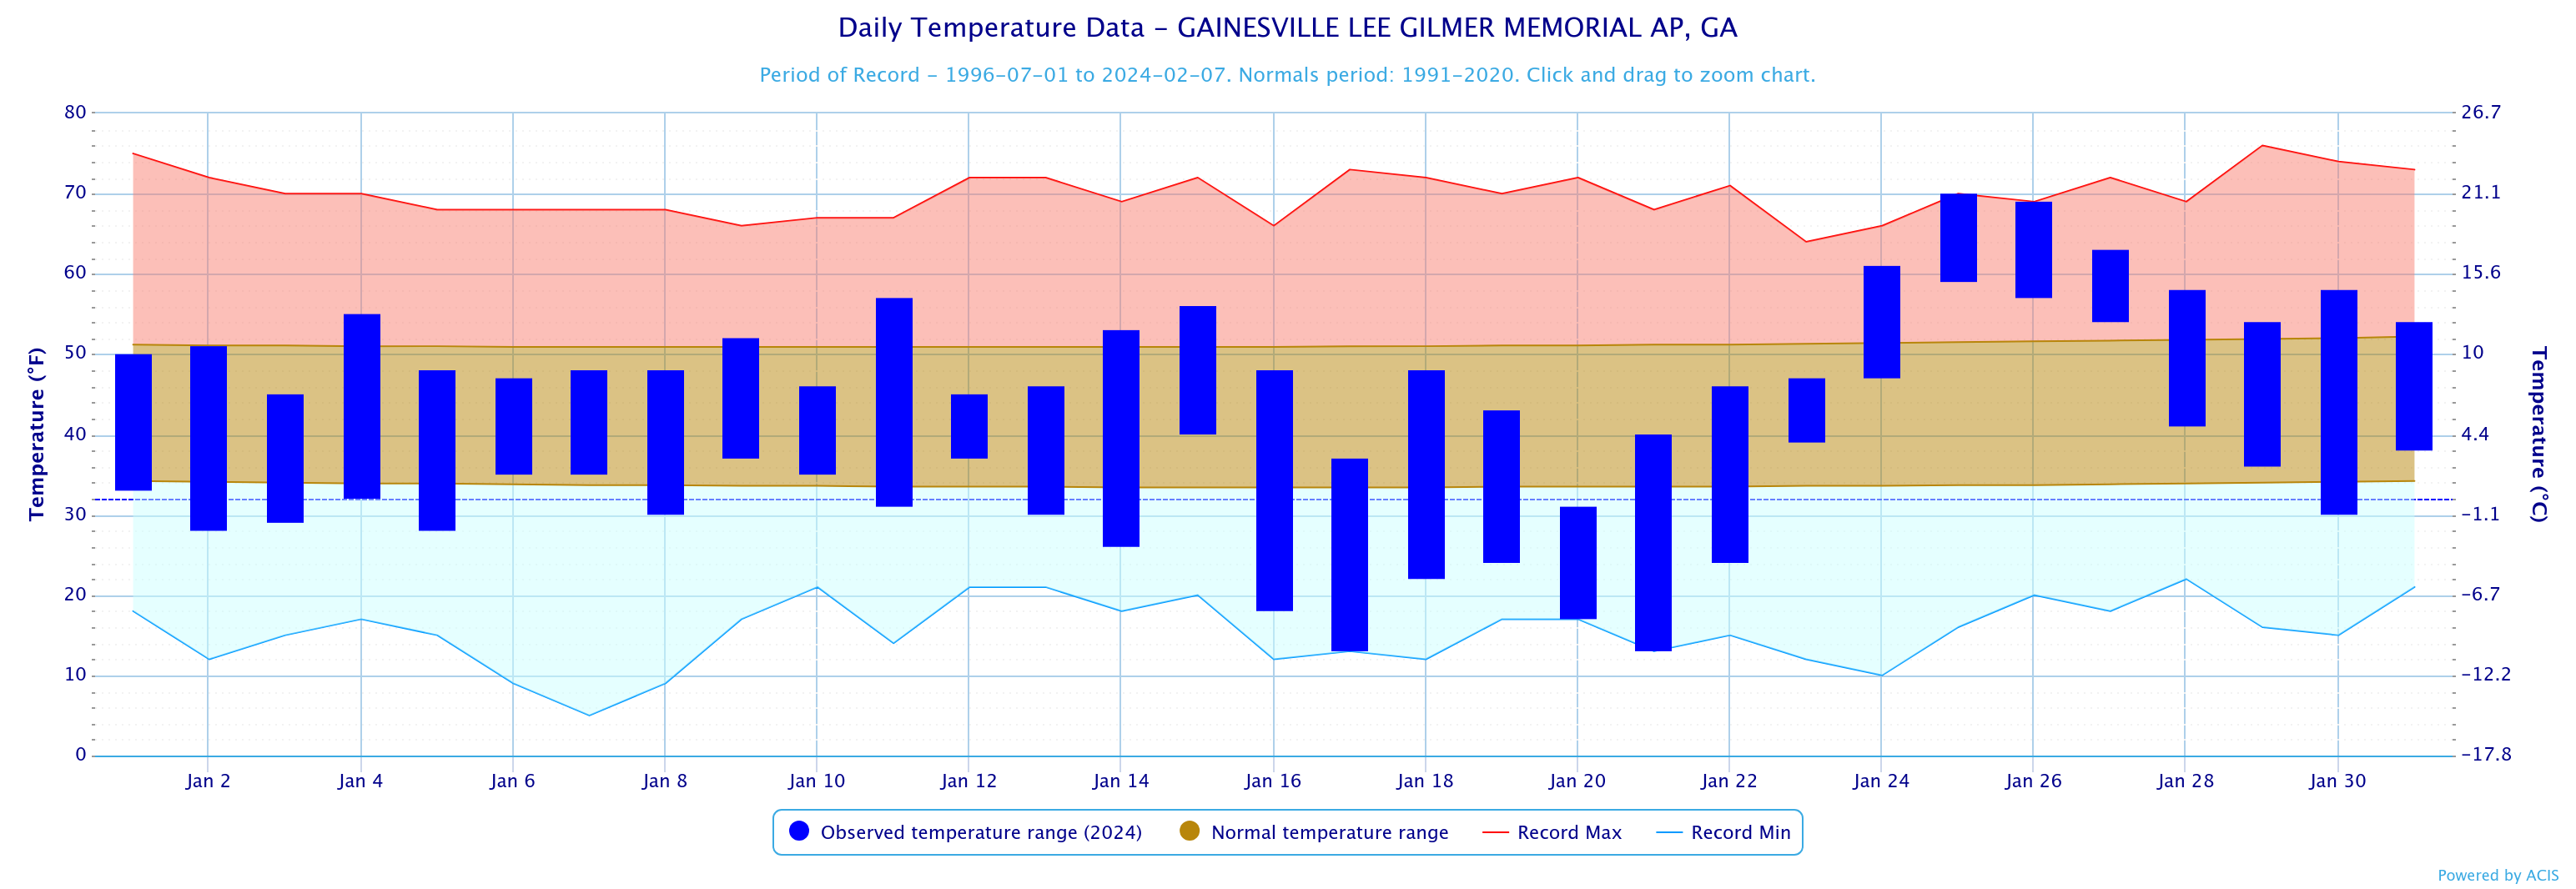
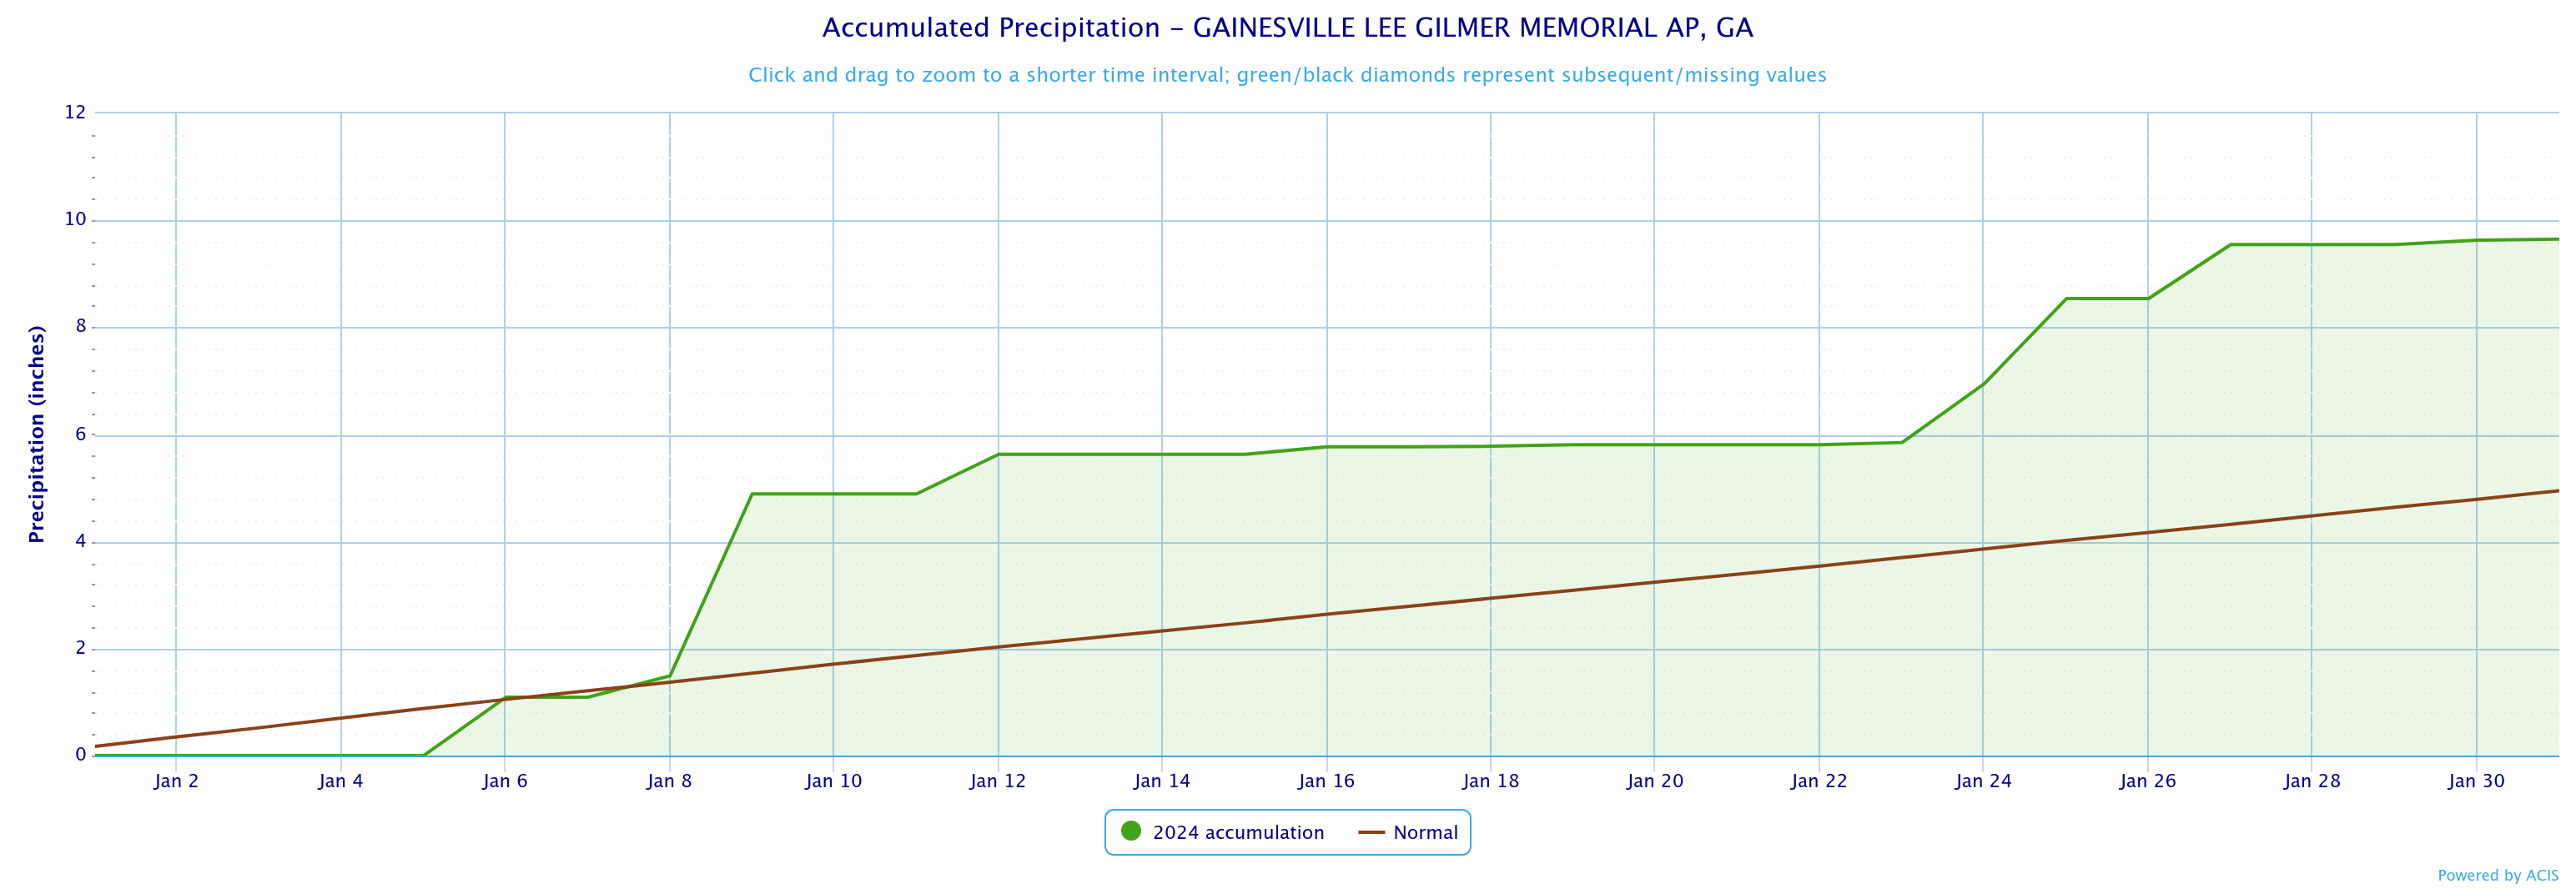
Gainesville
41.8
42.4
-0.6
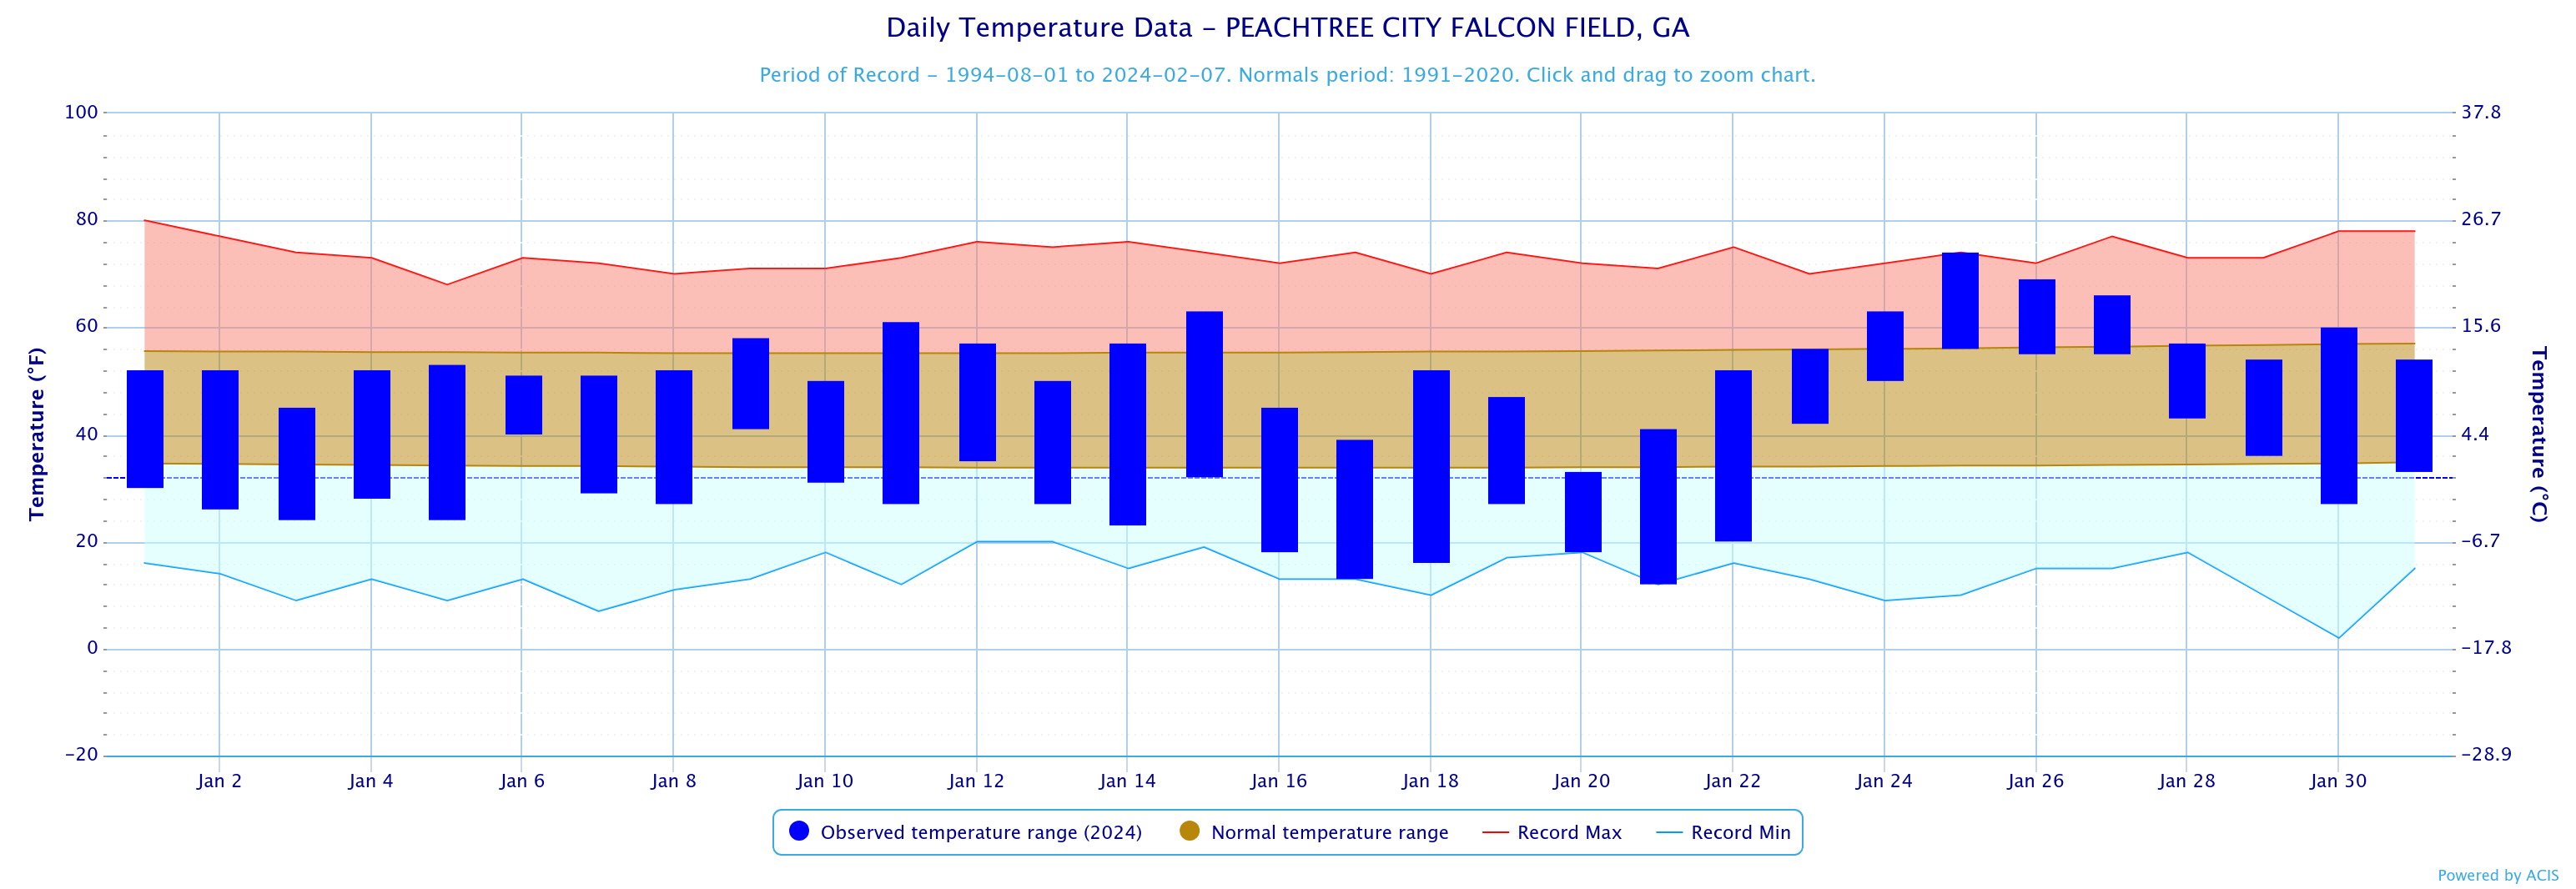
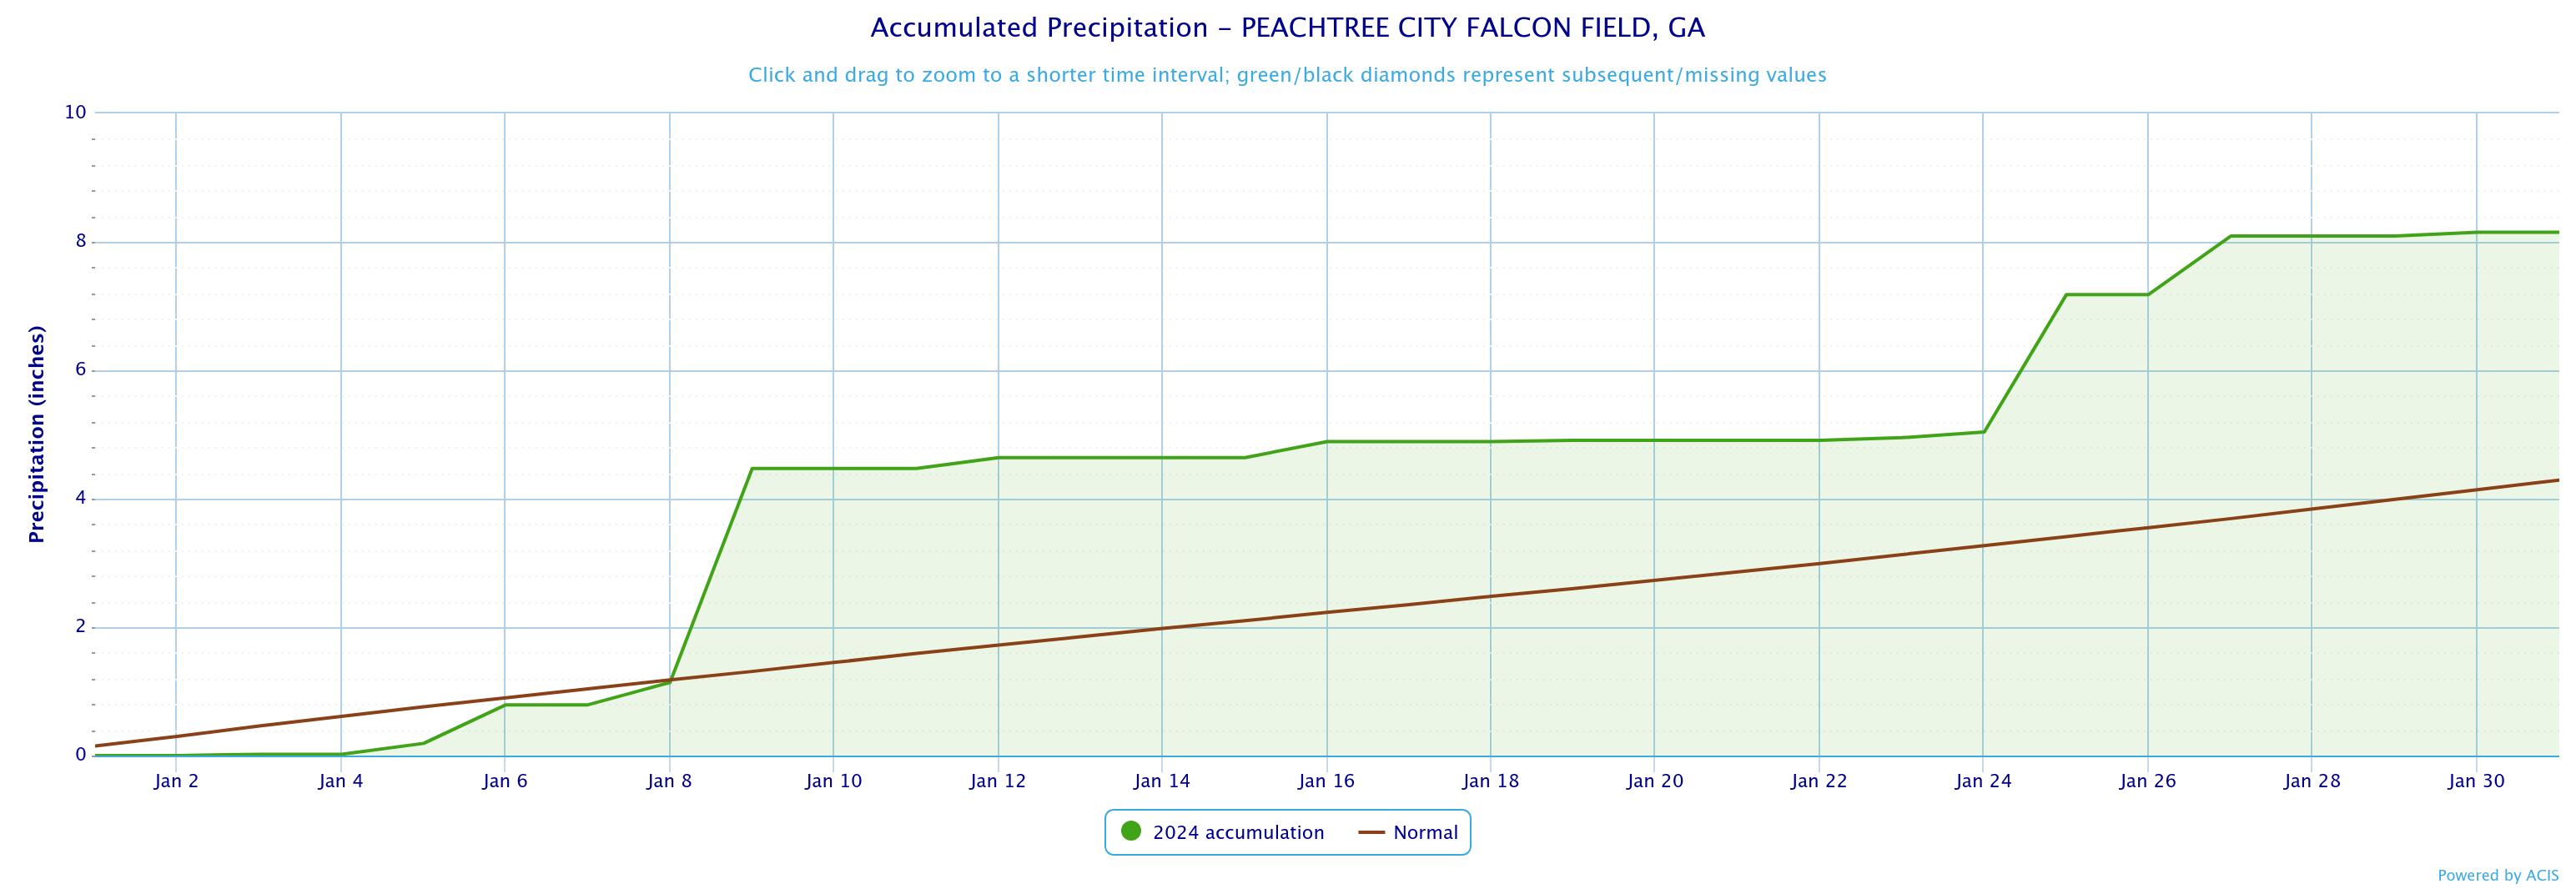
Peachtree City
42.4
44.9
-2.5
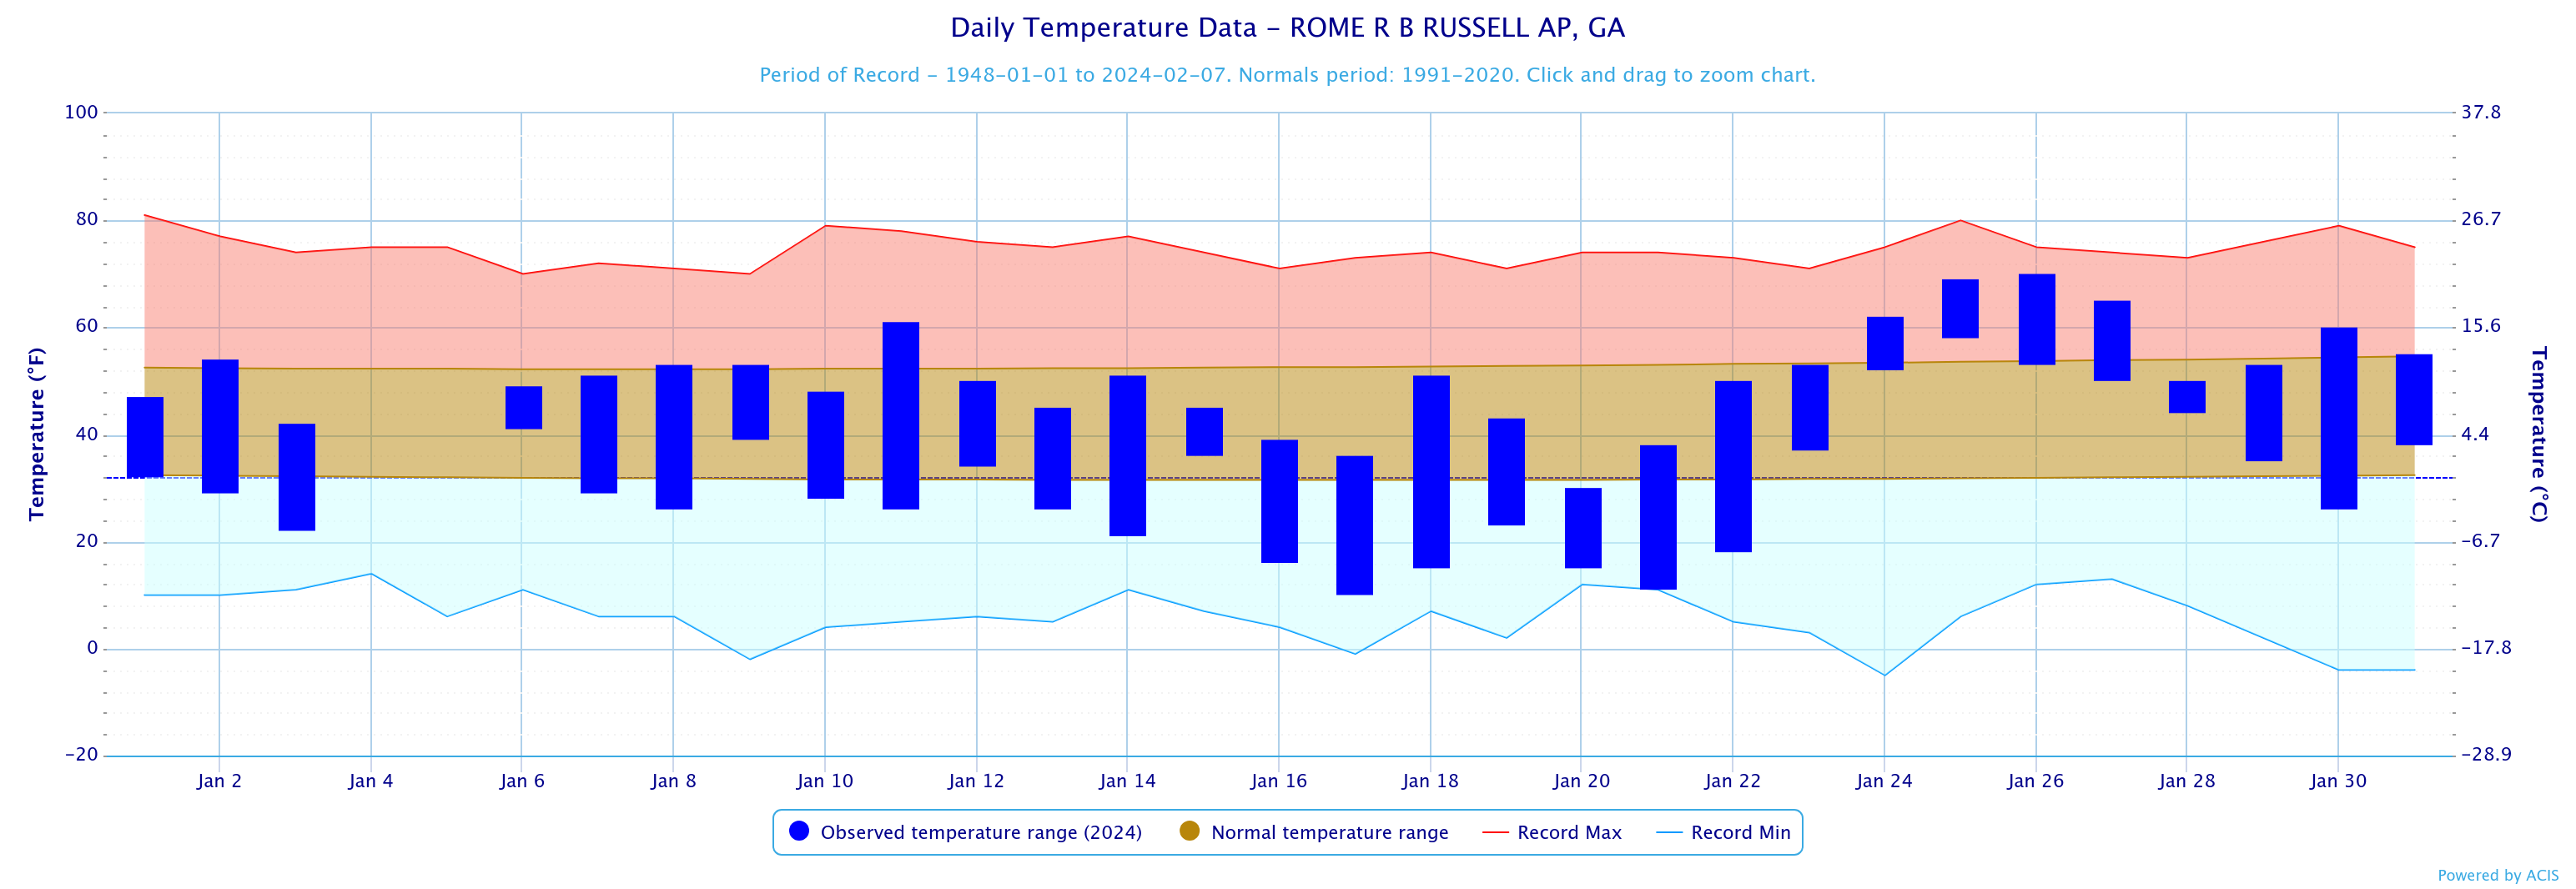
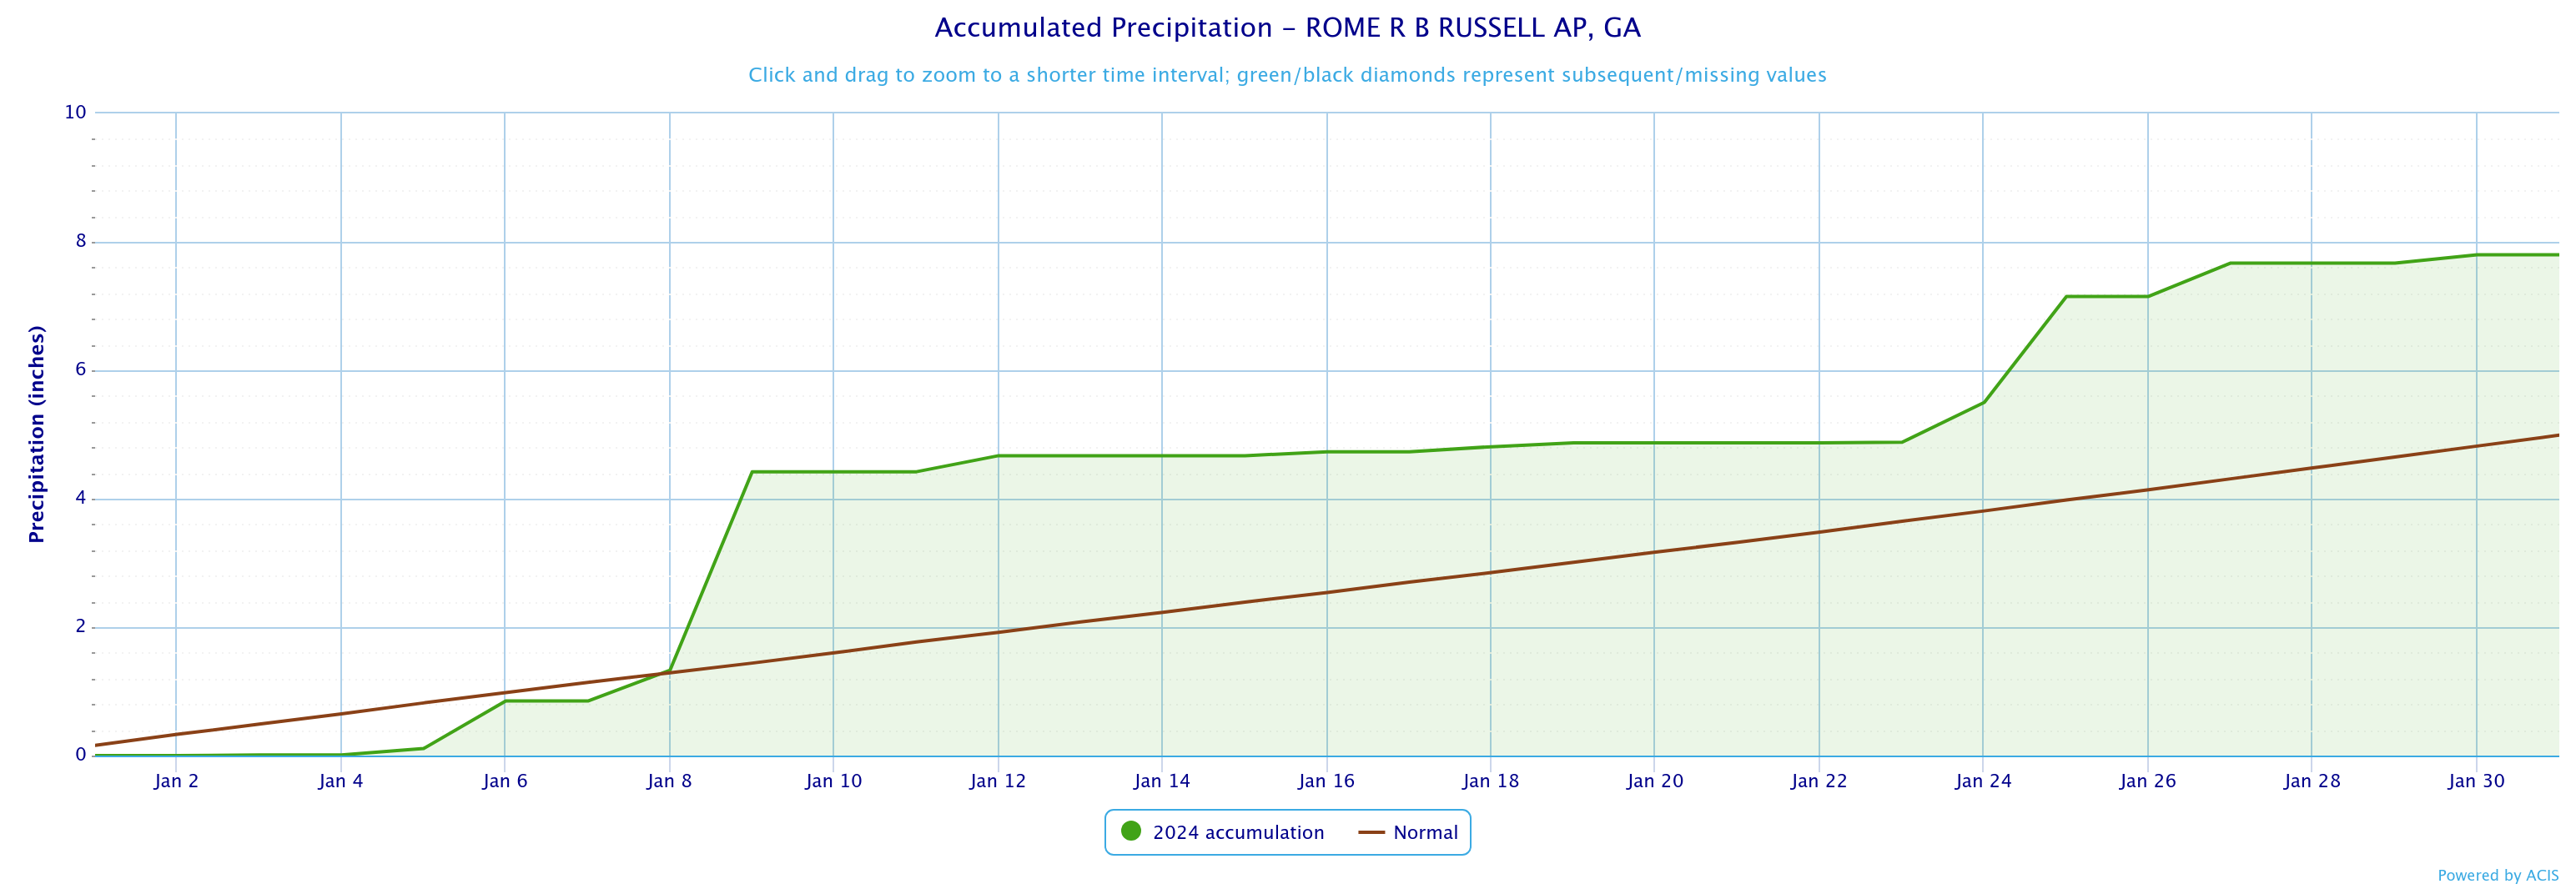
Rome
40.7
42.3
-1.6
January 2024 Temperature Climate Statistics
Minimum Temperature
Min T Date
Athens
74
1/25
13
1/21
Atlanta
72
1/25
13
1/17
Columbus
76
1/25
17
1/17
Macon
77
1/25
16
1/17
Dekalb Peachtree Arpt
72
1/25
11
1/21
Fulton Co Arpt
72
1/25
12
1/17,21
Gainesville
70
1/25
13
1/17,21
Peachtree City
74
1/25
12
1/21
Rome
70
1/26
10
1/17
January 2024 Precipitation Climate Statistics
Average Precipitation
From Normal)
Athens
10.44
4.36
6.08
Atlanta
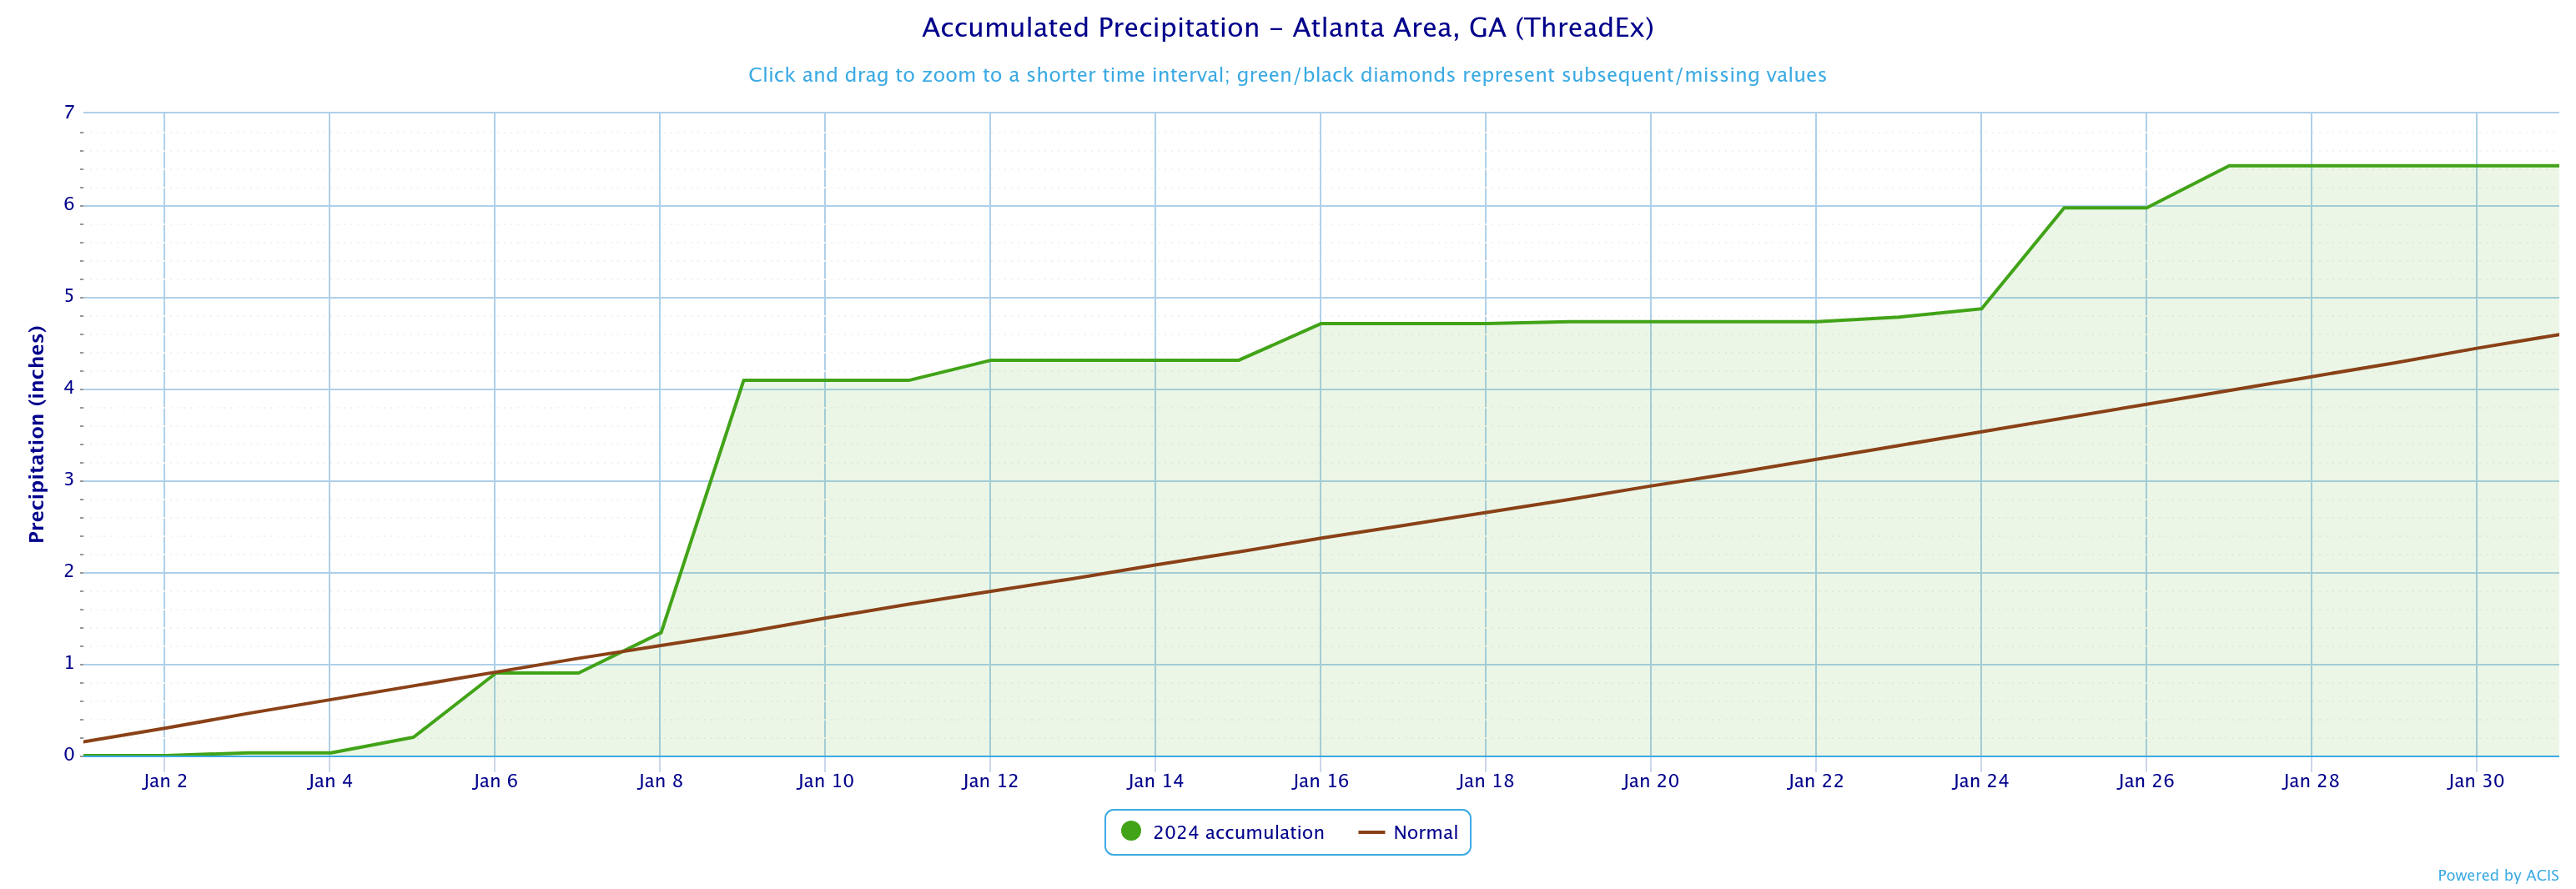
7.23
4.56
2.64
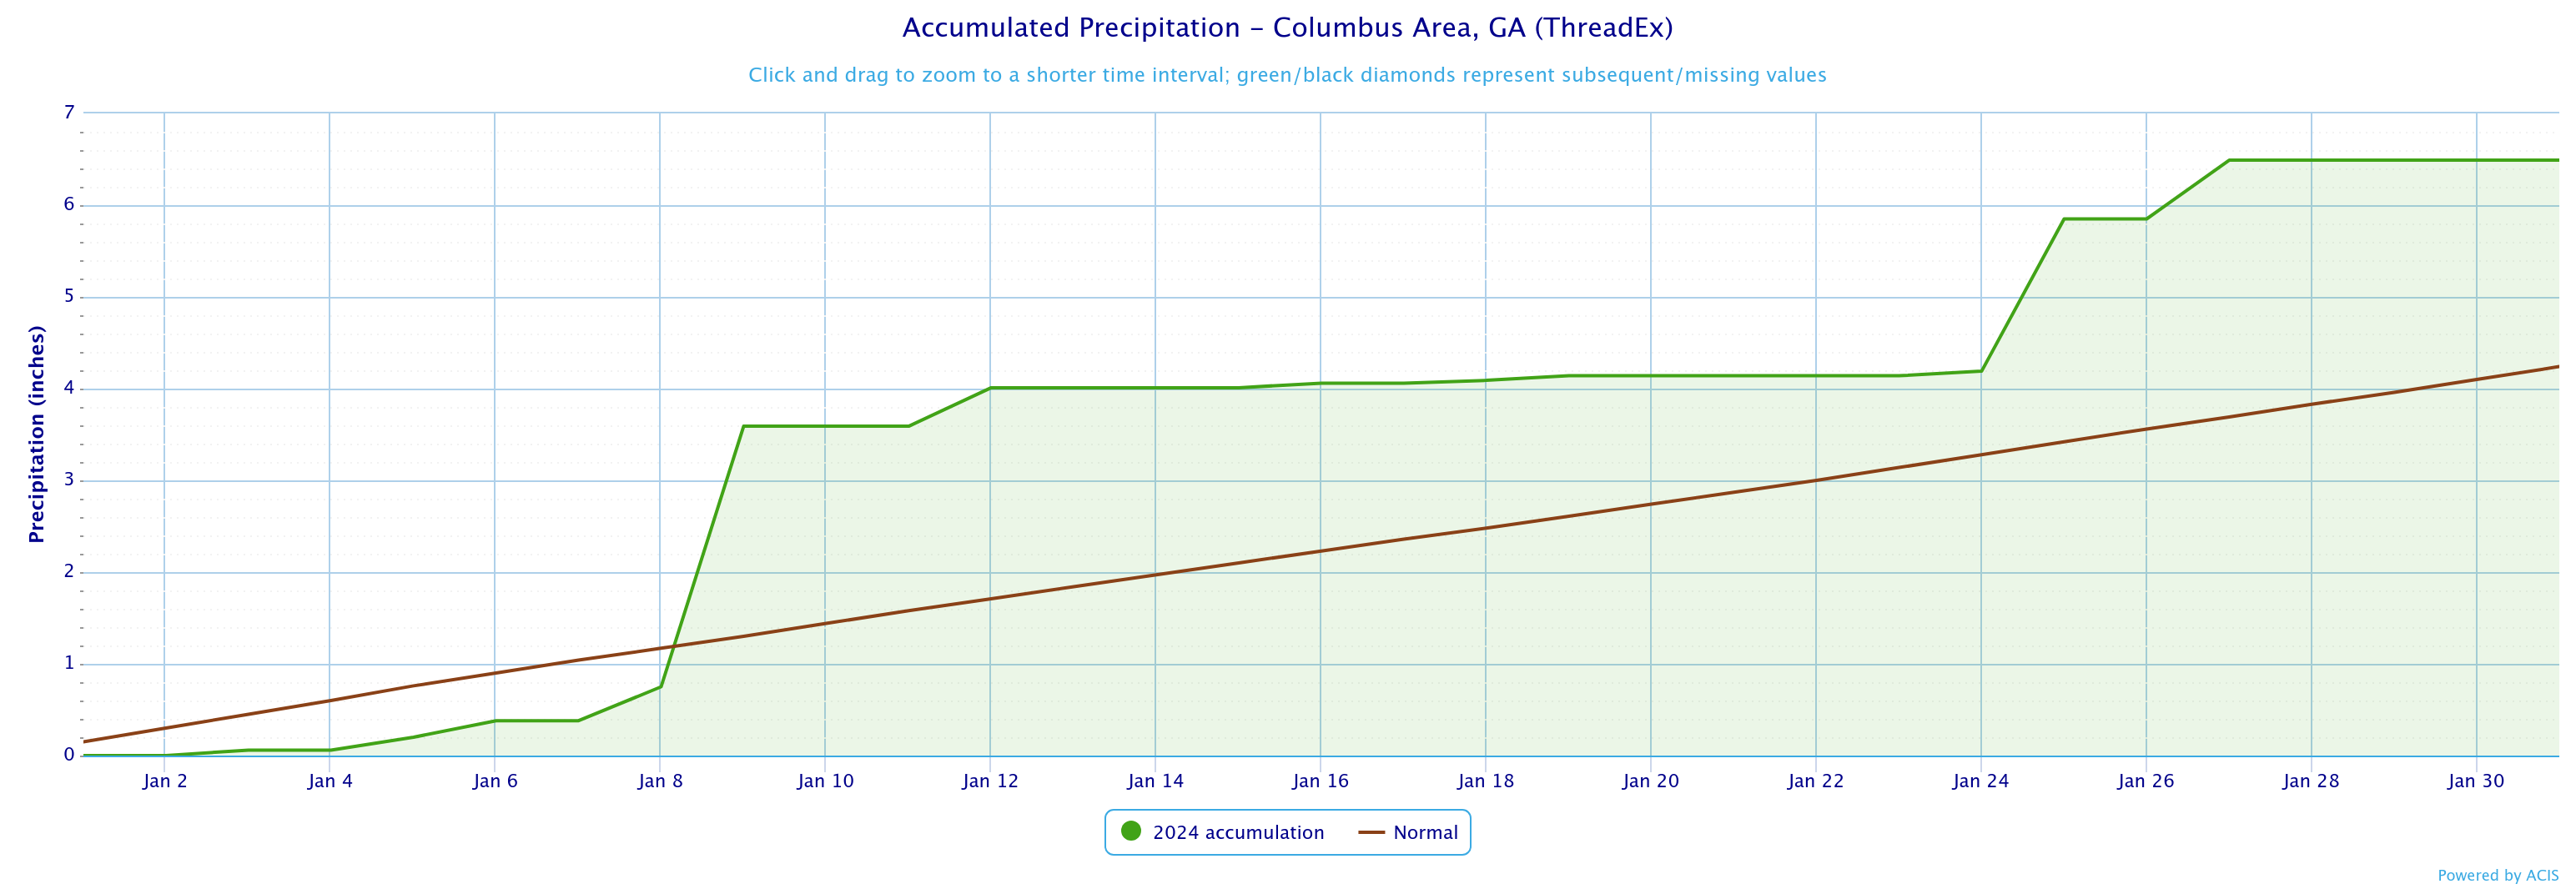
Columbus
6.59
4.24
2.35
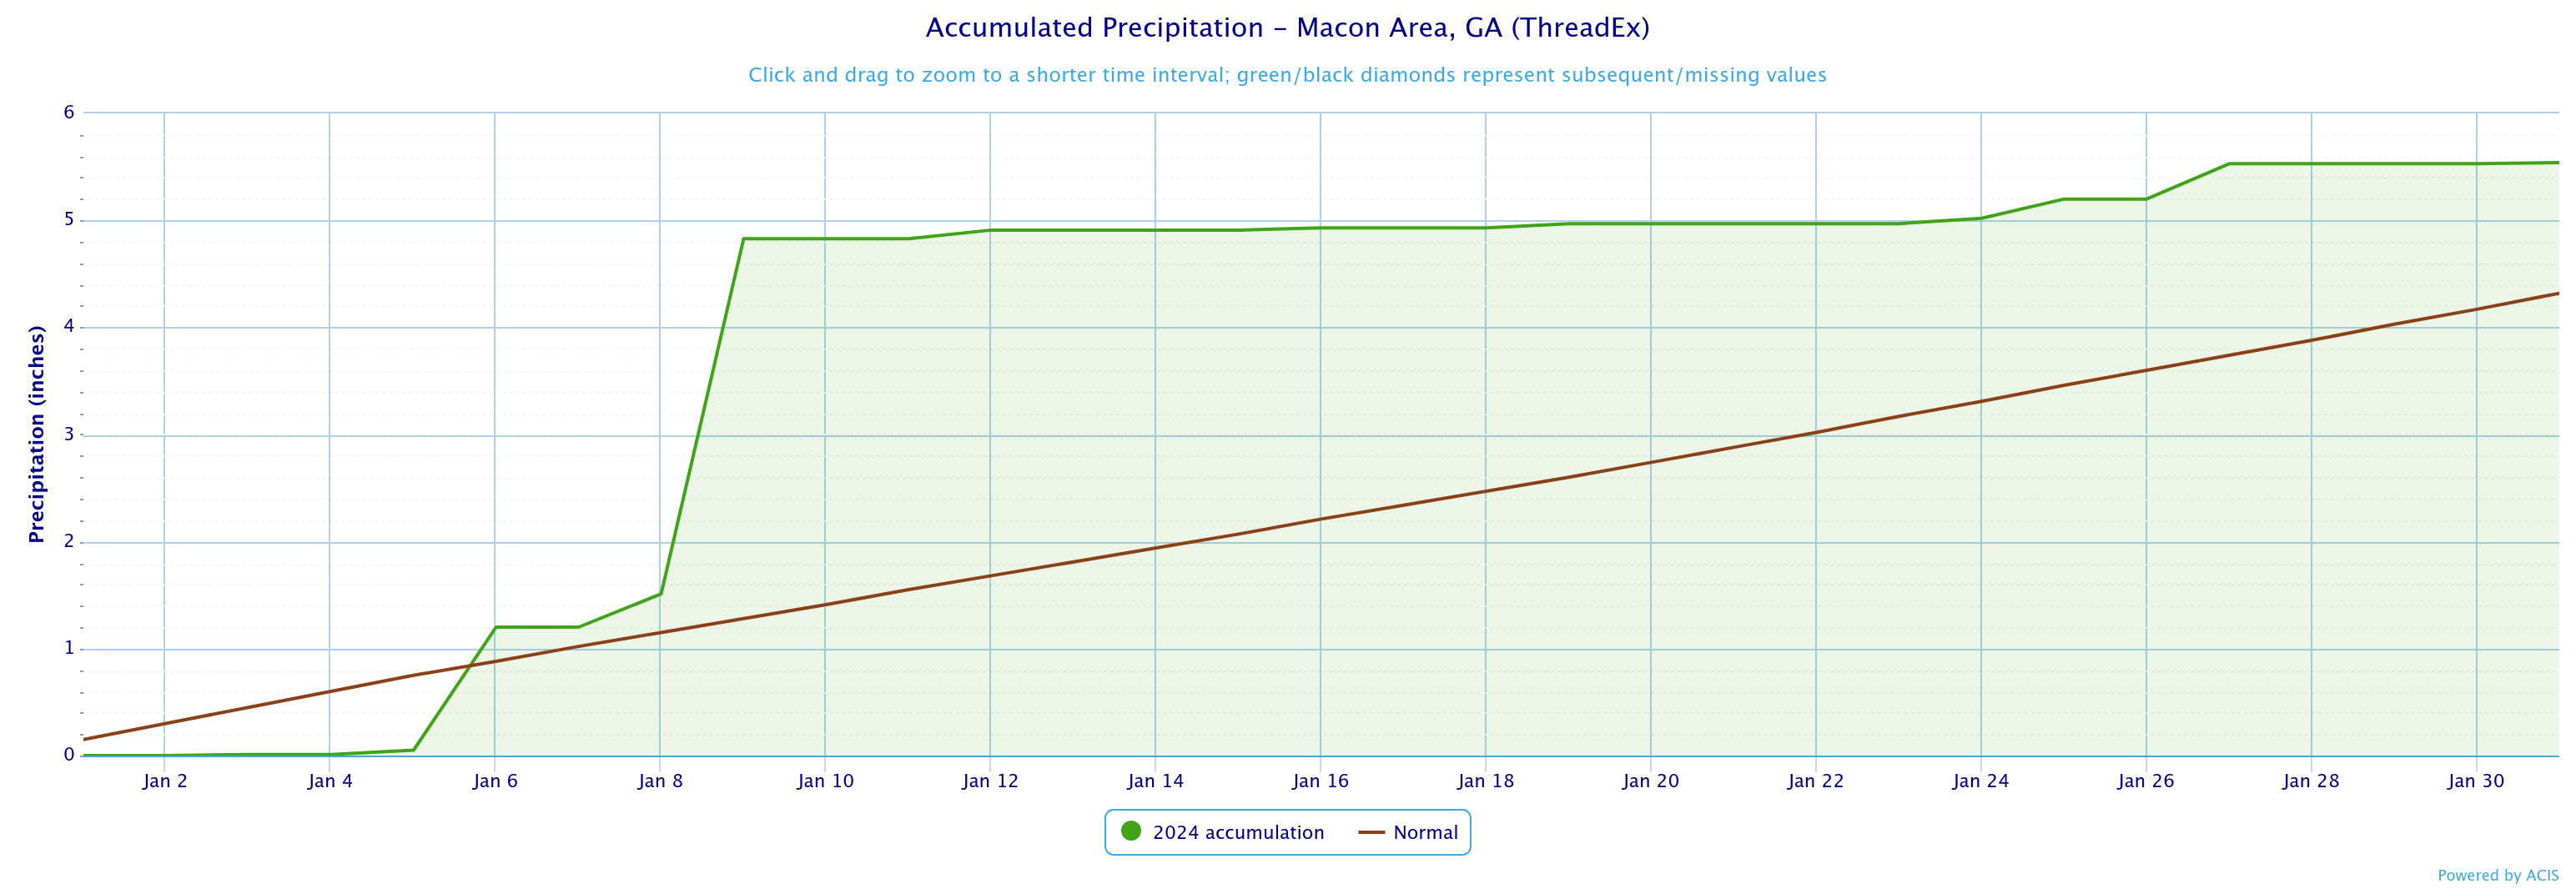
Macon
5.54
4.32
1.22
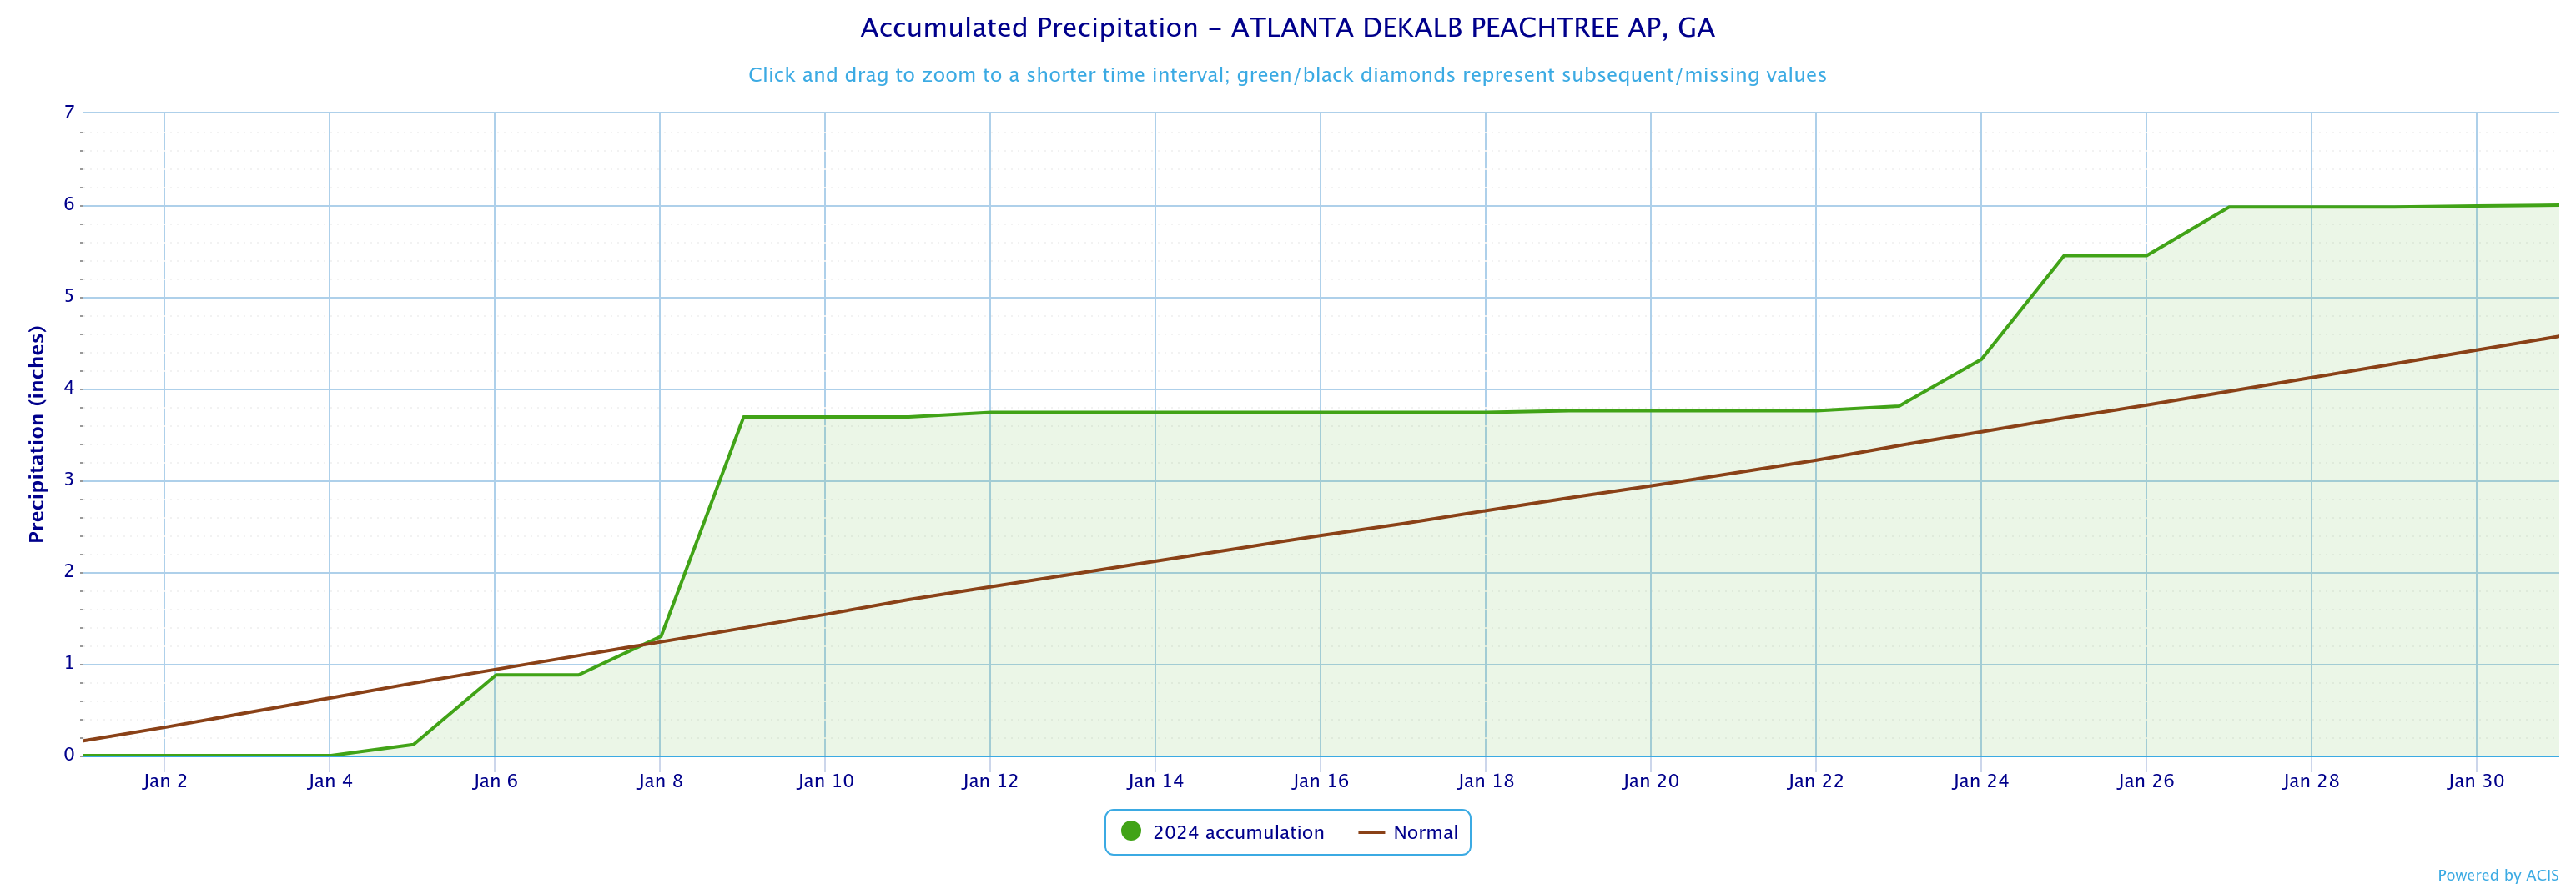
Dekalb Peachtree Arpt
6
4.57
1.43
Fulton County Arpt
6.49
4.25
2.24
Gainesville
9.65
4.95
4.70
Peachtree City
8.15
4.29
3.86
Rome
7.8
4.99
2.81
January 2024 Precipitation Climate Statistics
Athens
4.56
1/9
Atlanta
3.19
1/9
Columbus
3.21
1/9
Macon
3.63
1/9
Dekalb Peachtree Arpt
2.81
1/9
Fulton Co Arpt
2.68
1/9
Gainesville
3.78
1/9
Peachtree City
3.68
1/9
Rome
3.57
1/9
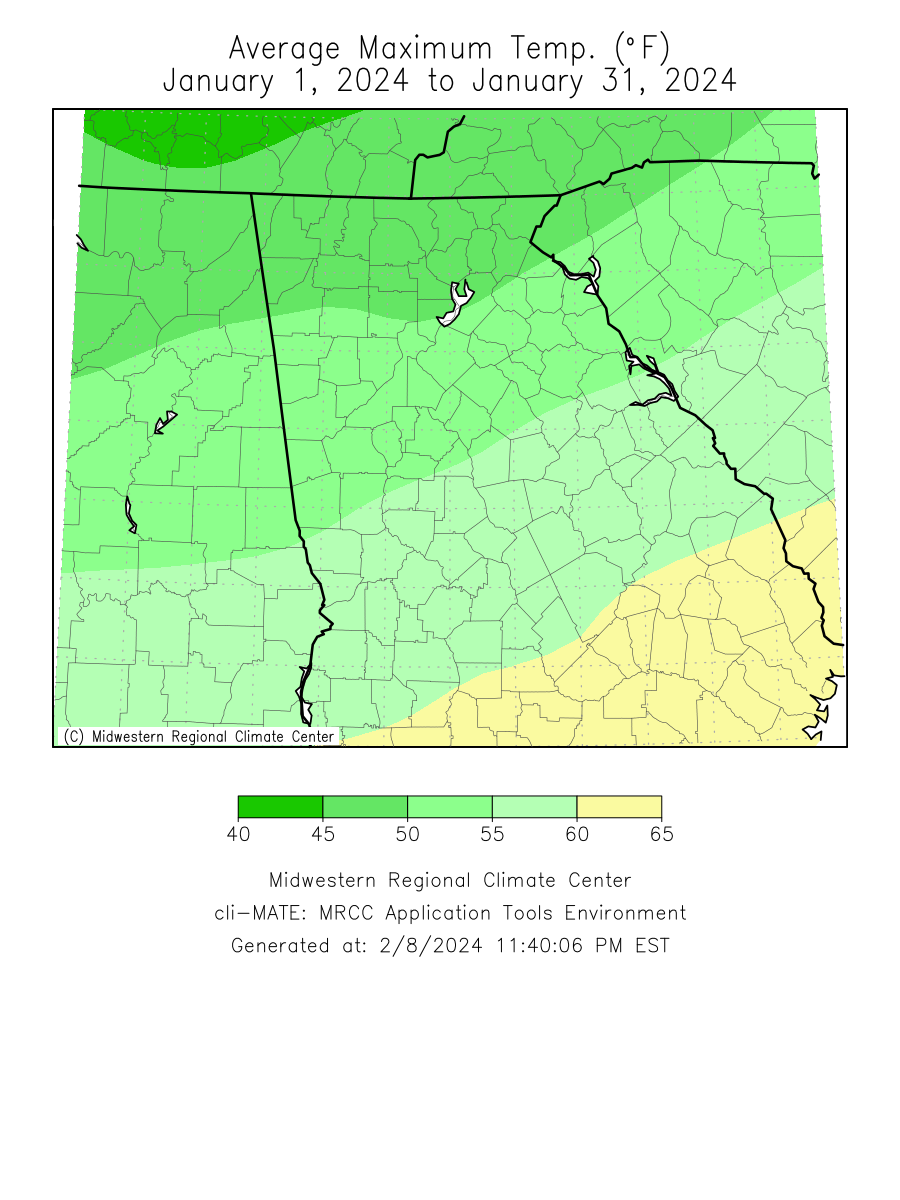
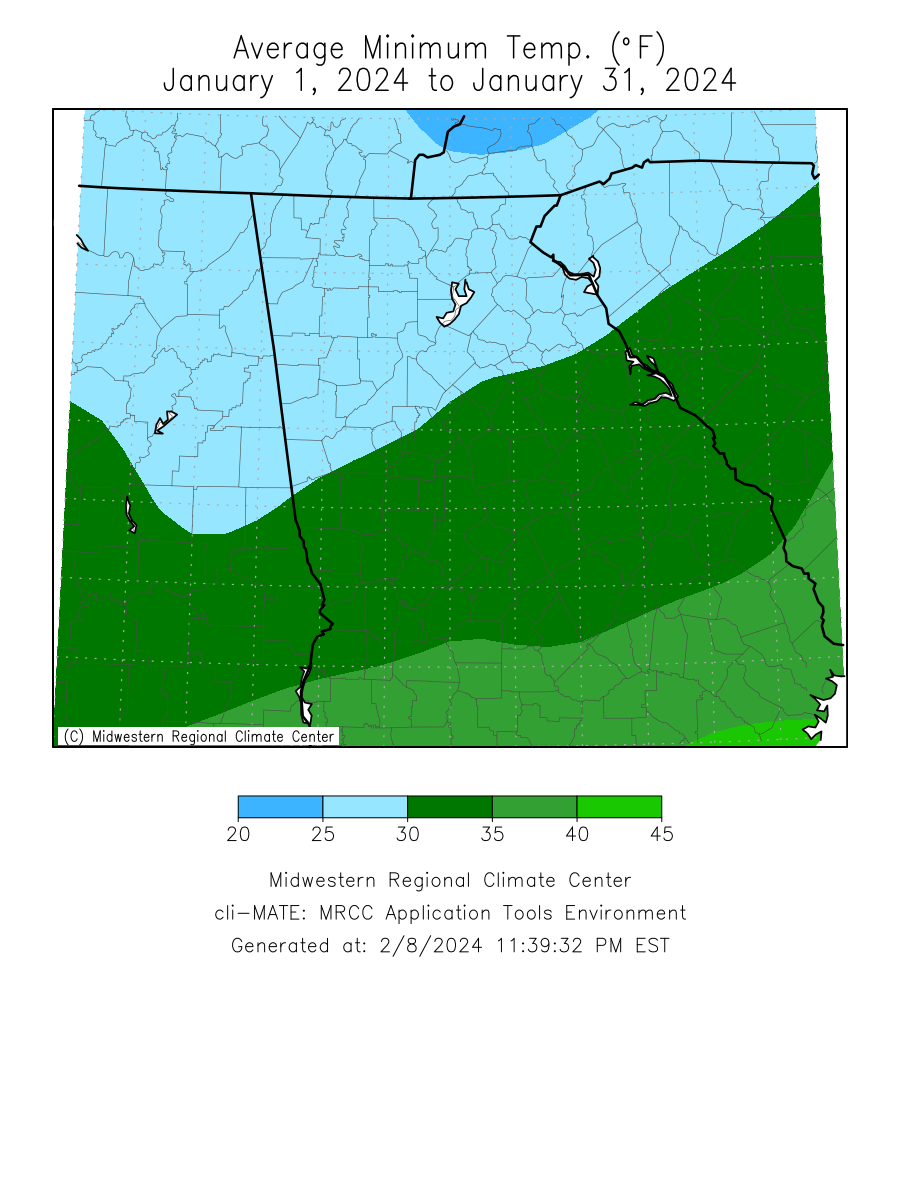
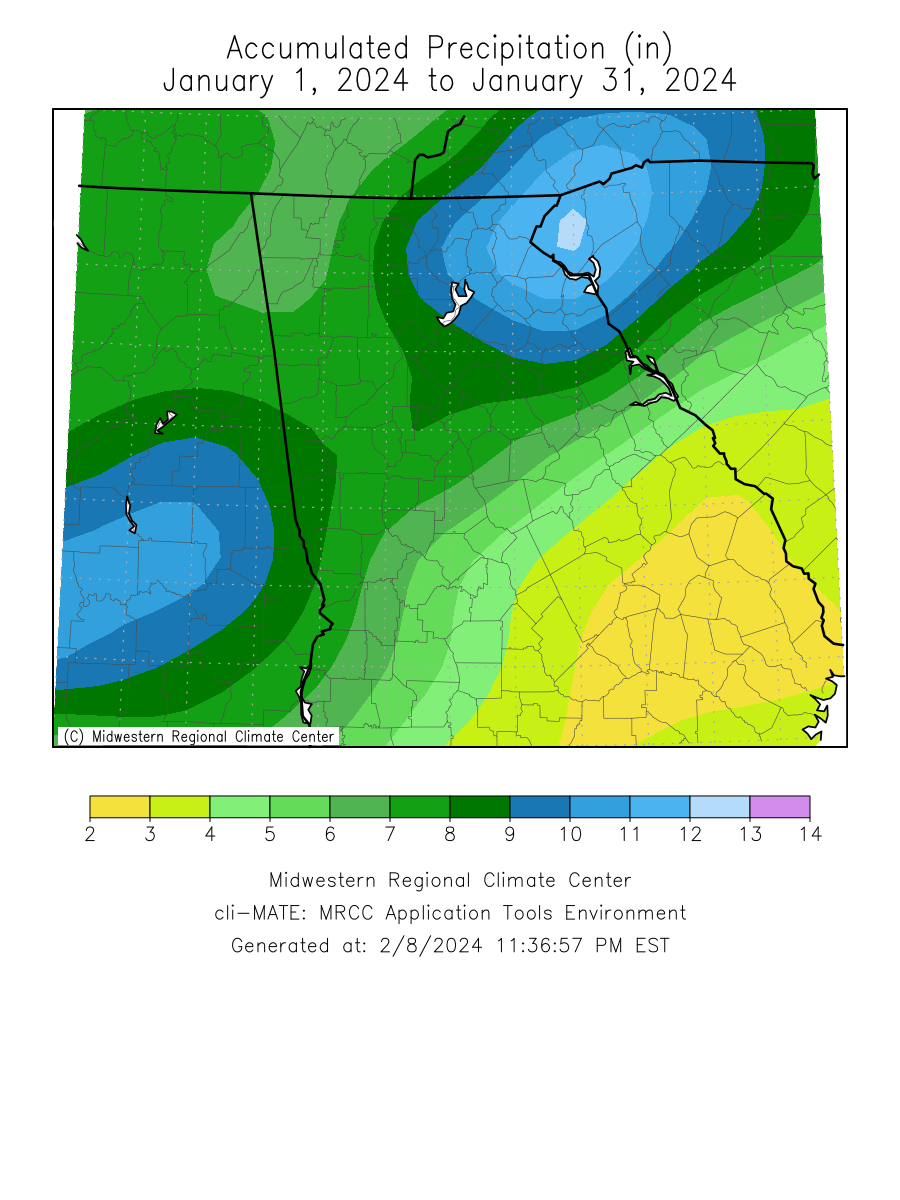
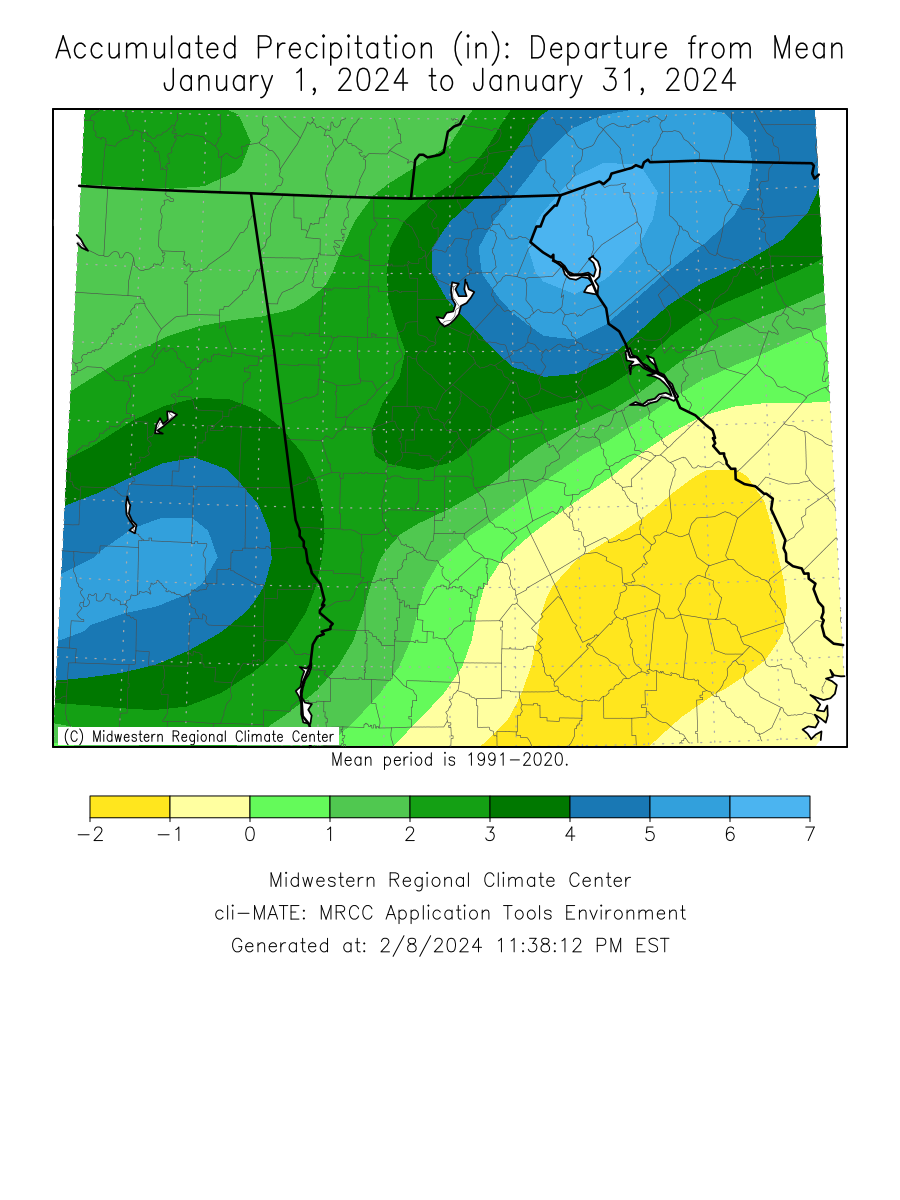
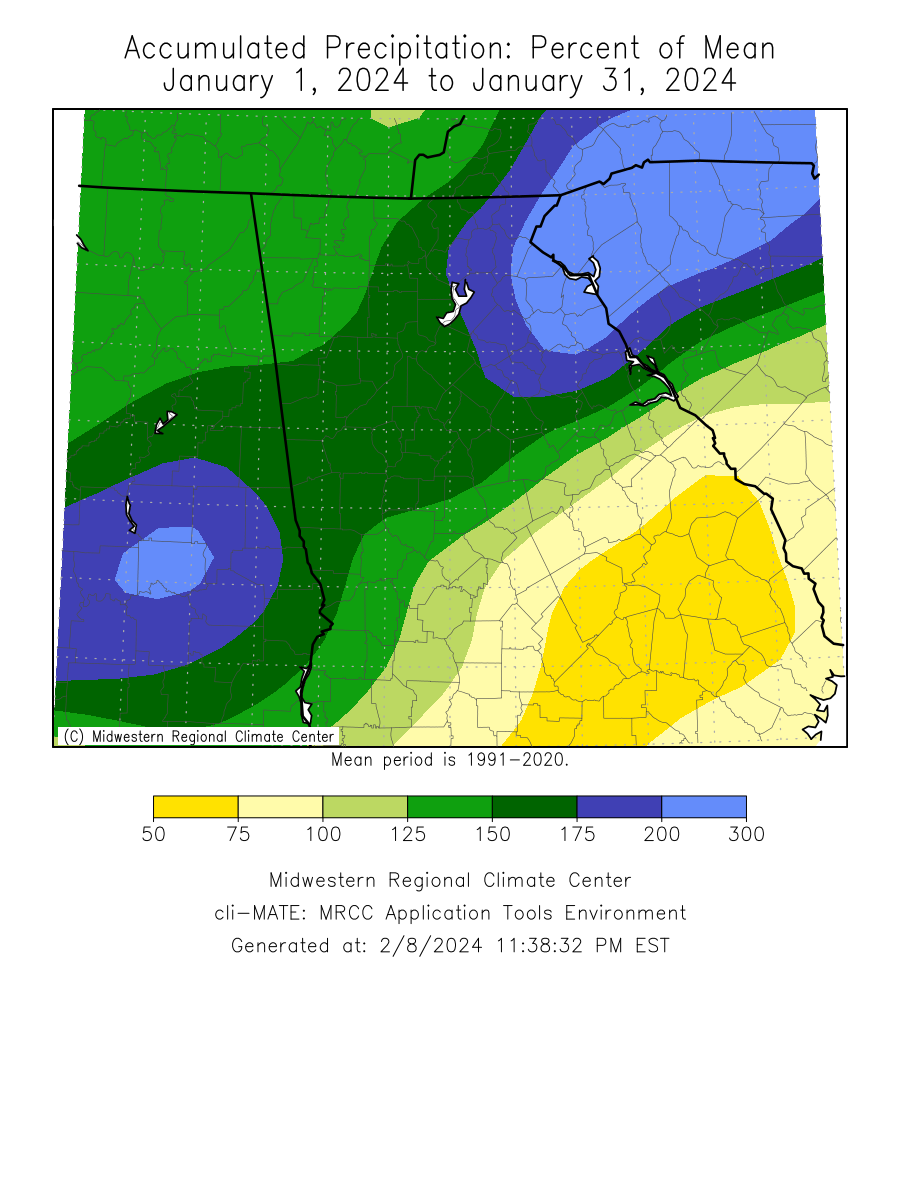
Click the links below to explore the temperature and precipitation data across north and central Georgia for the month of January 2024.
Temperature Maps
Precipitation Maps
Temperature Graphs
Precipitation Graphs
Temperature and precipitation records at our 4 main climate sites are located below.
January 2024 Climate Records
Date
Type
Location
Records set over a 24 hour period
1/9
Precip
Athens
A record 24 hour rainfall total was set at 4.56". This breaks the old record of 1.8" set in 1977.
1/9
Precip
Atlanta
A record 24 hour rainfall total was set at 2.75". This breaks the old record of 1.75" set in 1972.
1/9
Precip
Columbus
A record 24 hour rainfall total was set at 2.84". This breaks the old record of 1.49" set in 1936.
1/9
Precip
Macon
A record 24 hour rainfall total was set at 3.32". This breaks the old record of 1.8" set in 1895.
Larger events that occurred across north and central Georgia this past January can be found here.
The February climate outlook is below.
February Outlook