| Previous Month | Next Month |
Temperatures through the month of December were between 7 and 10 degrees above normal. Precipitation through the month of December was within 2 inches of normal.
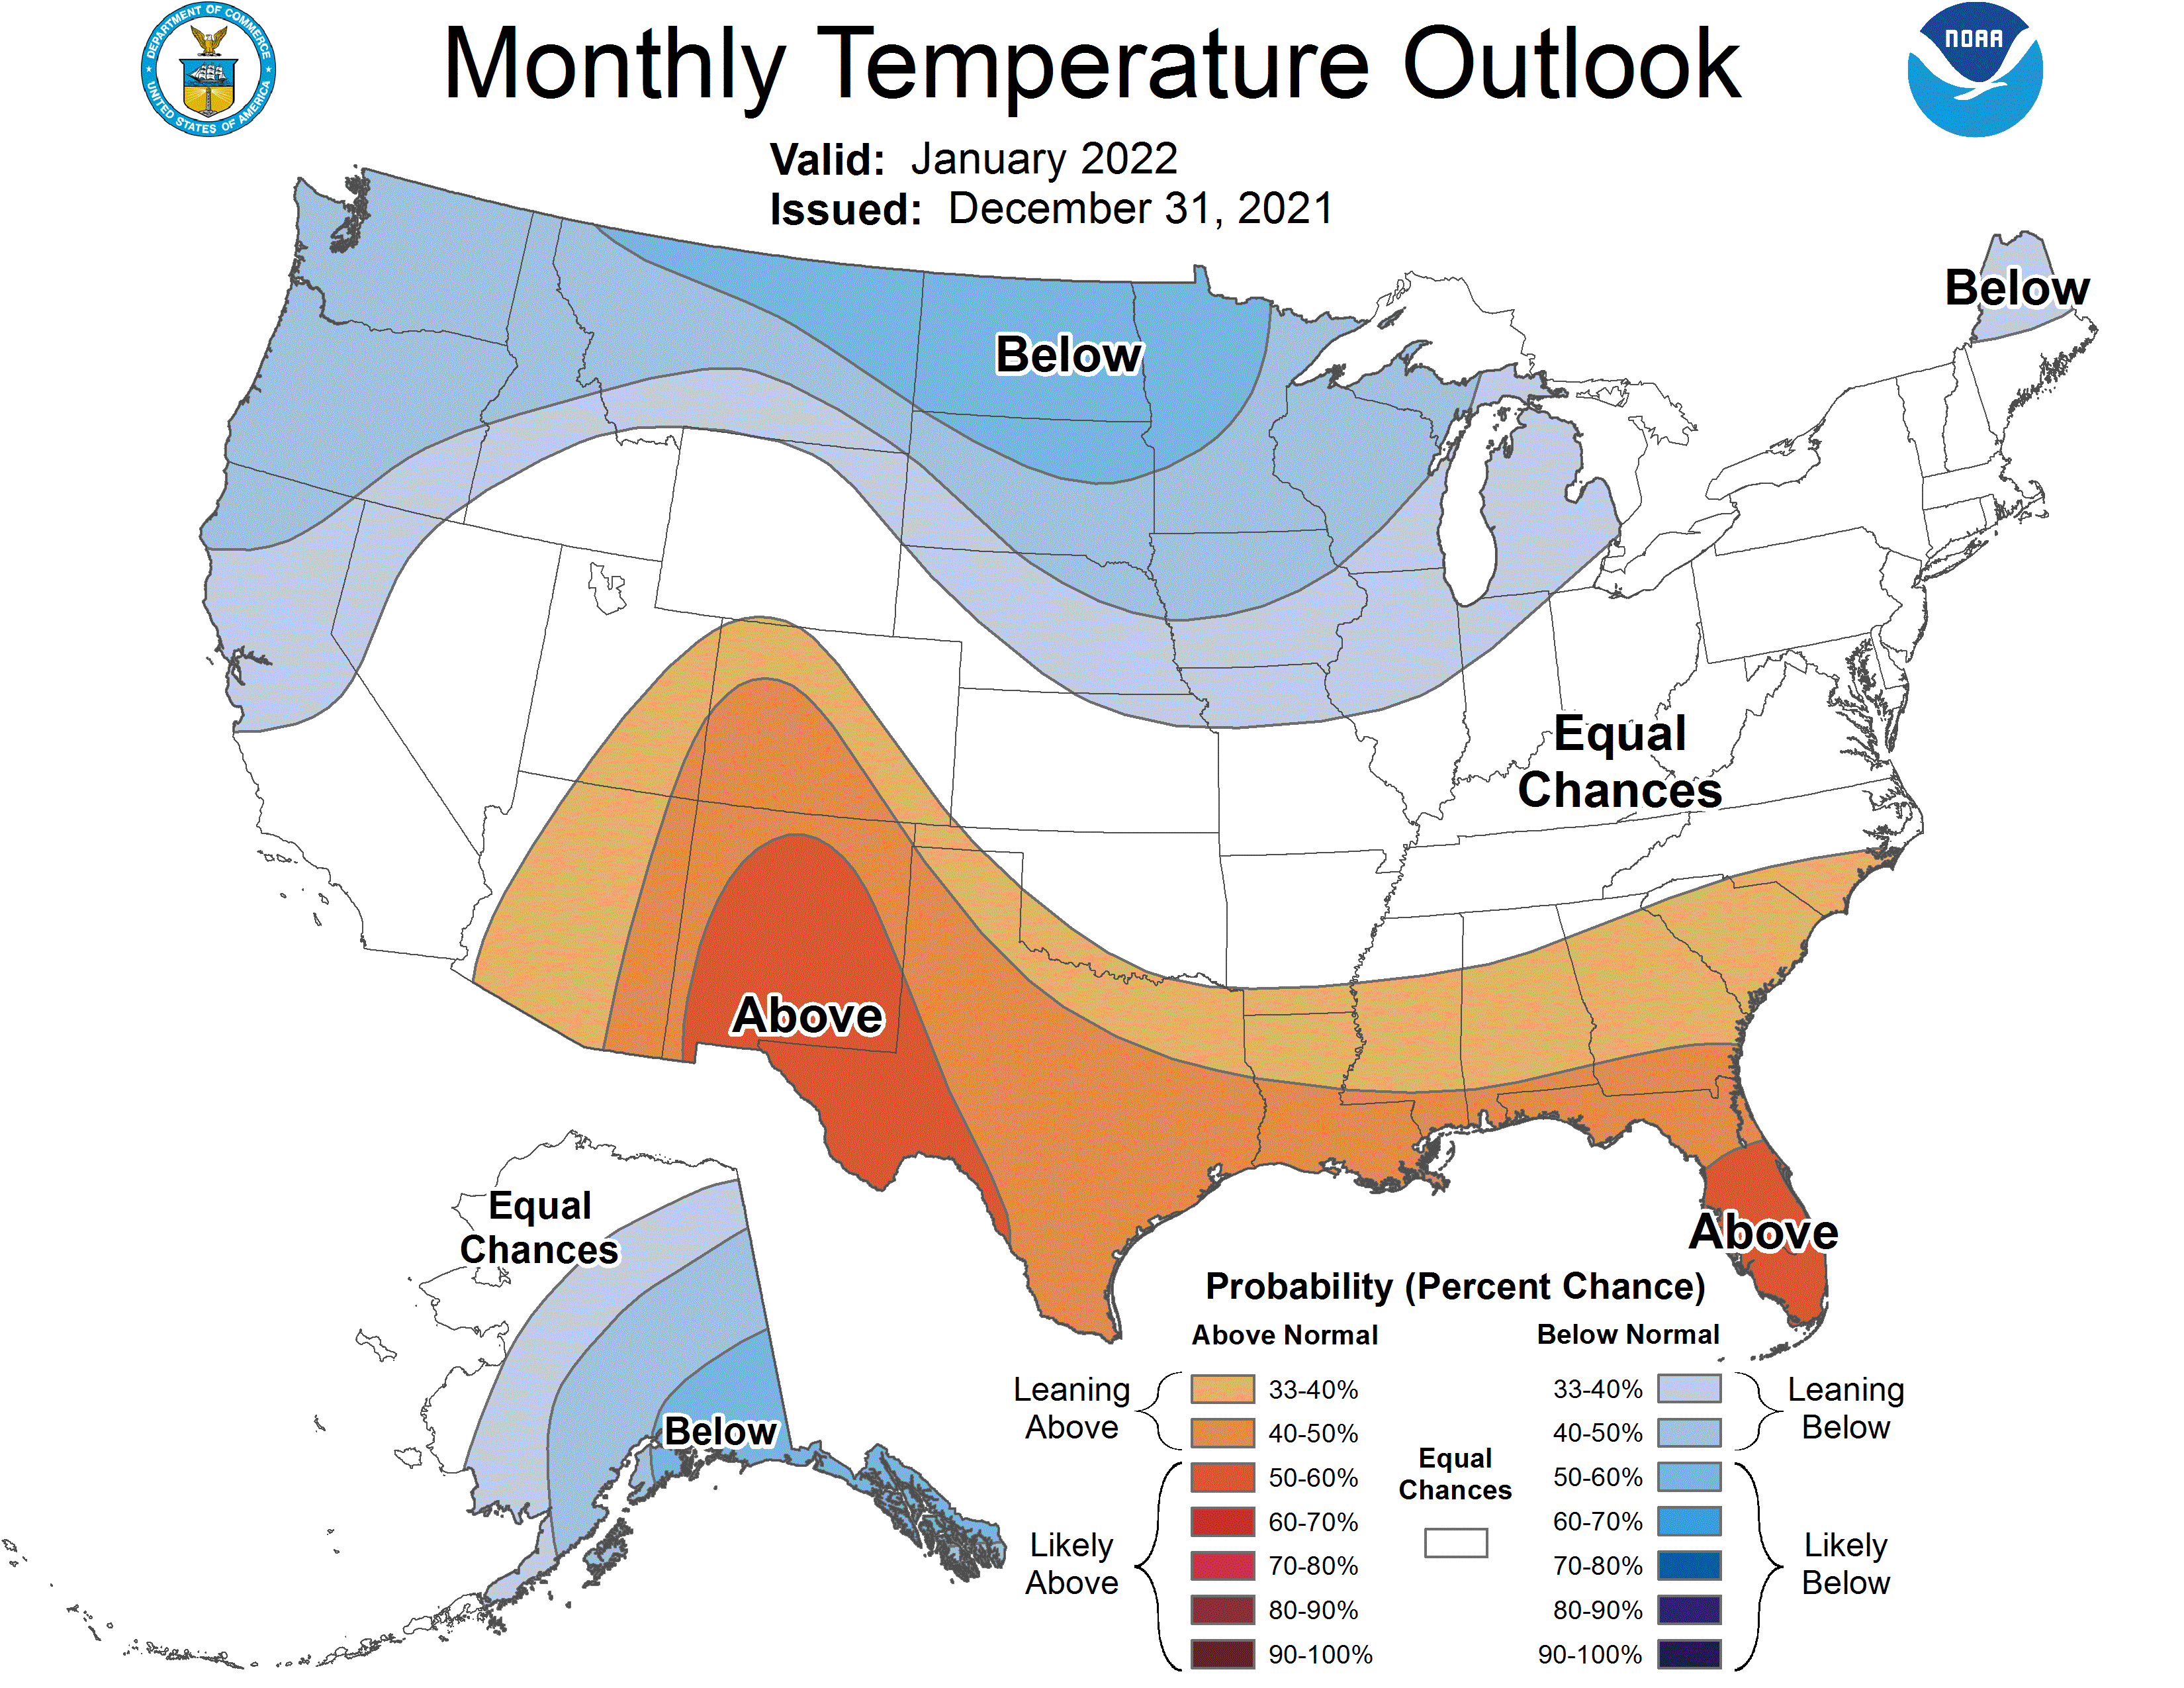
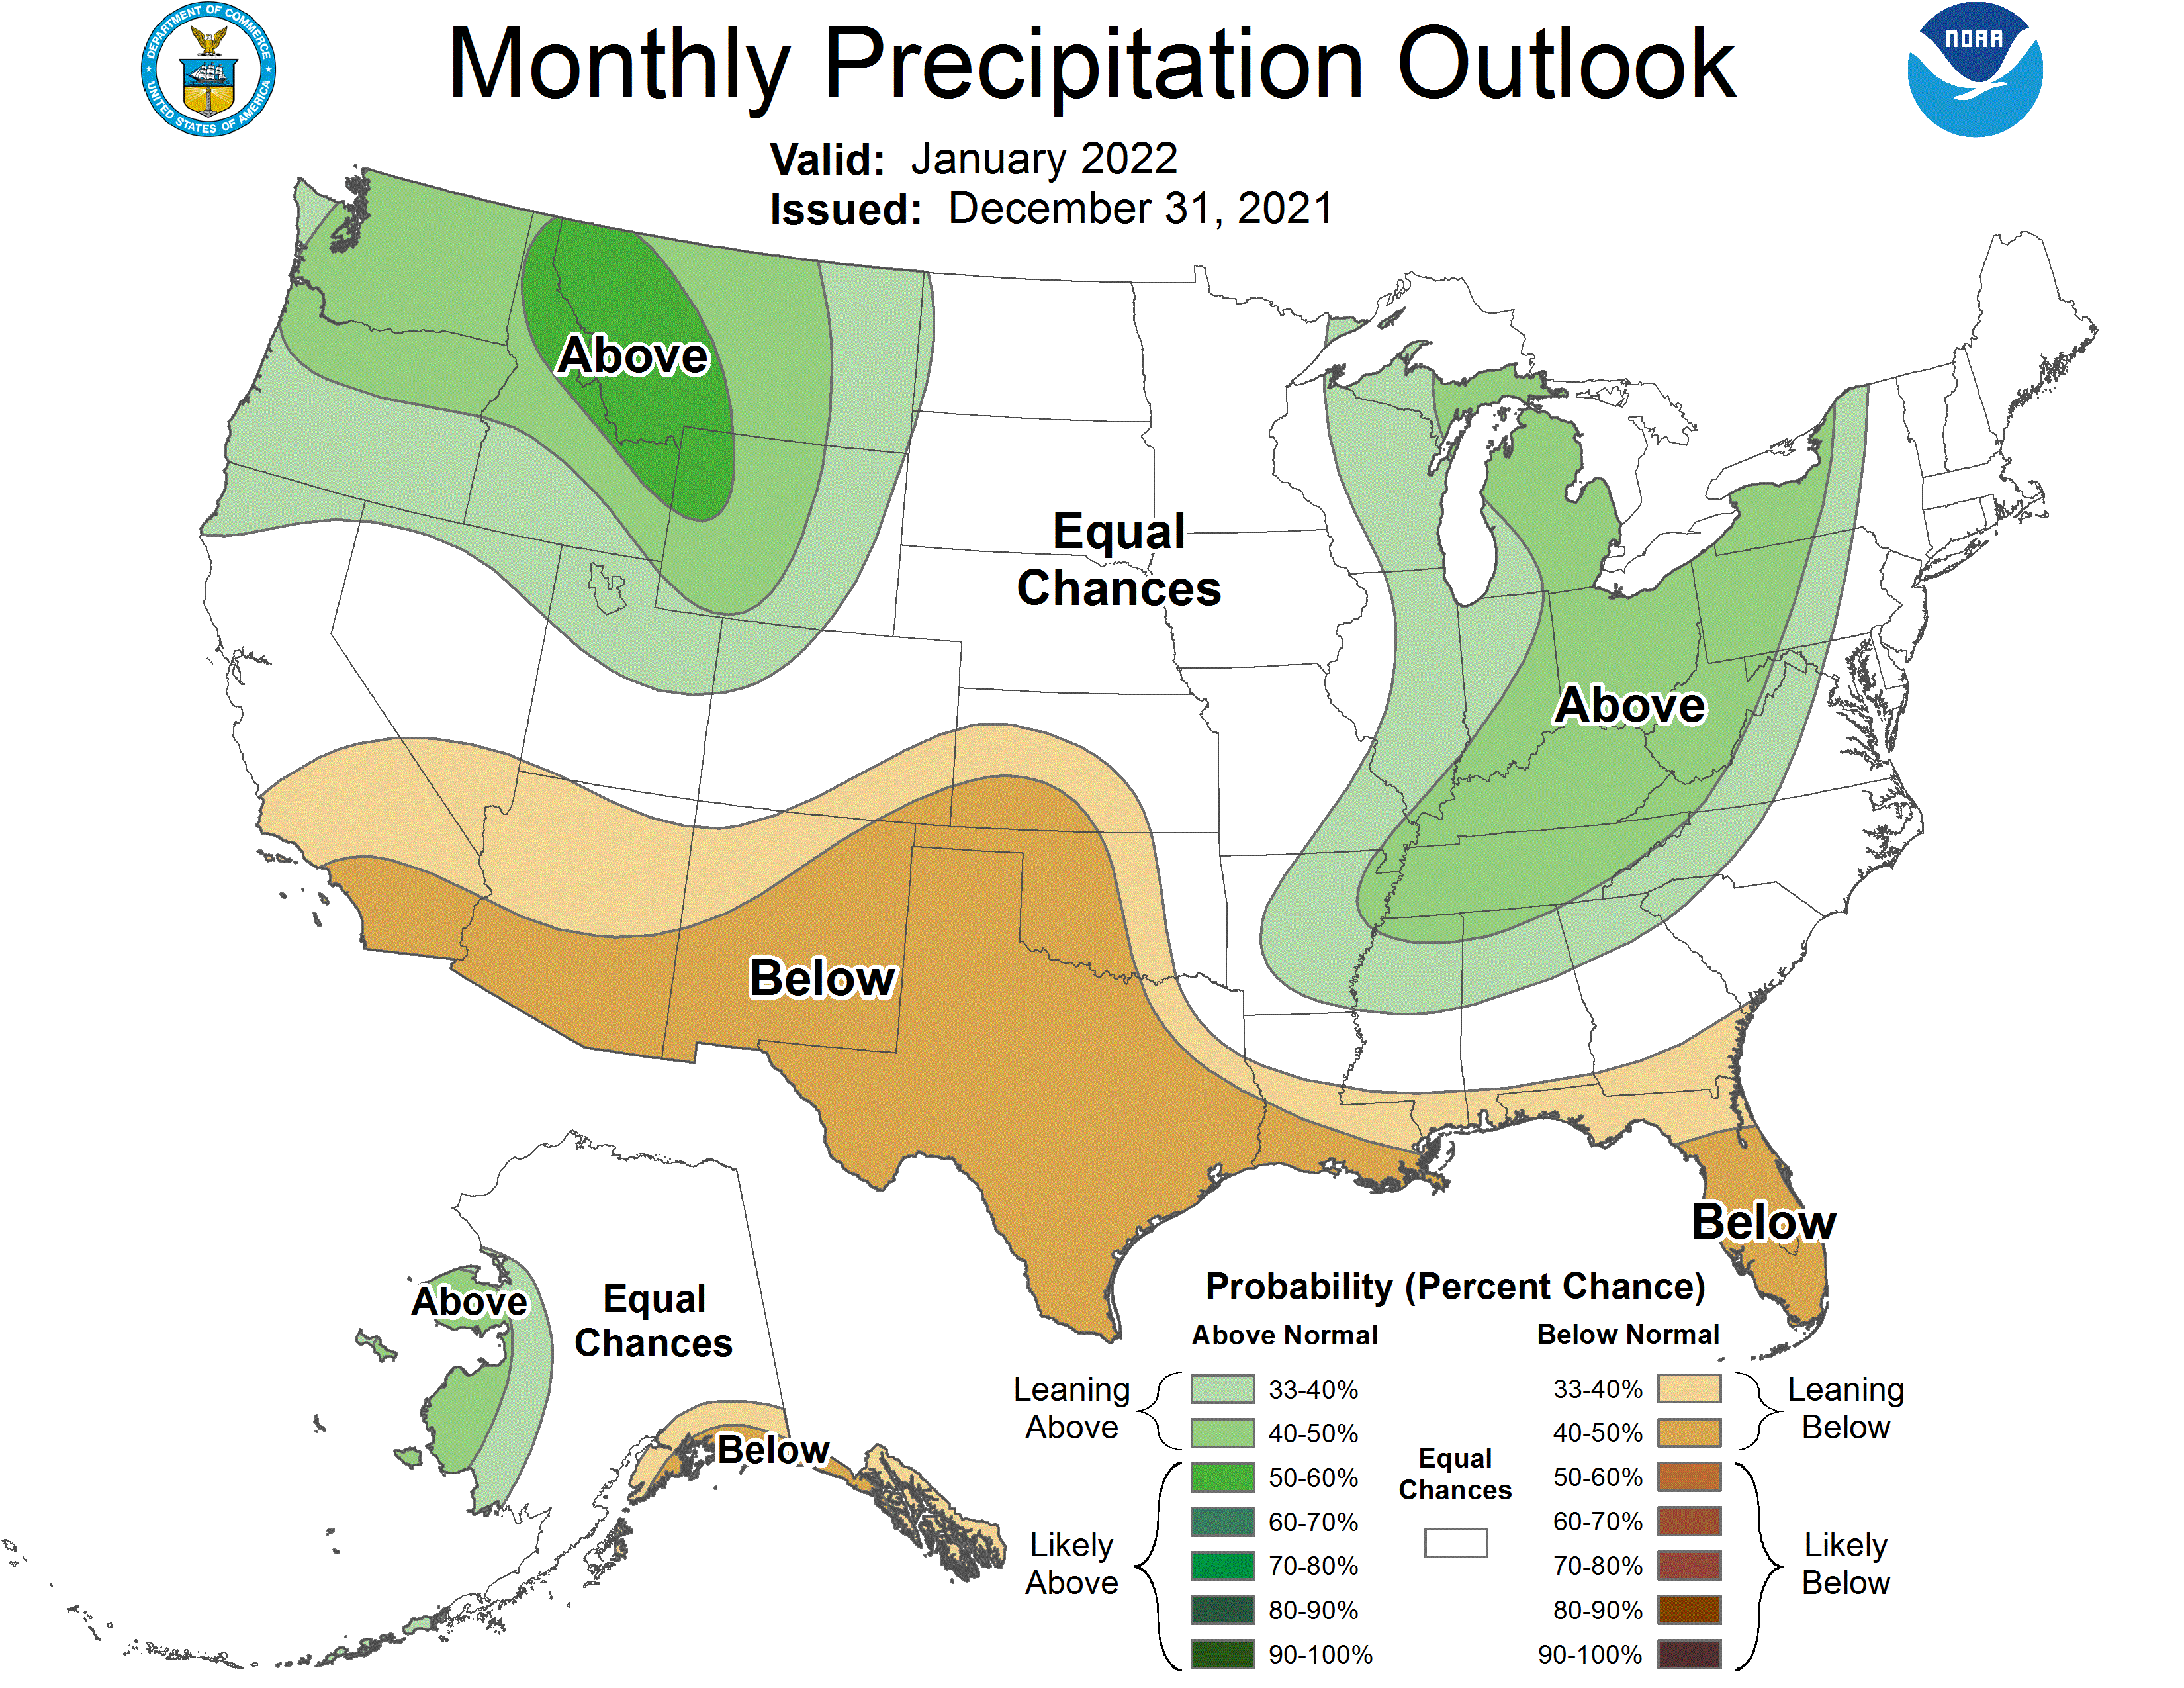
Climate Site Maximum Temperature Max T Date *Indicates a daily record was set Climate Site Total Precipitation DFN (Departure Climate Site Maximum Daily Precip (in inches) Max P Date *Indicates a daily record was set Data prepared by NWS Peachtree City/Atlanta Visit our Event Page for a more detailed look at the Severe Weather that occurred at the end of December/Beginning of January. December 11th Tornado and Wind Damage in Central GA: A line of showers and scattered thunderstorms spawned a brief tornado over rural Wilkinson County near KJGX radar (north of I-16). A tornado touched down over south-central Wilkinson County within a small area of showers and storms out ahead of a cold front. A brief, but discrete mini-supercell was imbedded in that line. This tornado was determined to be an EF-0 with estimated peak wind speeds of 70 mph. For more information on this storm visit our Public Information Statement. Local Storm Reports December 29-30th Central Georgia Severe Weather Outbreak: A stationary front stalled out over northern Alabama and into NW Georgia. Unseasonably warm temperatures flooded into north and central Georgia. A strong low-level jet allowed a QLCS that formed later in the afternoon to intensify, creating a number of bowing segments that caused some extensive wind damage. Tornadoes were confirmed in Hall County and Pulaski County. Out in front of this line of storms across central Georgia, a few discrete storms aided by 30-40kts of bulk sheer and a low level jet took on supercell qualities. Numerous reports of quarter sized hail was received in and around the Columbus area. December 31st Low Precipitation Supercell Tornadoes: On New Years Eve, the Metro Atlanta area experienced a relatively rare phenomena for the east side of the Mississippi river. A favorable environment for Low Precipitation (LP) Supercells including low atmospheric moisture and strong mid-level winds came together resulting in two confirmed tornadoes. As the name entails, LP supercells are strong storms that produce much less precipitation then the standard Classic Supercell or High Precipitation Supercell that Georgia often sees during the spring severe weather season. For more information on these storms, please see out Public Information Statements for Carroll County and Newton County. Based on the Climate Prediction Center's outlook for January, far northern Georgia has an equal chances for above, below or near normal temperatures while the rest of Georgia has 33% chance of above average temperatures. For precipitation, northern Georgia has a 33% chance of above average precipitation while the rest of Georgia has an equal chances for above, below or near normal precipitation.
Overview
Climate Graphs
Records
Events
January Outlook
Below are the overview stats for December 2021 for our 10 climate sites.
December 2021 Climate Averages
Climate Site
December Temp (°F)
Average Temp
Departure from normal
Athens
54.9
46.5
8.4
Atlanta
56.0
47.3
8.7
Columbus
57.7
50.6
7.1
Macon
57.3
49.5
7.8
Cartersville
54.2
44.3
9.9
Dekalb Peachtree Arpt
54.0
44.9
9.1
Fulton Co Arpt
53.9
46.0
7.9
Gainesville
53.8
44.9
8.9
Peachtree City
54.8
47.2
7.6
Rome
54.4
44.7
9.7
December 2021 Temperature Climate Statistics
Minimum Temperature
Min T Date
Athens
80*
12/3
29
12/23
Atlanta
77
12/3
34
12/23
Columbus
80
12/31
32
12/23
Macon
83*
12/30
29
12/23
Cartersville
75
12/11, 12/28
28
12/23
Dekalb Peachtree Arpt
76
12/3, 12/26
28
12/14, 12/23
Fulton Co Arpt
77
12/3
28
12/23
Gainesville
75
12/3
31
12/14
Peachtree City
77
12/3
28
12/23
Rome
76
12/29
27
12/23
December 2021 Precipitation Climate Statistics
Average Precipitation
From Normal)
Athens
3.45
4.43
-0.98
Atlanta
6.08
4.57
1.51
Columbus
4.80
4.78
0.02
Macon
5.18
4.57
0.61
Cartersville
4.97
4.49
0.48
Dekalb Peachtree Arpt
5.56
4.36
1.20
Fulton County Arpt
6.05
4.21
1.84
Gainesville
5.18
4.71
0.47
Peachtree City
2.84
-1.72
Rome
2.84
4.56
-1.18
December 2021 Precipitation Climate Statistics
Athens
1.74
12/29
Atlanta
2.86*
12/29
Columbus
1.51
12/29
Macon
1.60
12/7
Cartersville
1.59
12/29
Dekalb Peachtree Arpt
3.00
12/30
Fulton Co Arpt
3.24
12/30
Gainesville
2.18
12/29
Peachtree City
0.83
12/18
Rome
1.44
12/29
Click the links below to explore the temperature and precipitation data across north and central Georgia for the month of December.
Temperature Maps
Precipitation Maps
Temperature Graphs
Precipitation Graphs
Temperature and precipitation records at our 4 main climate sites are located below.
December 2021 Climate Records
Date
Type
Location
Records set over a 24 hour period
12/30
Daily Rainfall
Atlanta
2.85 Inches of rain fell over 24 hours. This breaks the old record of 1.92 inches set in 1900.
December 2021 Climate Records
Date
Type
Location
Records set over a 24 hour period
12/3
Max T
Athens
Athens reached a high MAX temperature of 80°F. This breaks the old record of 79°F set in 2007.
12/30
Max T
Macon
Macon reached a high MAX temperature of 83°F. This breaks the old record of 82°F set in 1972.
December 2021 Climate Records
Date
Type
Location
Records set over a 24 hour period
12/29
Min T
Athens
Athens reached a high MIN temperature of 64°F. This breaks the old record of 62°F set in 2021.
12/18
Min T
Atlanta
Atlanta reached a high MIN temperature of 62°F. This breaks the old record of 60°F set in 2008.
12/29
Min T
Atlanta
Atlanta reached a high MIN temperature of 65°F. This breaks the old record of 62°F set in 2019.
12/30
Min T
Atlanta
Atlanta reached a high MIN temperature of 61°F. This breaks the old record of 60°F set in 1996.
12/30
Min T
Columbus
Columbus reached a high MIN temperature of 64°F. This breaks the old record of 61°F set in 2015.
12/31
Min T
Columbus
Columbus reached a high MIN temperature of 63°F. This breaks the old record of 60°F set in 2018.
12/18
Min T
Macon
Macon reached a high MIN temperature of 60°F. This breaks the old record of 56°F set in 1990.
12/29
Min T
Macon
Macon reached a high MIN temperature of 67°F. This breaks the old record of 66°F set in 2015.
Climate Fact: This year is the only December on record that the official Atlanta climate site did not record a temperature at or below freezing!
Larger events that occurred across north and central Georgia this past December can be found here.
Radar View
Radar View
Local Storm Reports
.png)
Radar View
Local Storm Reports
January Outlook

