| Previous Month | Next Month |
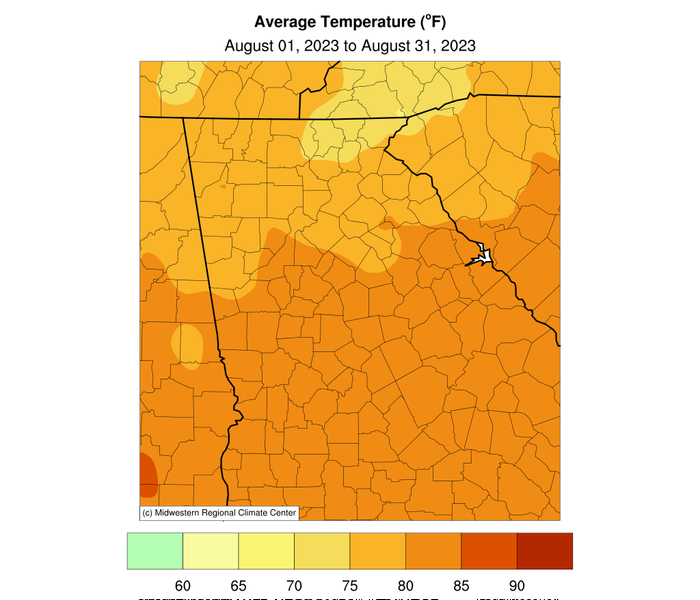
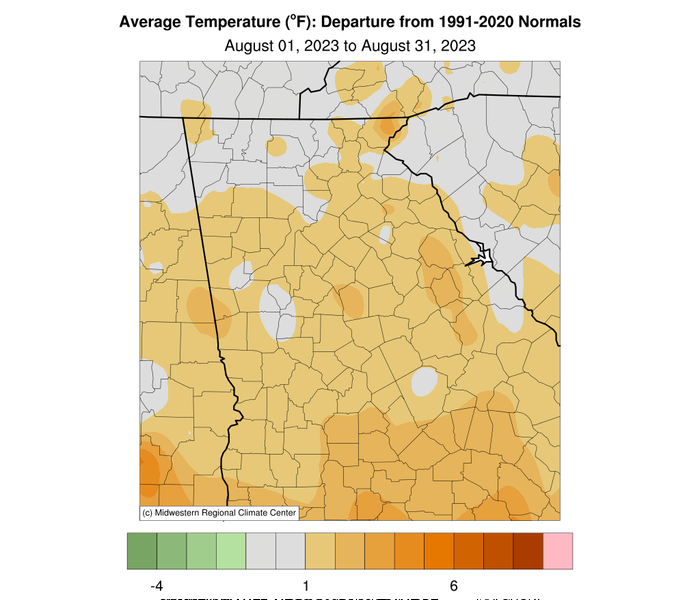
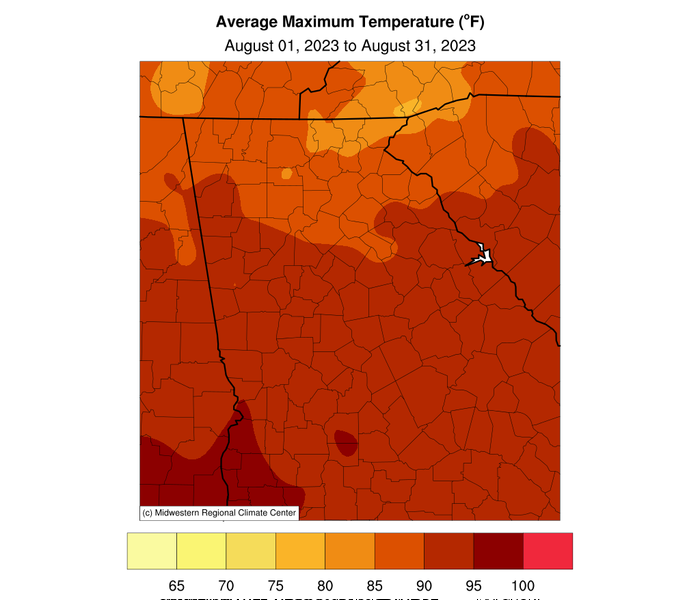
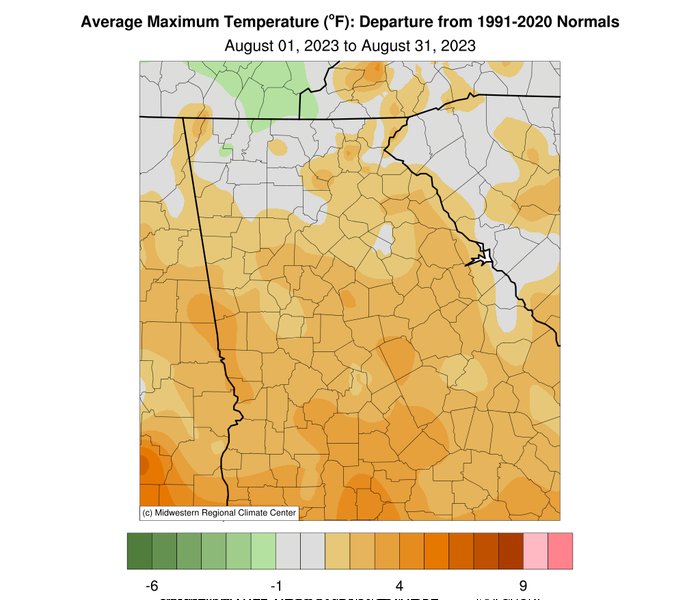
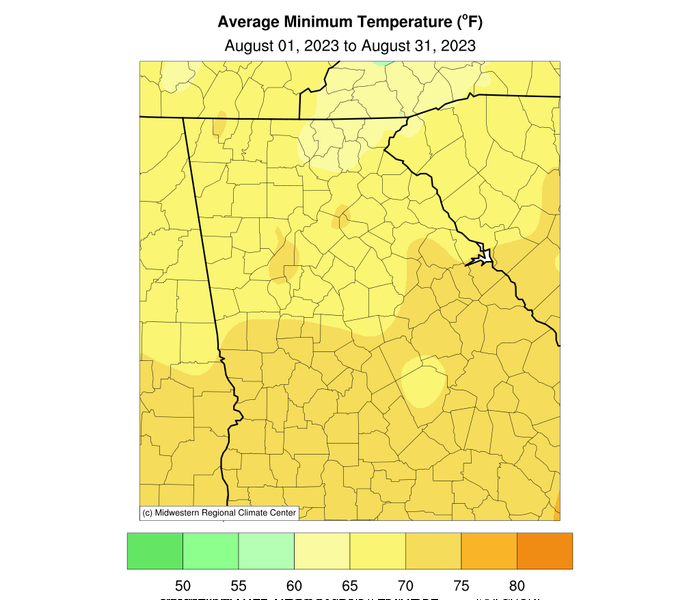
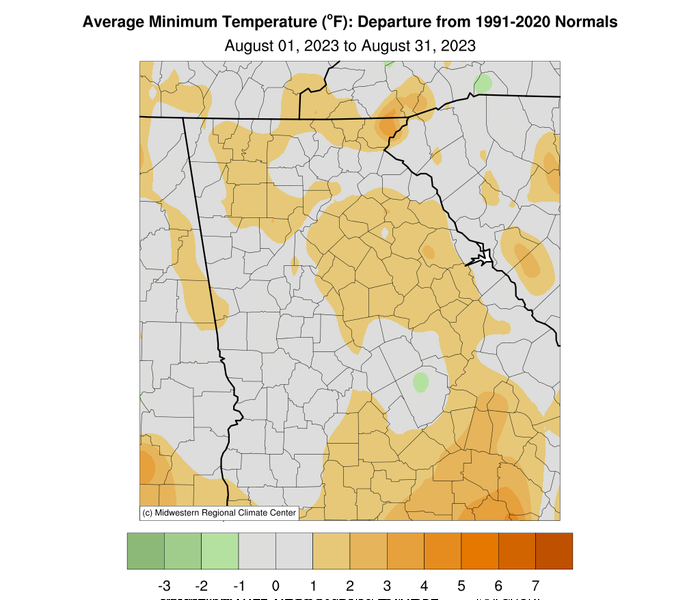
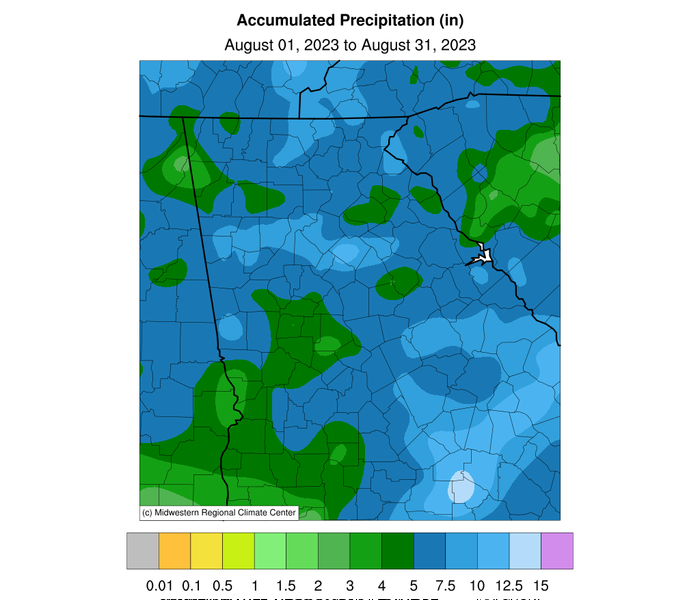
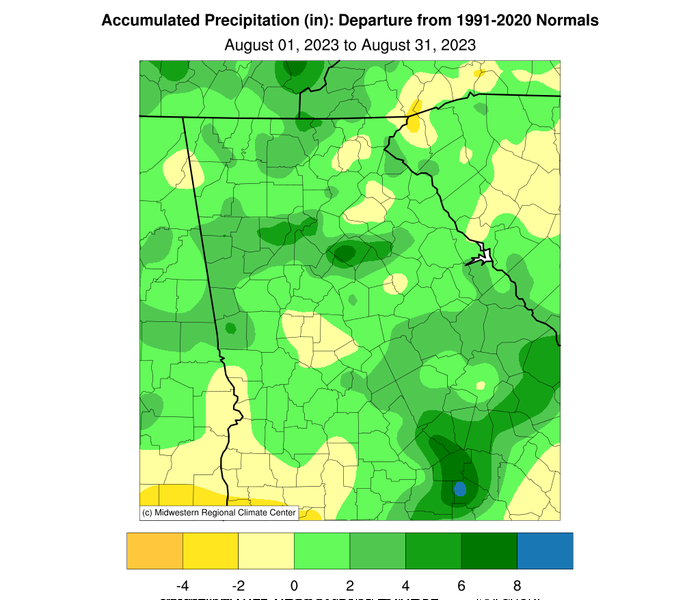
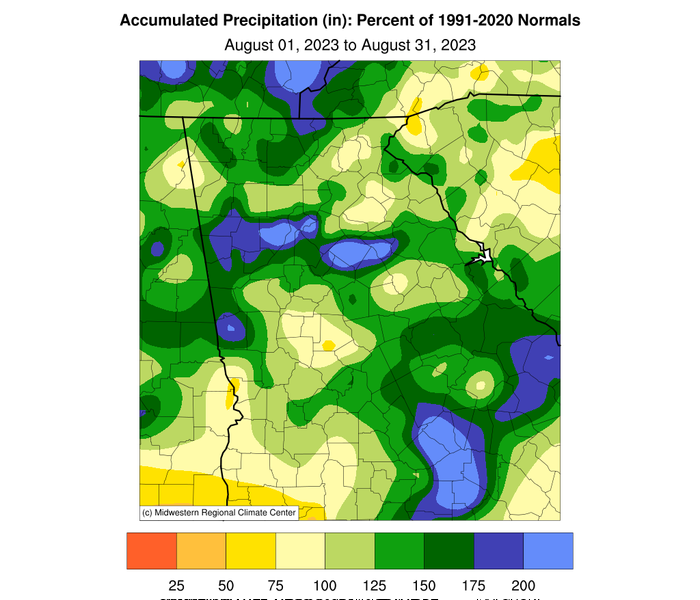
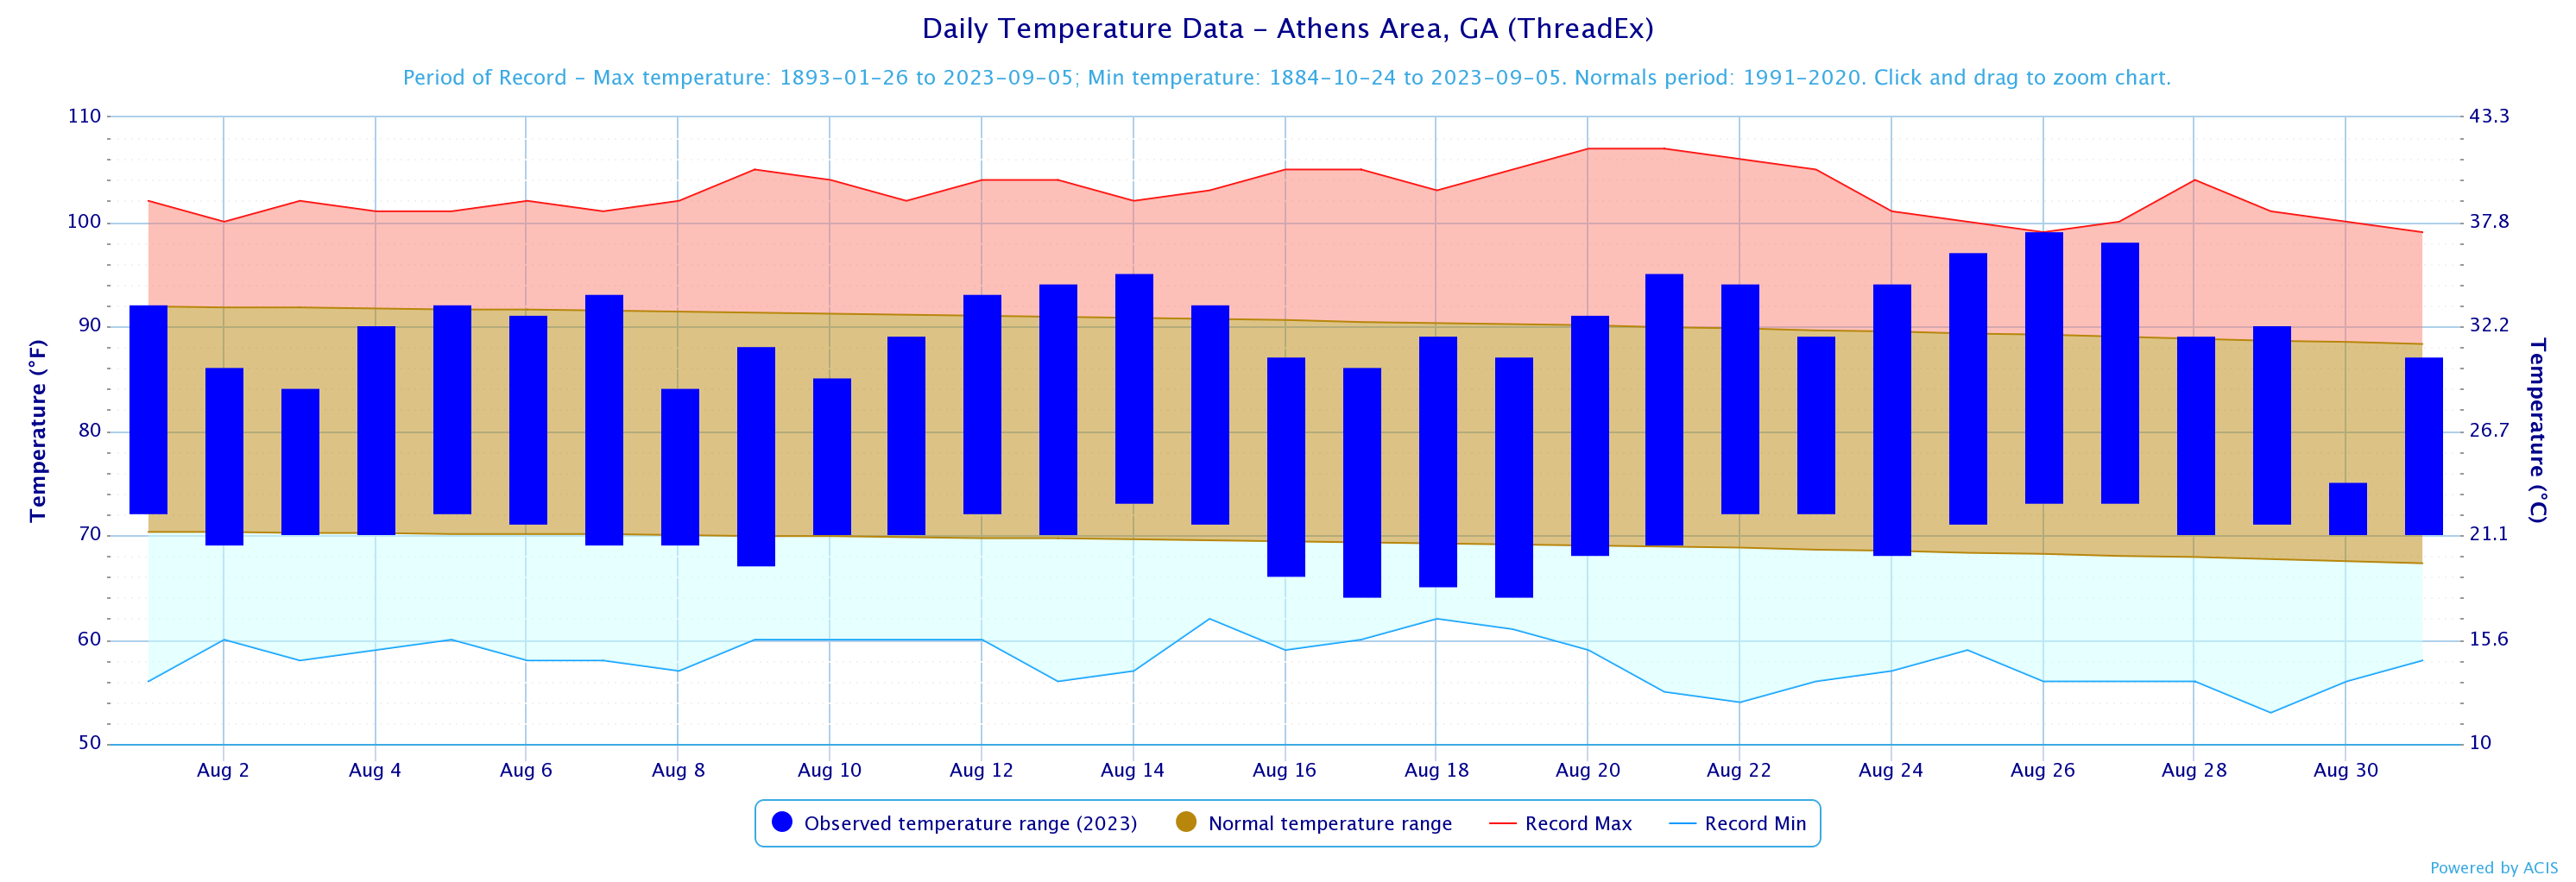
Temperatures through the month of August were around a degree above normal. Precipitation through the month of August was around an inch above normal.
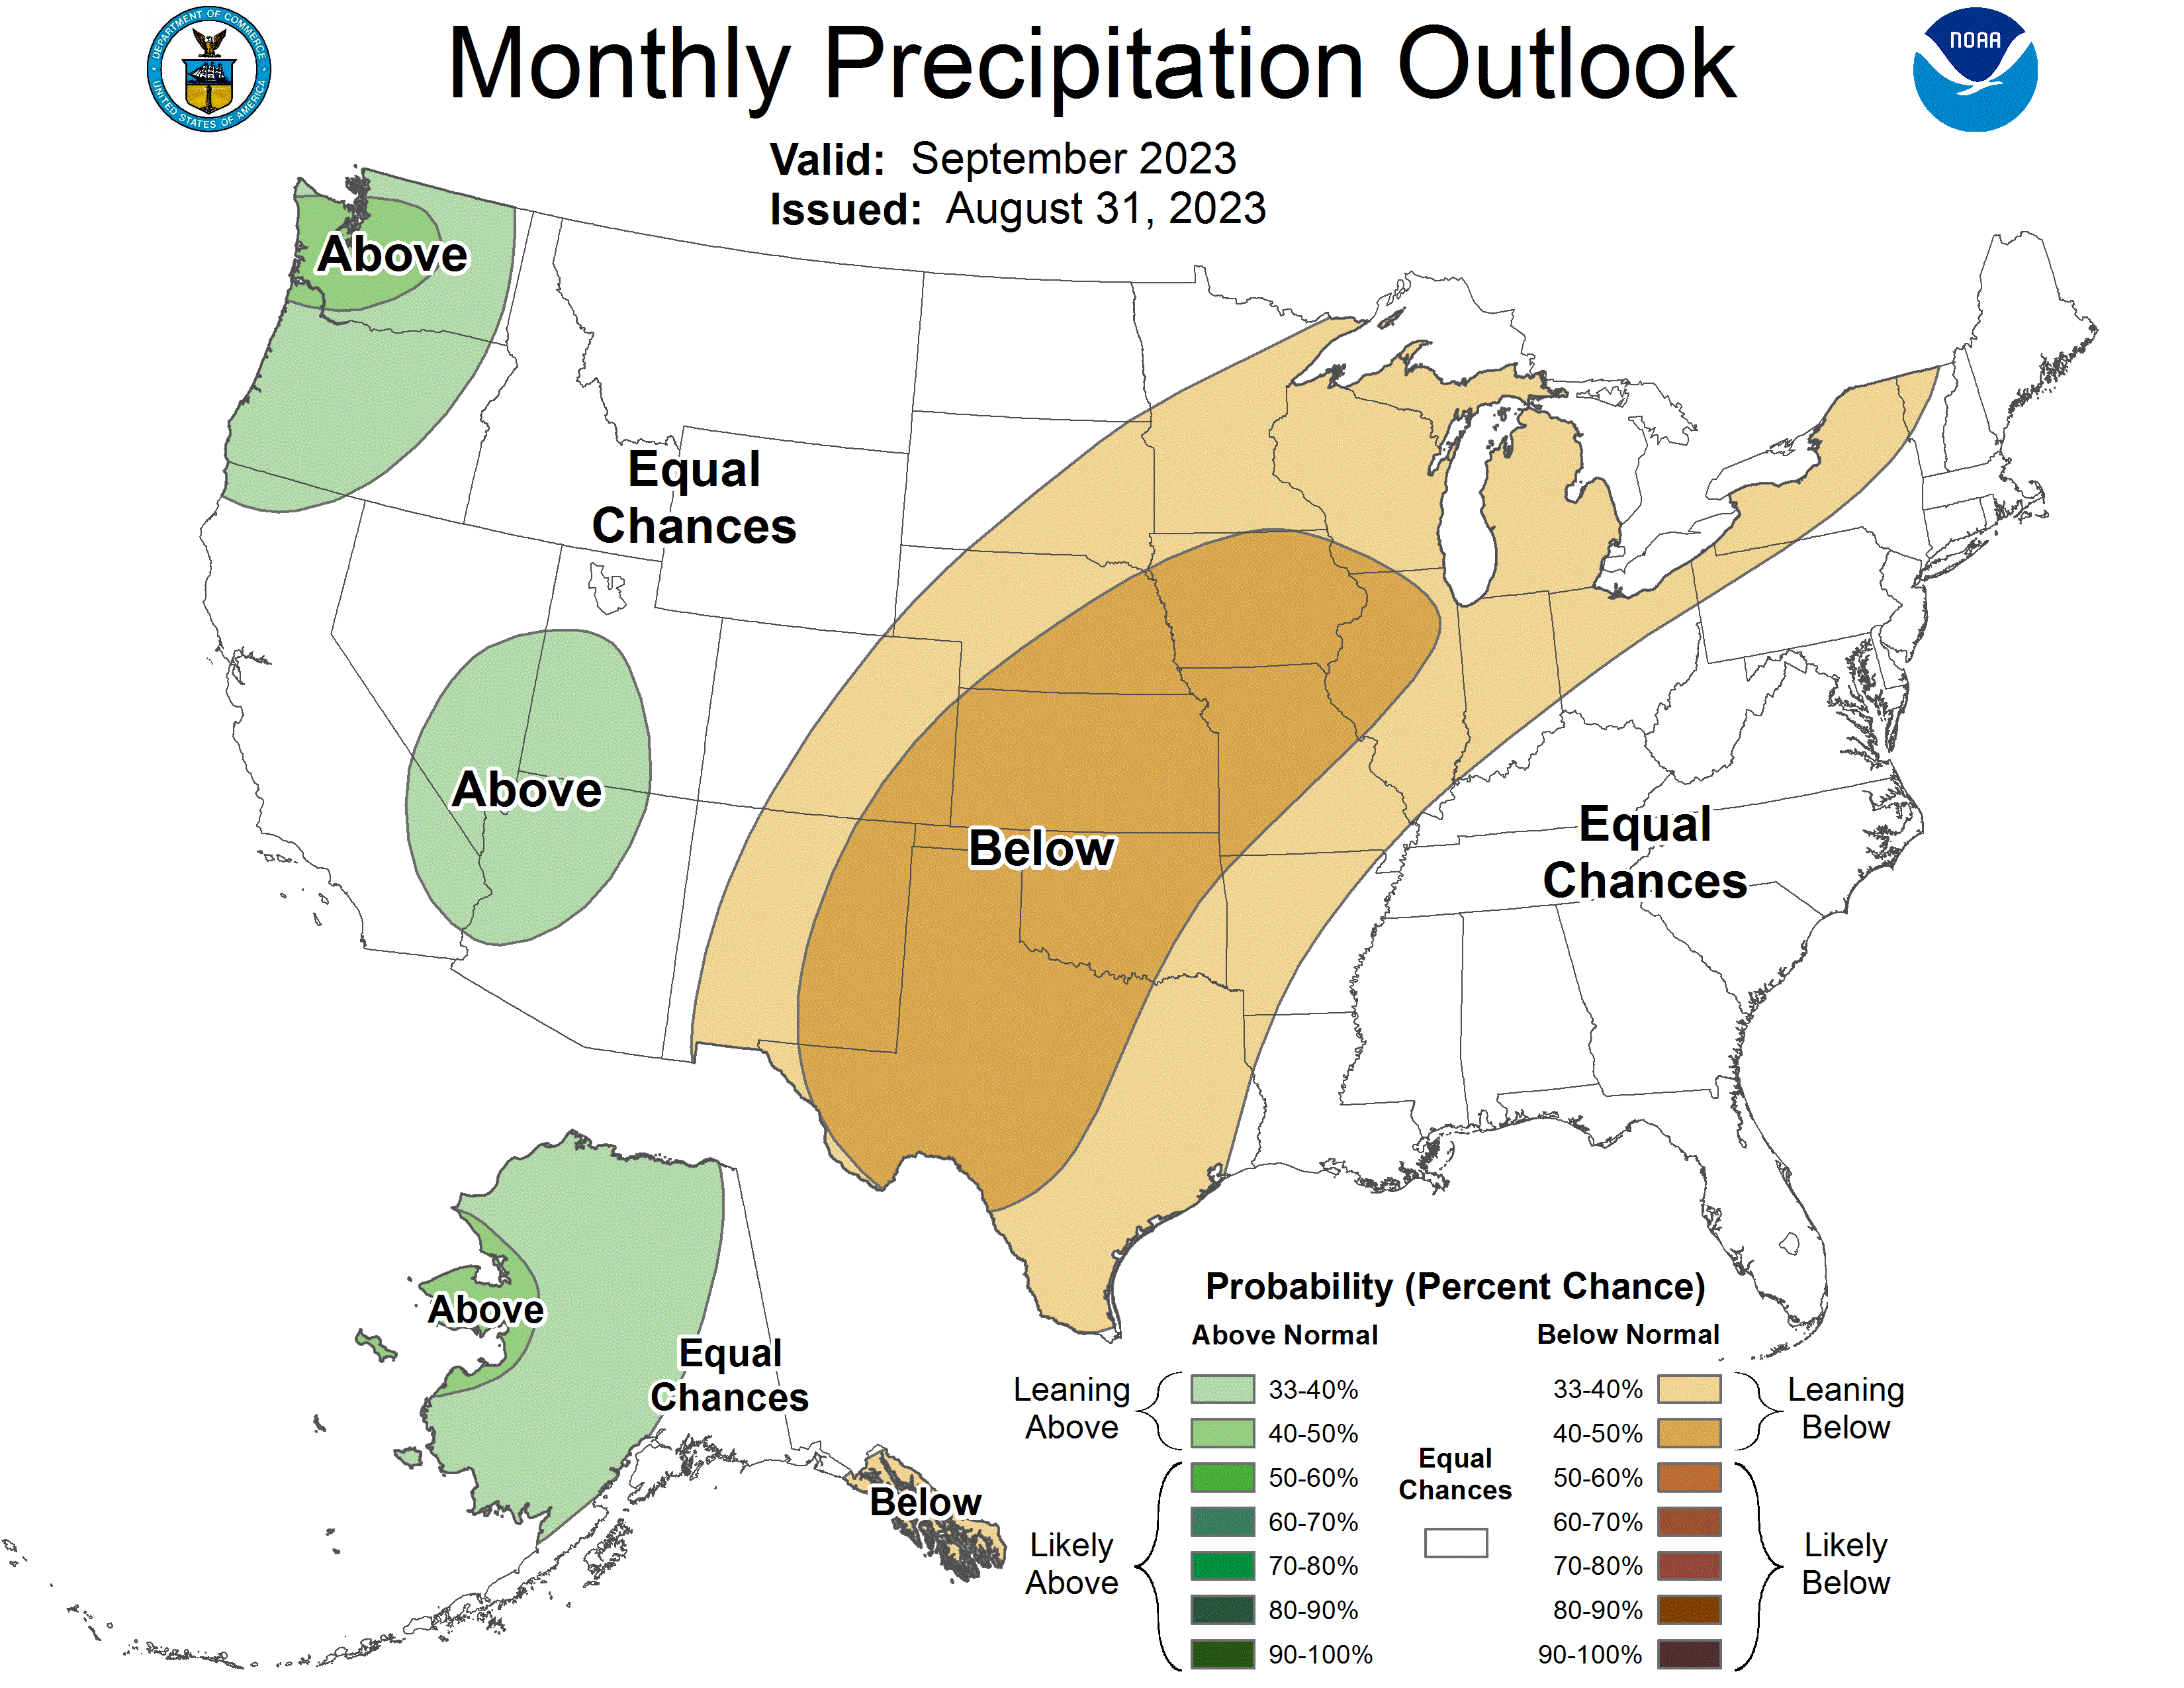
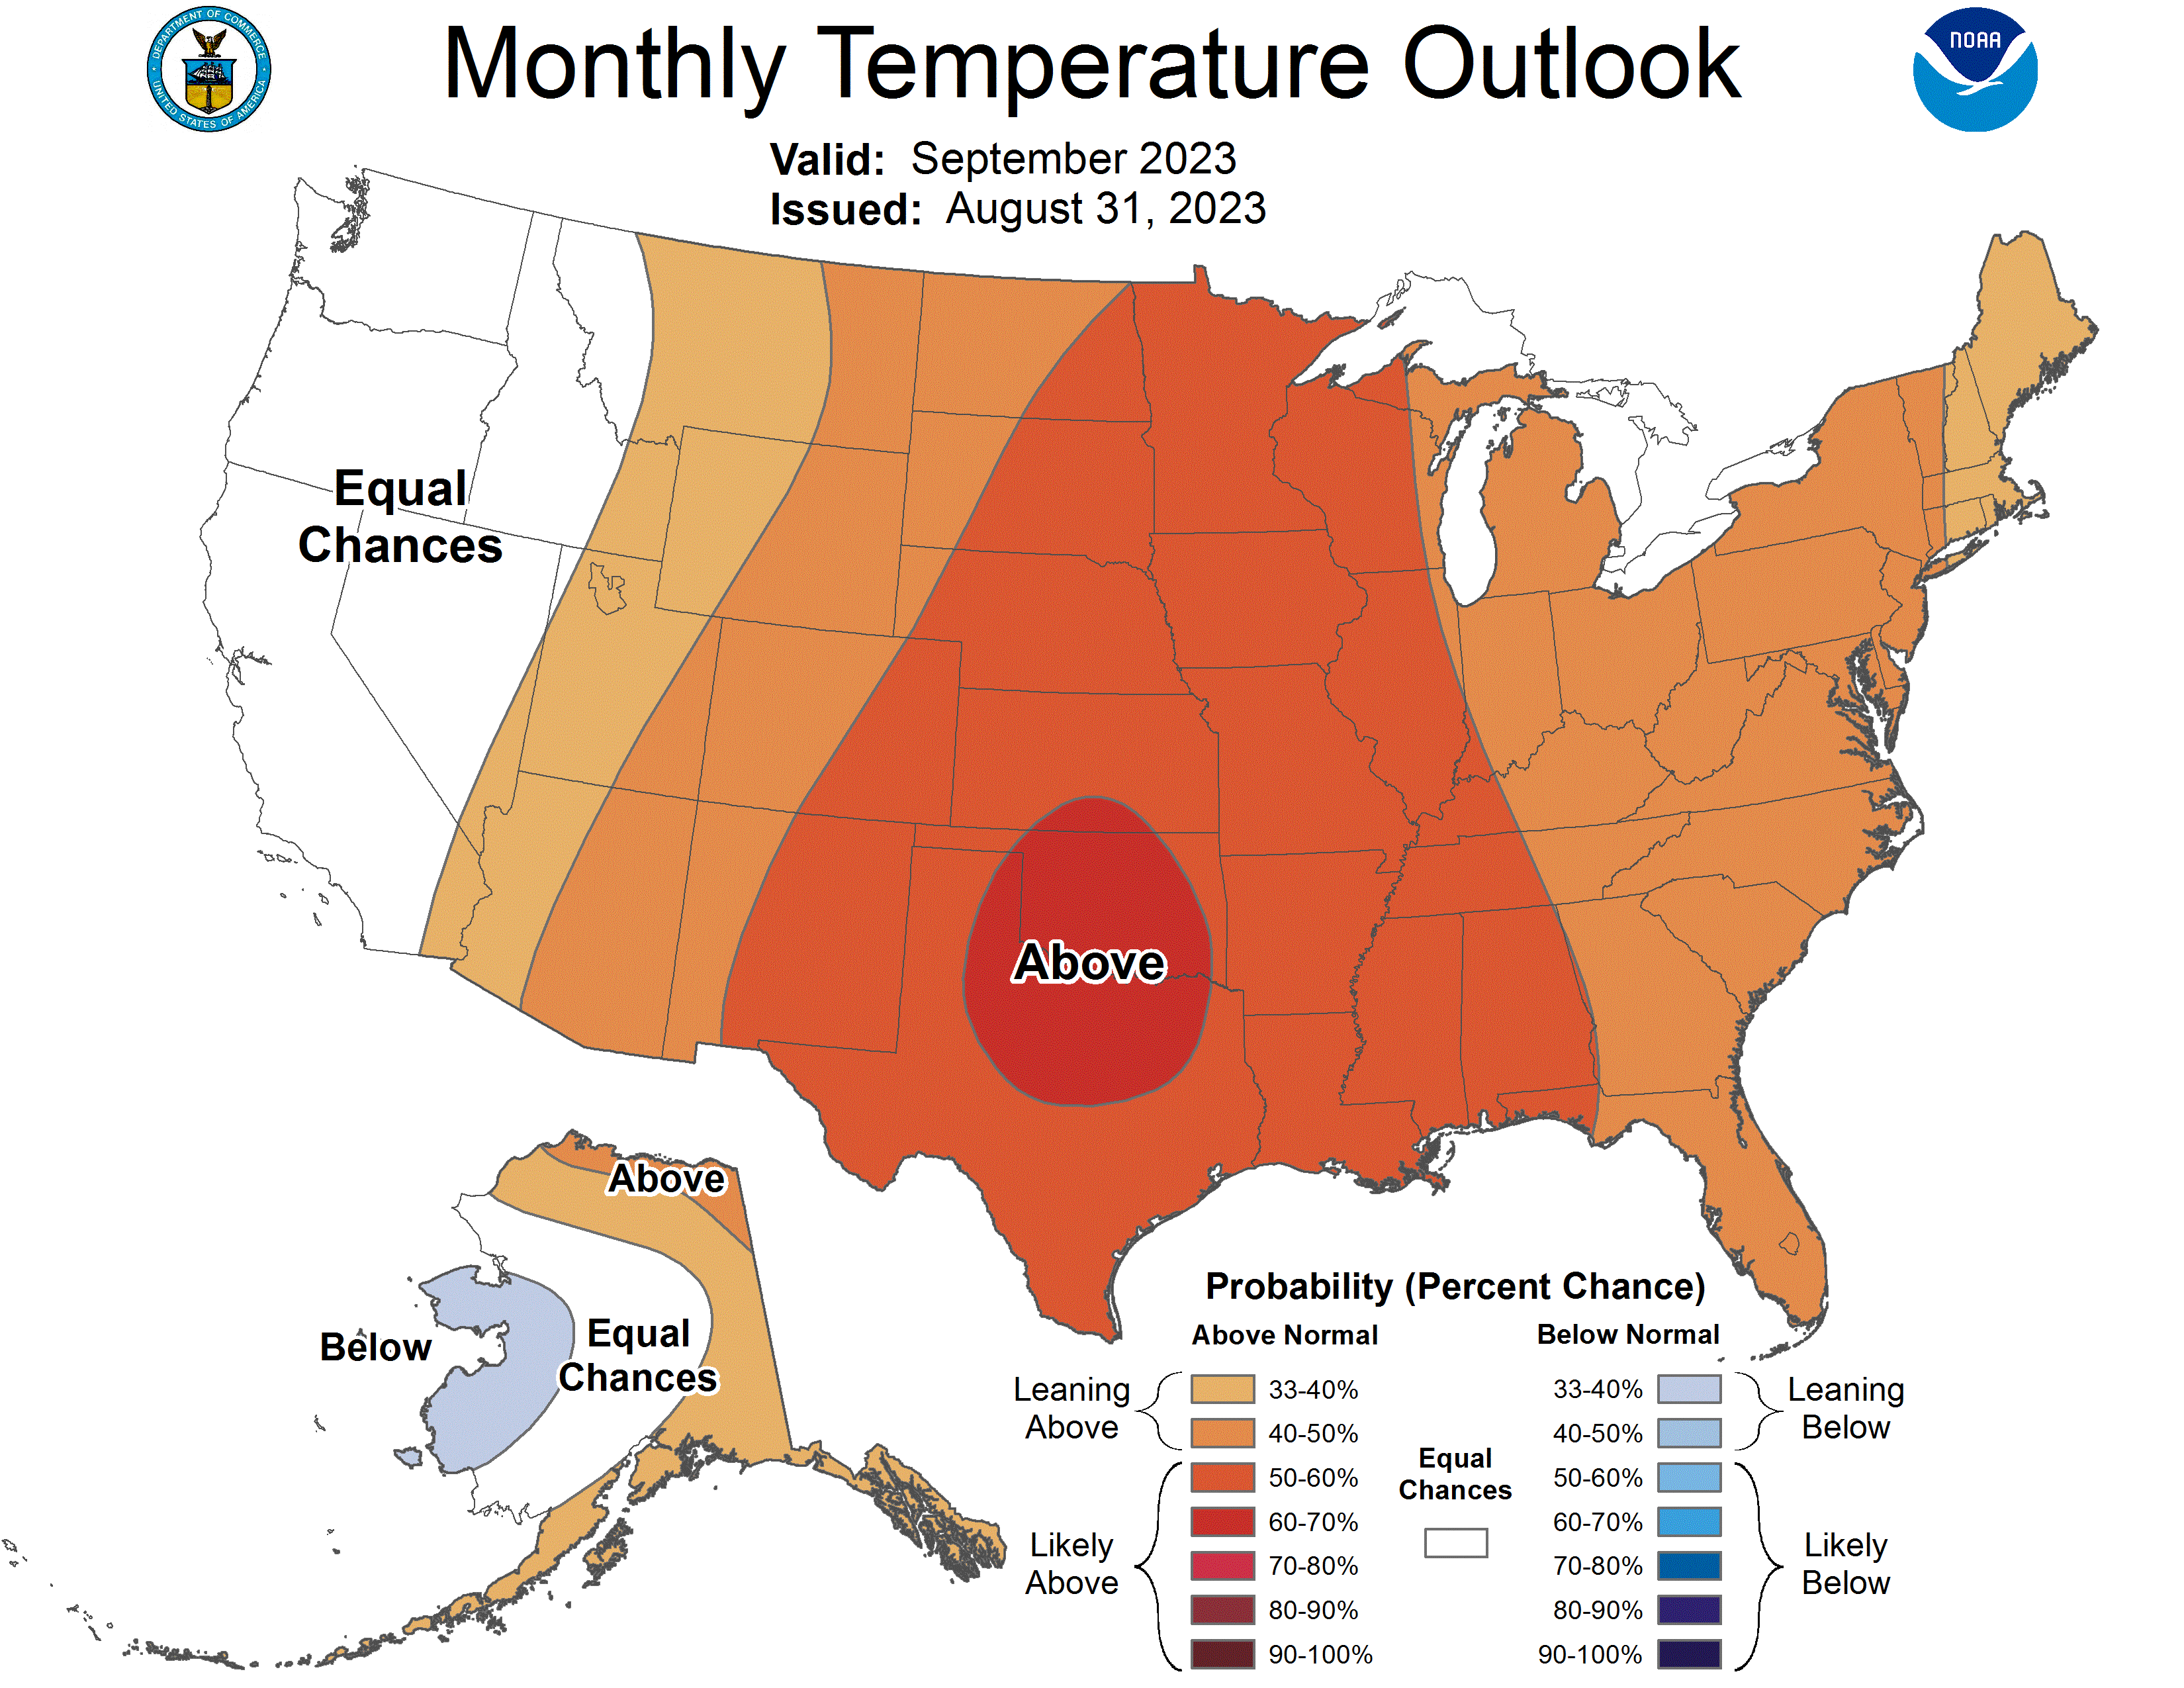
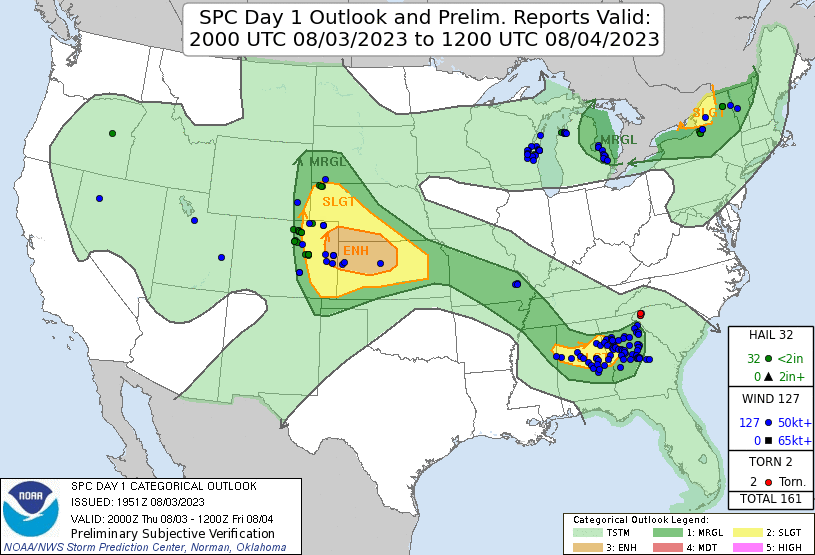
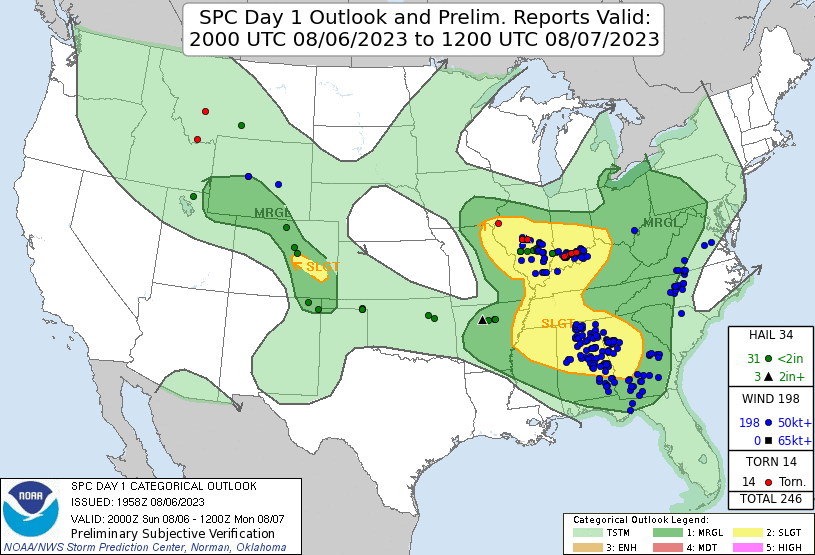
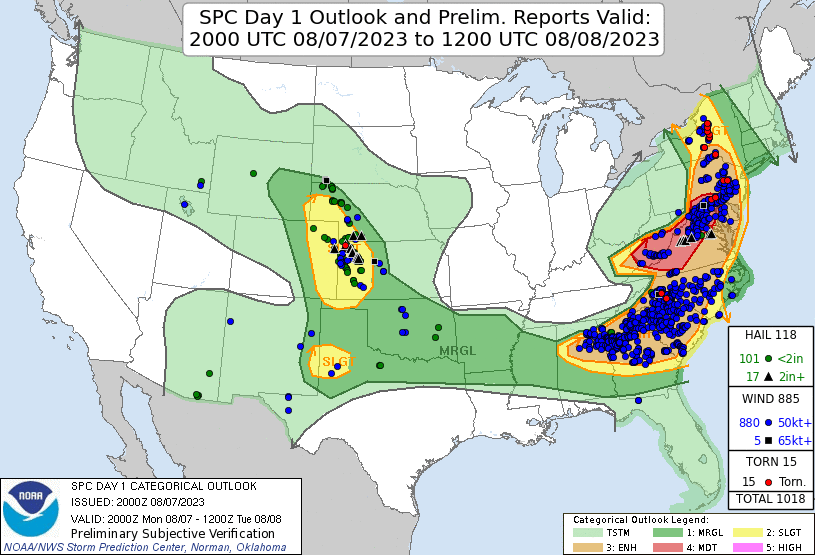
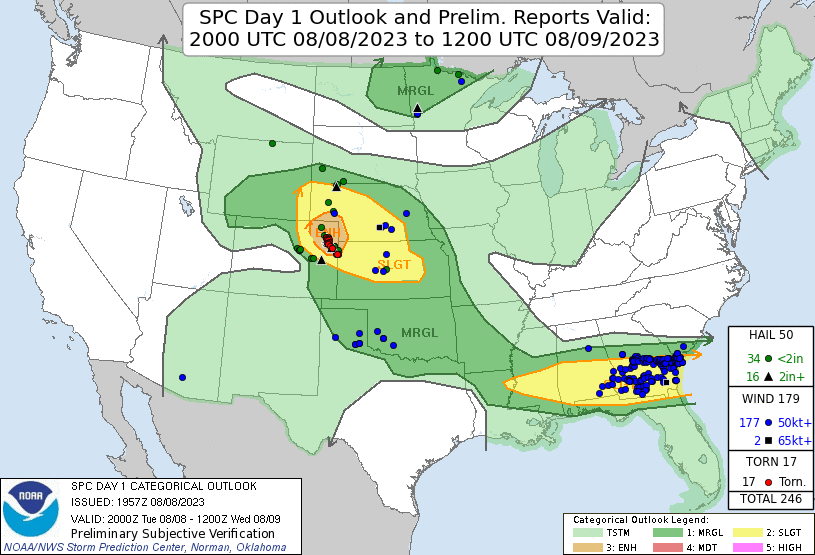
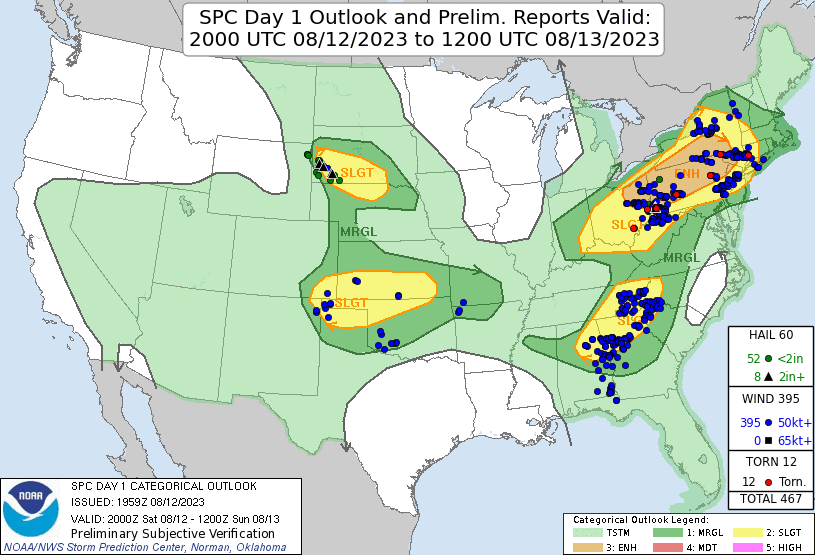
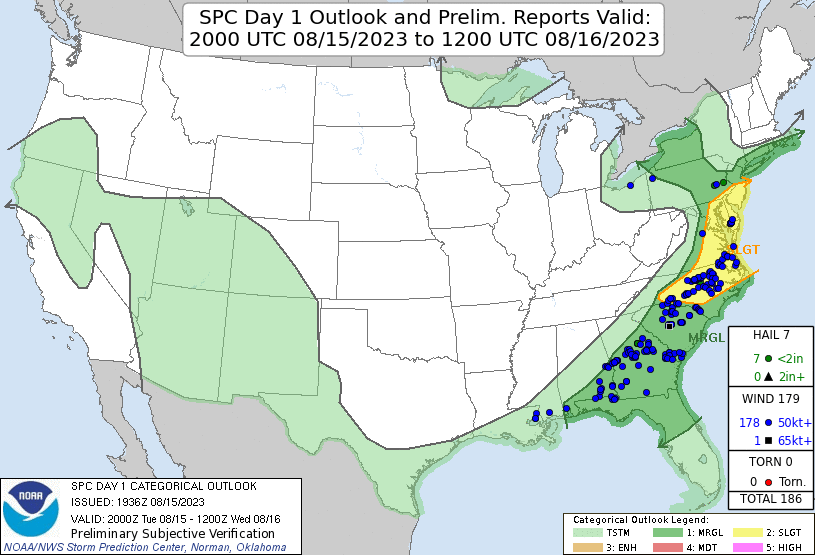
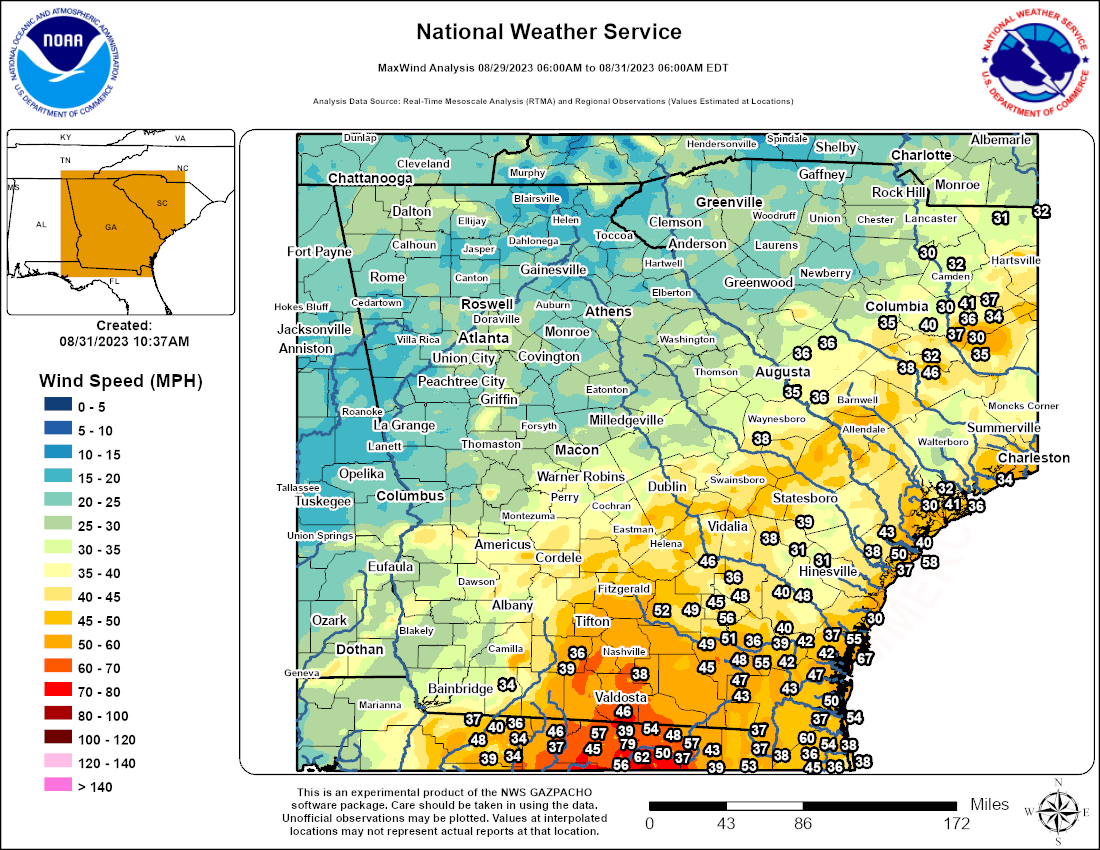
Climate Site Temperatures Precipitation Climate Site Maximum Temperature Max T Date *Indicates a daily record was set Climate Site Total Precipitation DFN (Departure Climate Site Maximum Daily Precip (in inches) Max P Date *Indicates a daily record was set Data prepared by NWS Peachtree City/Atlanta August 3rd thunderstorms: PWAT’s exceeding 2 inches and DCAPE in the excess of 1000+ J/KG were the ingredients for a straight-line wind event that damaged trees and knocked out power to many people across north and central Georgia on August 3rd. Due to the northwest flow the line was able to hold together and move southward across most of the CWA. August 6th Thunderstorms: On August 6th three lines of severe weather came through prompting multiple severe thunderstorm warnings across much of north and central Georgia as early as the early afternoon. CAPE values near 5000 J/KG, strong northwest flow, and high PWATs contributed to storms forming quickly and then congealing into lines. After the first line came through, cloud cover quickly diminished which allowed the atmosphere to recover quickly and storms the second and third line to move through causing more wind damage in areas that had already been hit. August 7th Thunderstorms: By 18z on August 7th, CAPE values were 5000 J/KG along with moderate shear values, 1400 J/KG DCAPE and lapse rates close to 8 C/KM. This would be the fuel for a significant damaging wind event across north and central Georgia. The first warning of the day for Dade County was a considerable severe thunderstorm warning for 70 mph winds. Throughout the afternoon as the line moves southward causing widespread tree damage, a secondary set of storms began in central and western Georgia which led to a considerable severe thunderstorm warning being issued for the office at Peachtree City and the Atlanta metro. The highest wind gust reported was at Peachtree DeKalb Airport at 71 mph. Ultimately widespread tree damage was reported across almost every single of our 96 counties. August 8th Thunderstorms: As the boundary that caused the storms on August 7th moves southward, 6000 J/KG of CAPE was analyzed at 4 pm over central and southern Georgia. This, in addition to the clearing cloud cover allowed for storms to form in a ripe environment for severe weather. As the storms formed, they quickly congealed into a line of strong to severe storms that caused widespread tree damage across central and southern Georgia. August 12th Thunderstorms: After a momentary break in widespread severe weather, northwest flow set back up with a quick shortwave that came through Tennessee into north Georgia. This was the main forcing factor for another MCS system. In the afternoon, a line was able to continue into North Georgia while another line formed in western GA just west of the metro which with 2000-3000 J/kg of CAPE was able to produce widespread tree damage across the metro and western Georgia. August 15th Thunderstorms: For our final northwest flow event, deep troughing was set up over much of the eastern United States dipping into Georgia. This along with 4000-5000 J/KG of CAPE and PWATs close to 2 inches provided the necessary fuel for a wind damage event. The first line started off extending from Athens to the south metro, while another line was forming to the NW of the metro. Eventually these lines would merge into one and push into central Georgia, causing widespread tree damage across central Georgia. August 28th Thunderstorms: Early on the 28th a surface boundary set up over the Athens area stretching into metro Atlanta, which caused showers and thunderstorms to build and stay stationary for around 6 hours. Slow Storm motion in addition to record breaking PWATs allowed for these showers and storms to be efficient rainfall producers with rainfall rates close to 4”/hour. Ultimately three flash flood warnings were issued with two being upgraded to considerable after seeing the high rain rates and 7-8 inches of rain had fallen. We had multiple reports of flooding over roadways mainly over Morgan and Walton counties in addition to a number of our hydro gauges flooding. Later that evening high rainfall rate thunderstorms set up over the Atlanta metro which ultimately led to 3-4 inches of rainfall which flooded many streets as well as caused many hydro gauges to go into minor flooding. August 29th Thunderstorms: Early on the 29th a surface boundary set up north Georgia, which caused showers and thunderstorms to build and stay stationary for around 6 hours. Slow Storm motion in addition to record breaking PWATs allowed for these showers and storms to be efficient rainfall producers with rainfall rates close to 4”/hour. Ultimately four flash flood warnings were issued with two being upgraded to considerable after seeing the high rain rates and 4-5 inches of rain had fallen. We had multiple reports of flooding over roadways especially over the city of Calhoun with apartments being flooded as well. In addition, a number of our hydro gauges went into minor flooding in the areas with flash flood warnings. Later that evening along the surface front, high rainfall rate thunderstorms set up over the Atlanta metro which ultimately led to 3-4 inches of rainfall which flooded many streets as well as caused many hydro gauges to go into minor flooding. Hurricane Idalia - August 30th Thunderstorms: As the boundary that caused the storms on August 7th moves southward, 6000 J/KG of CAPE was analyzed at 4 pm over central and southern Georgia. This, in addition to the clearing cloud cover allowed for storms to form in a ripe environment for severe weather. As the storms formed, they quickly congealed into a line of strong to severe storms that caused widespread tree damage across central and southern Georgia. Based on the Climate Prediction Center's outlook for September, Georgia has a 40% to 50% chance for above normal temperatures. North and central Georgia have a equal chances of above or below normal precipitation. Data prepared by NWS Peachtree City/Atlanta.
Overview
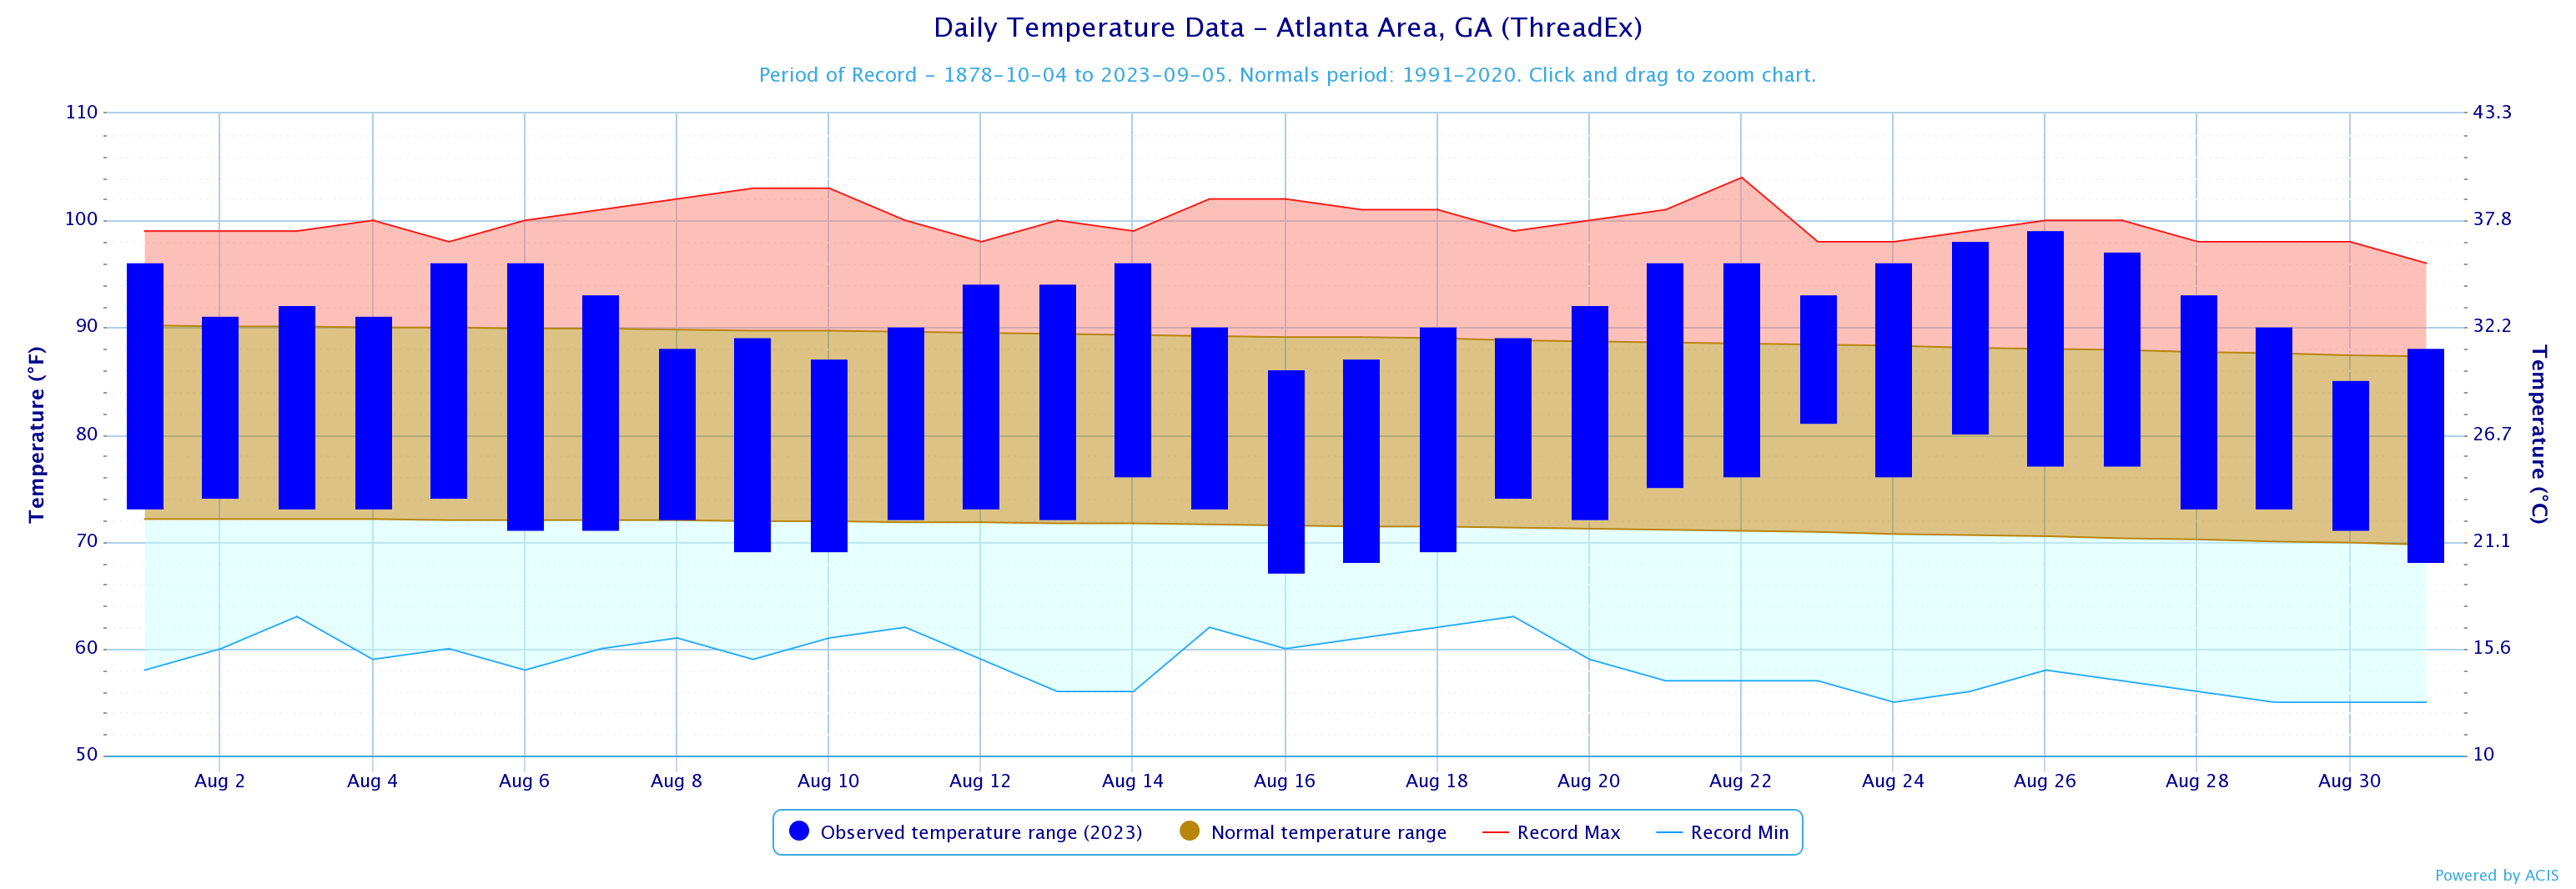
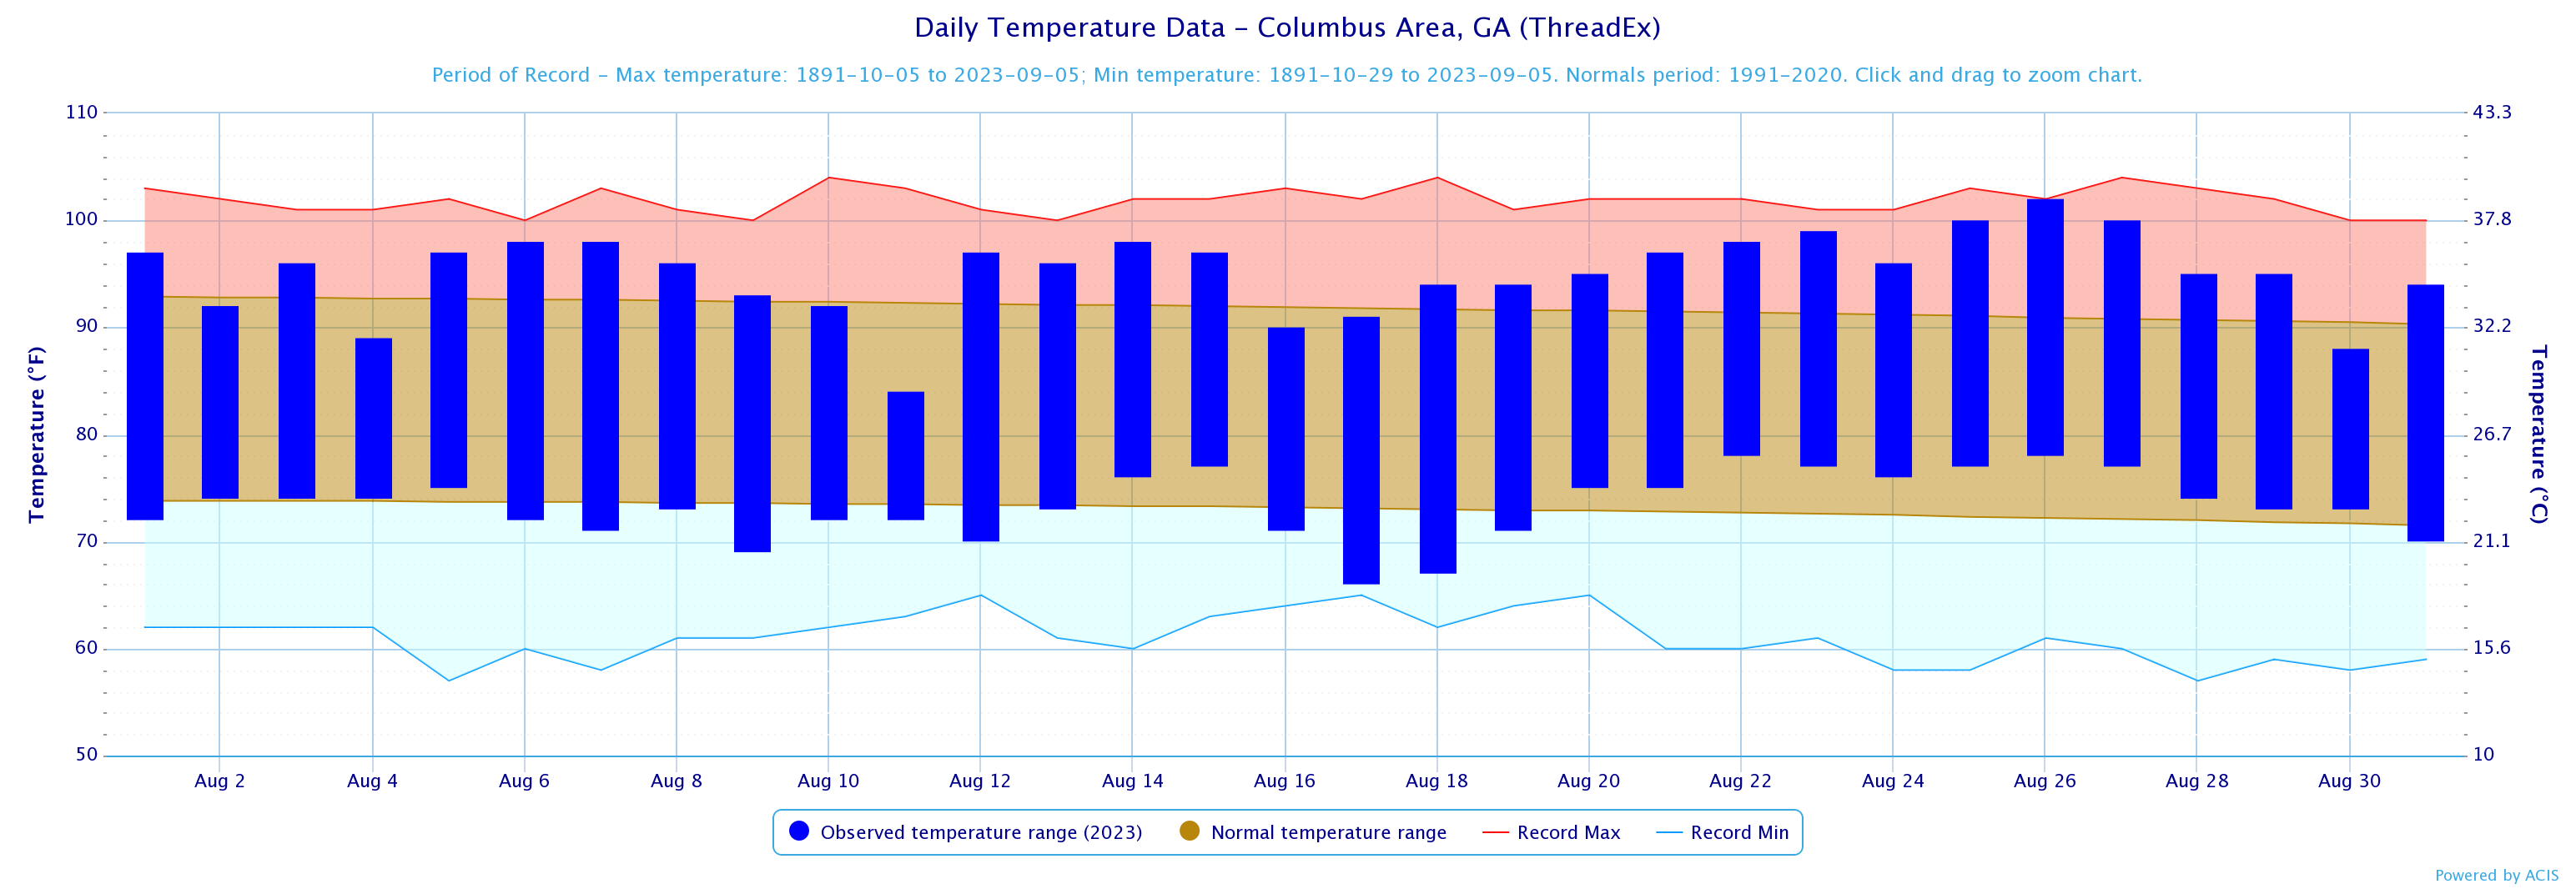
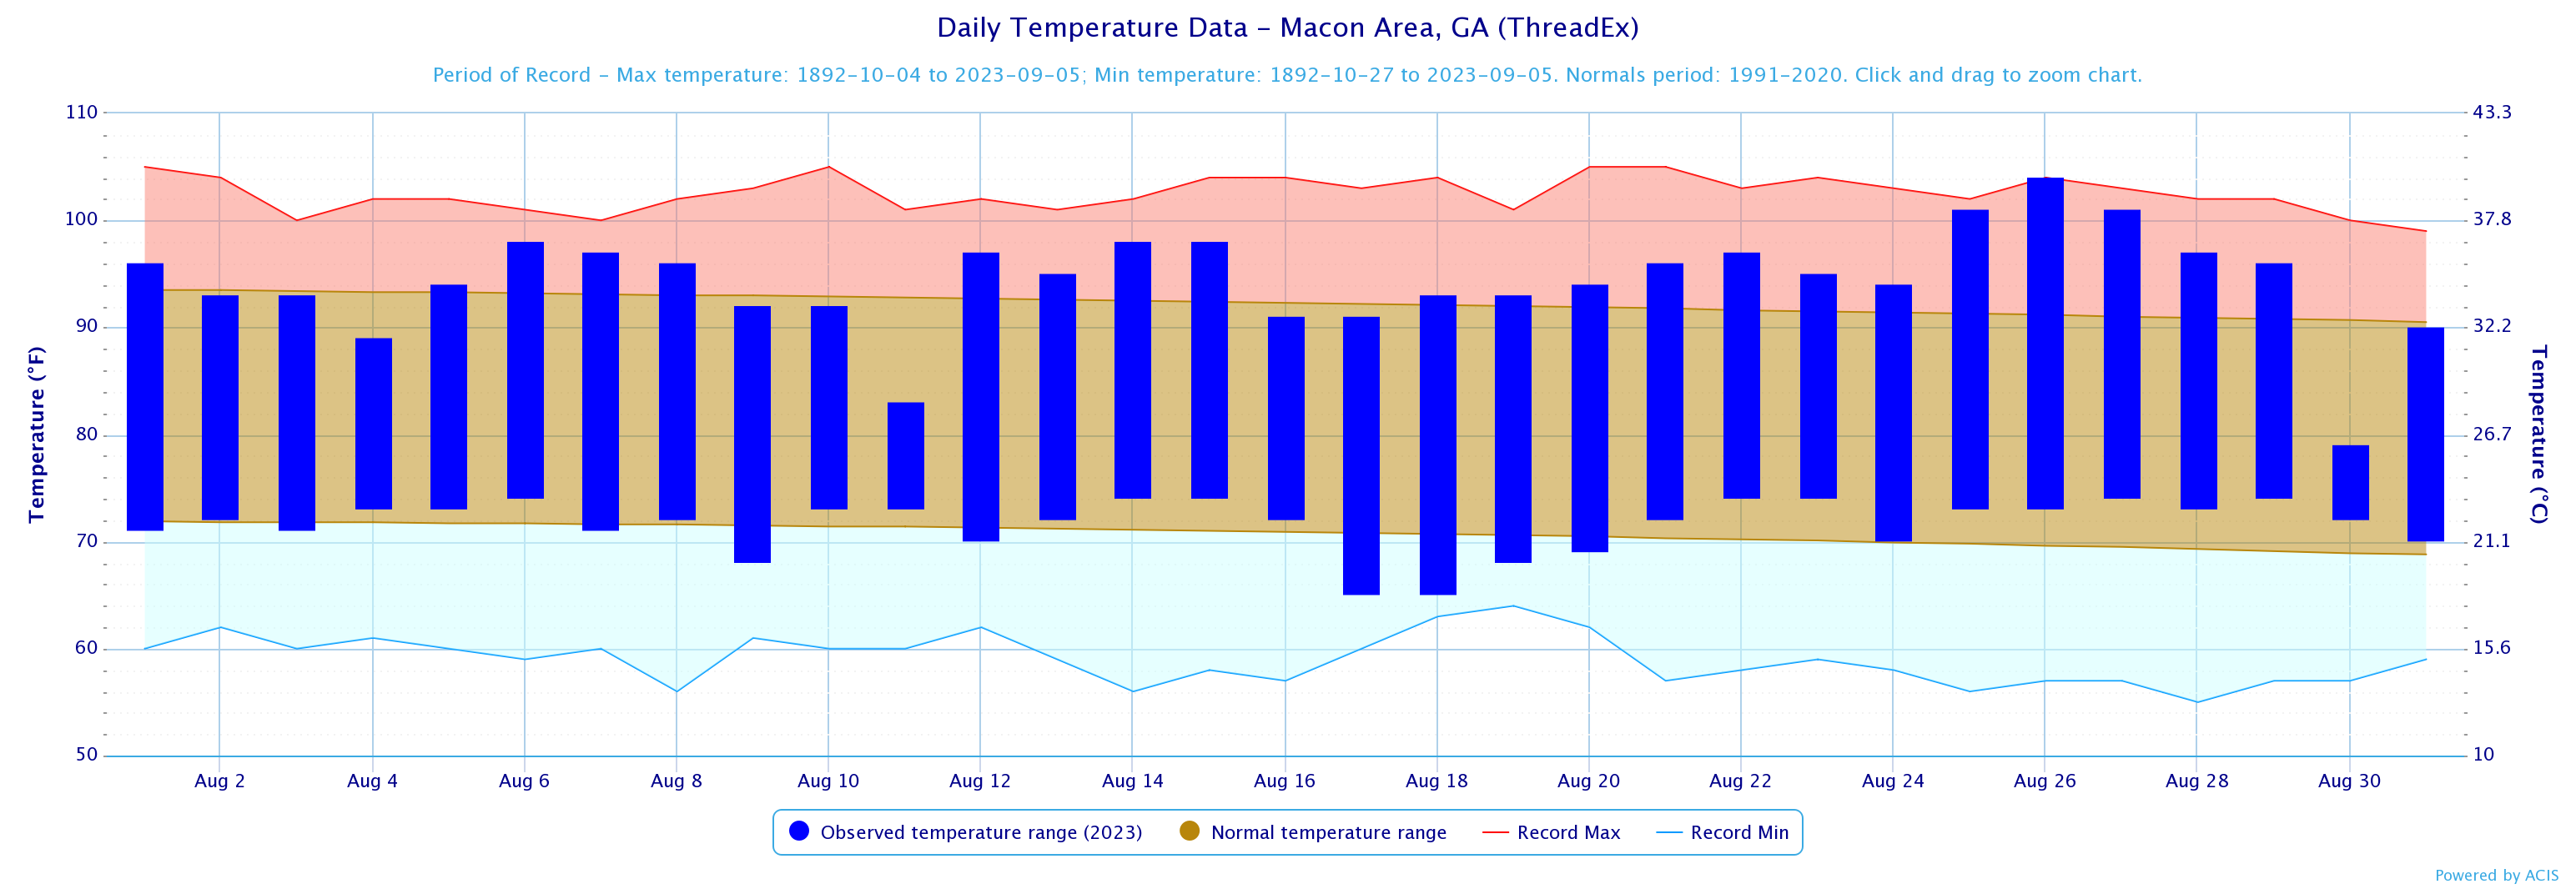
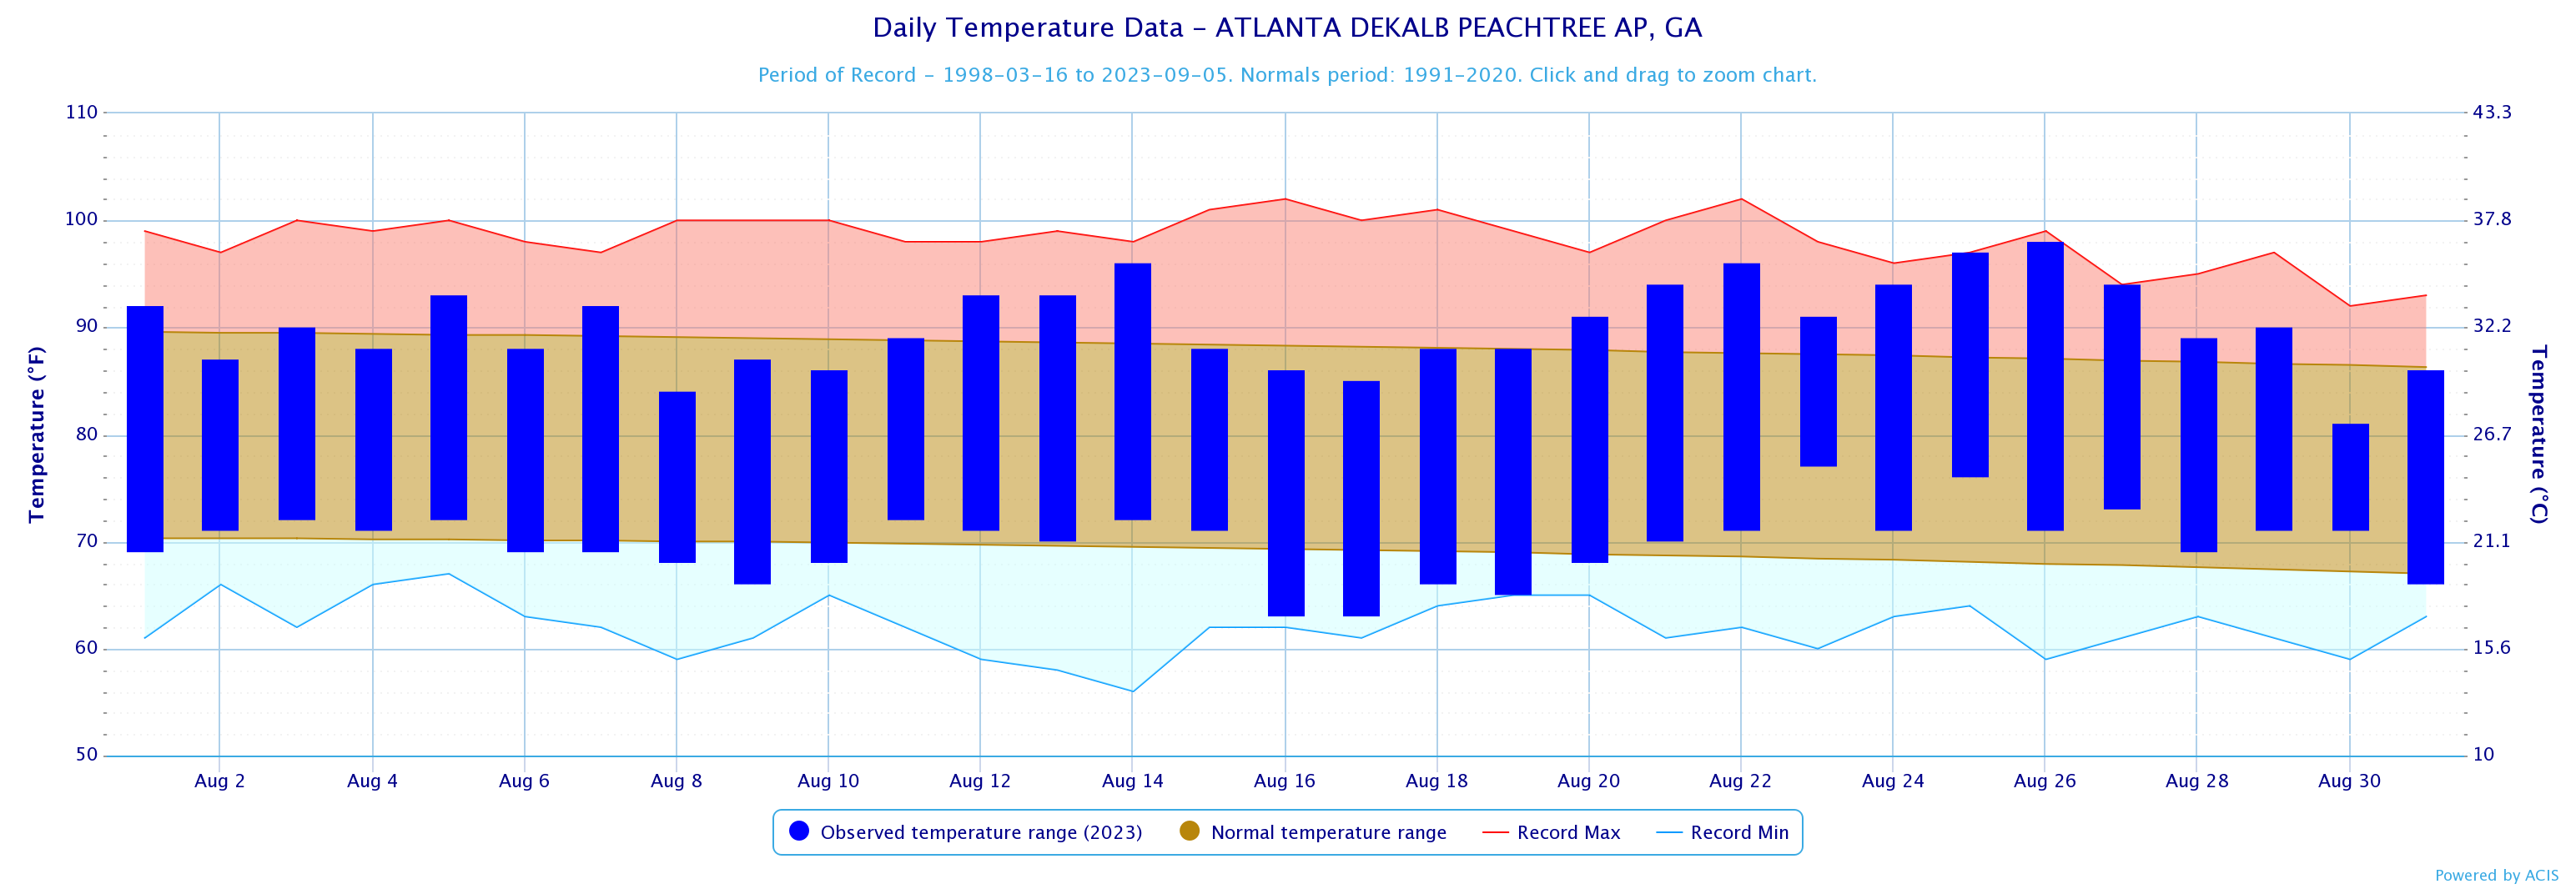
Climate Graphics
Records
Events
September Outlook
Below are the overview stats for August 2023 for our 10 climate sites.
August 2023 Monthly Rankings
Athens
32nd Warmest
48th Wettest
Atlanta
6th Warmest
46th Wettest
Columbus
8th Warmest
42nd Driest
Macon
12th Warmest
38th Wettest
August 2023 Climate Averages
Climate Site
Month Temp (°F)
Average Temp
Departure from normal
Athens
79.9
79.8
0.1
Atlanta
82.6
80.2
2.4
Columbus
84.2
82.4
1.8
Macon
82.9
81.4
1.5
Dekalb Peachtree Arpt
79.9
78.6
1.3
Fulton Co Arpt
80.7
79.3
1.4
Gainesville
79.7
77.9
1.8
Peachtree City
80.0
79.8
0.2
Rome
80.7
79.5
1.2
August 2023 Temperature Climate Statistics
Minimum Temperature
Min T Date
Athens
99
8/26
64
8/17
Atlanta
99
8/26
67
8/16
Columbus
102
8/26
66
8/17
Macon
104
8/26
65
8/17
Dekalb Peachtree Arpt
98
8/26
63
8/16
Fulton Co Arpt
98
8/26,27
63
8/16,17
Gainesville
99
8/26
64
8/16,17
Peachtree City
98
8/26
62
8/17
Rome
101
8/25
62
8/17
August 2023 Precipitation Climate Statistics
Average Precipitation
From Normal)
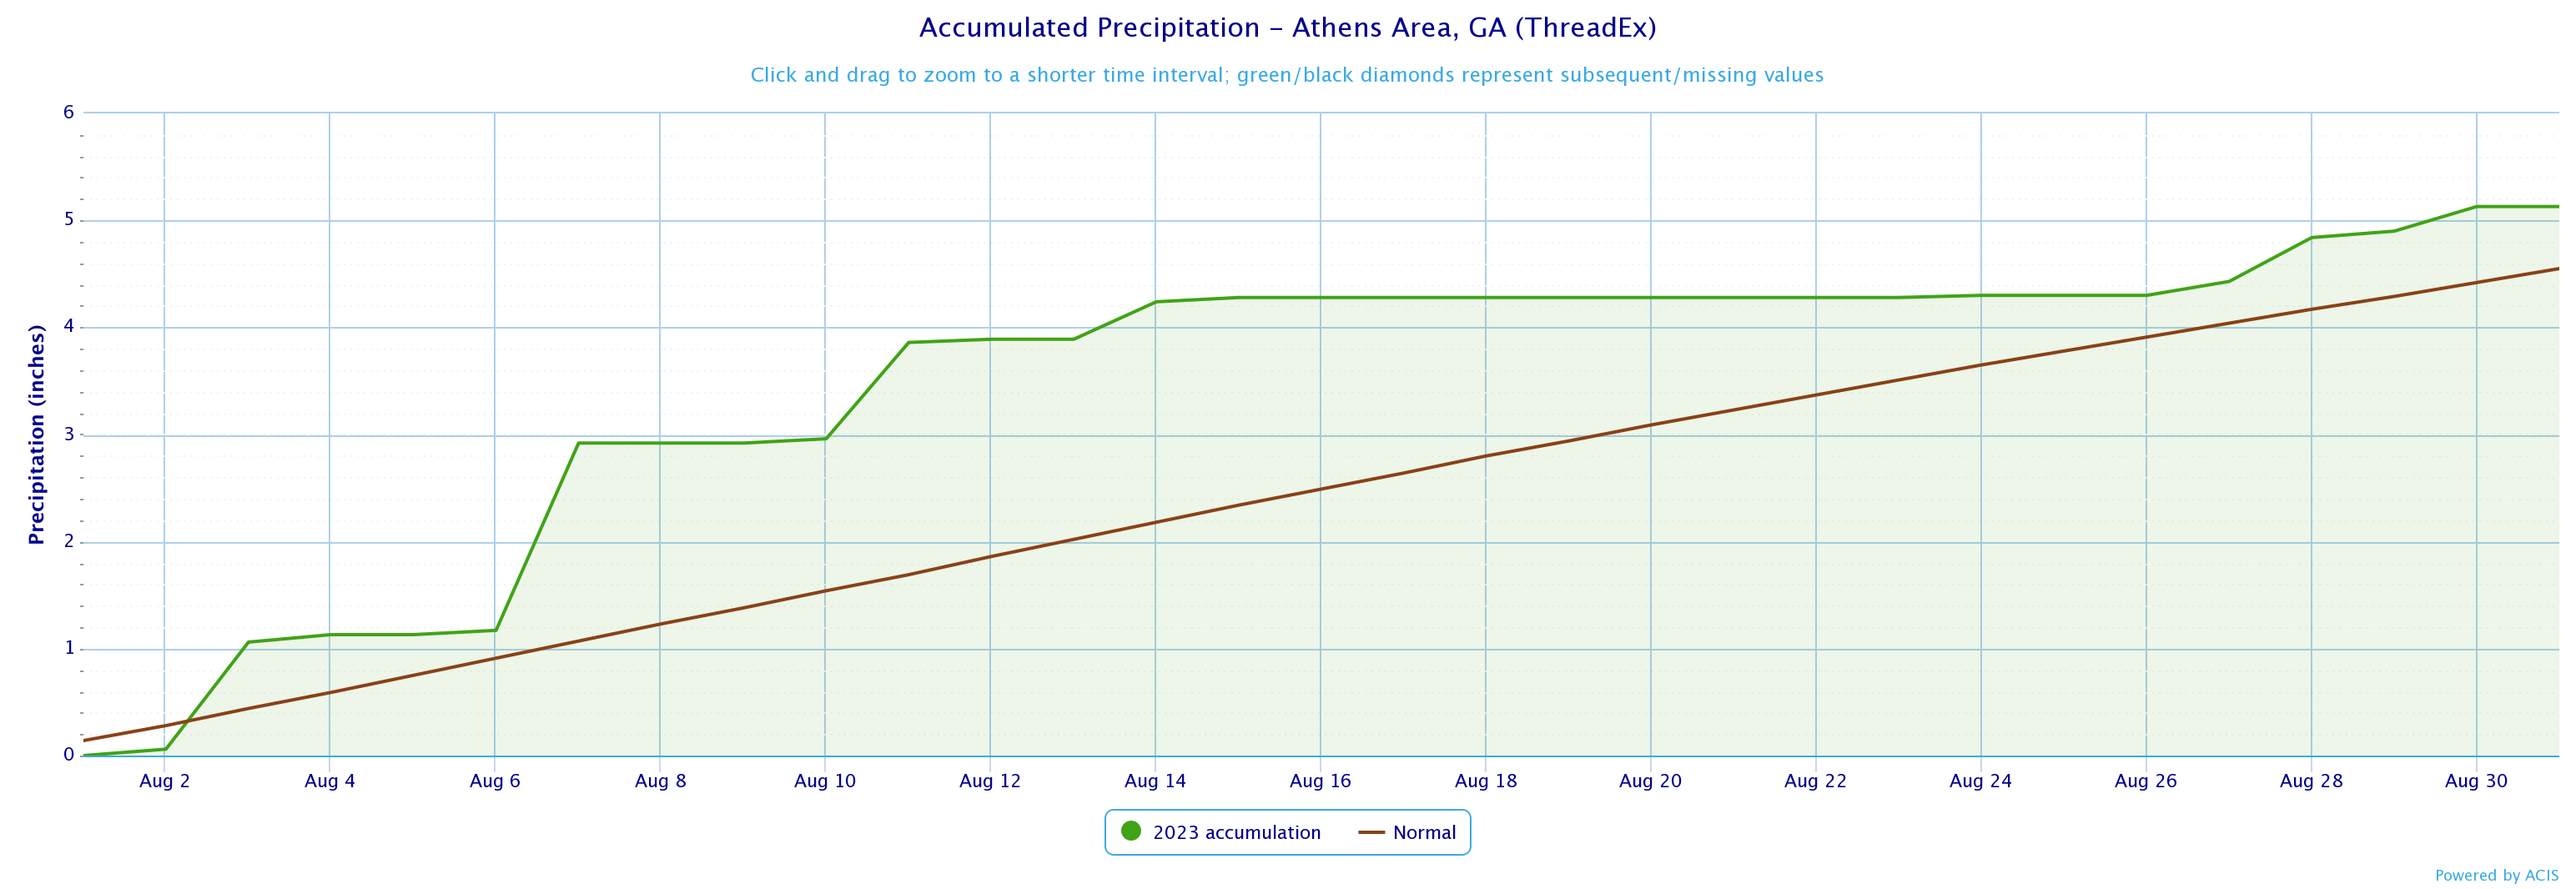
Athens
5.13
4.55
0.58
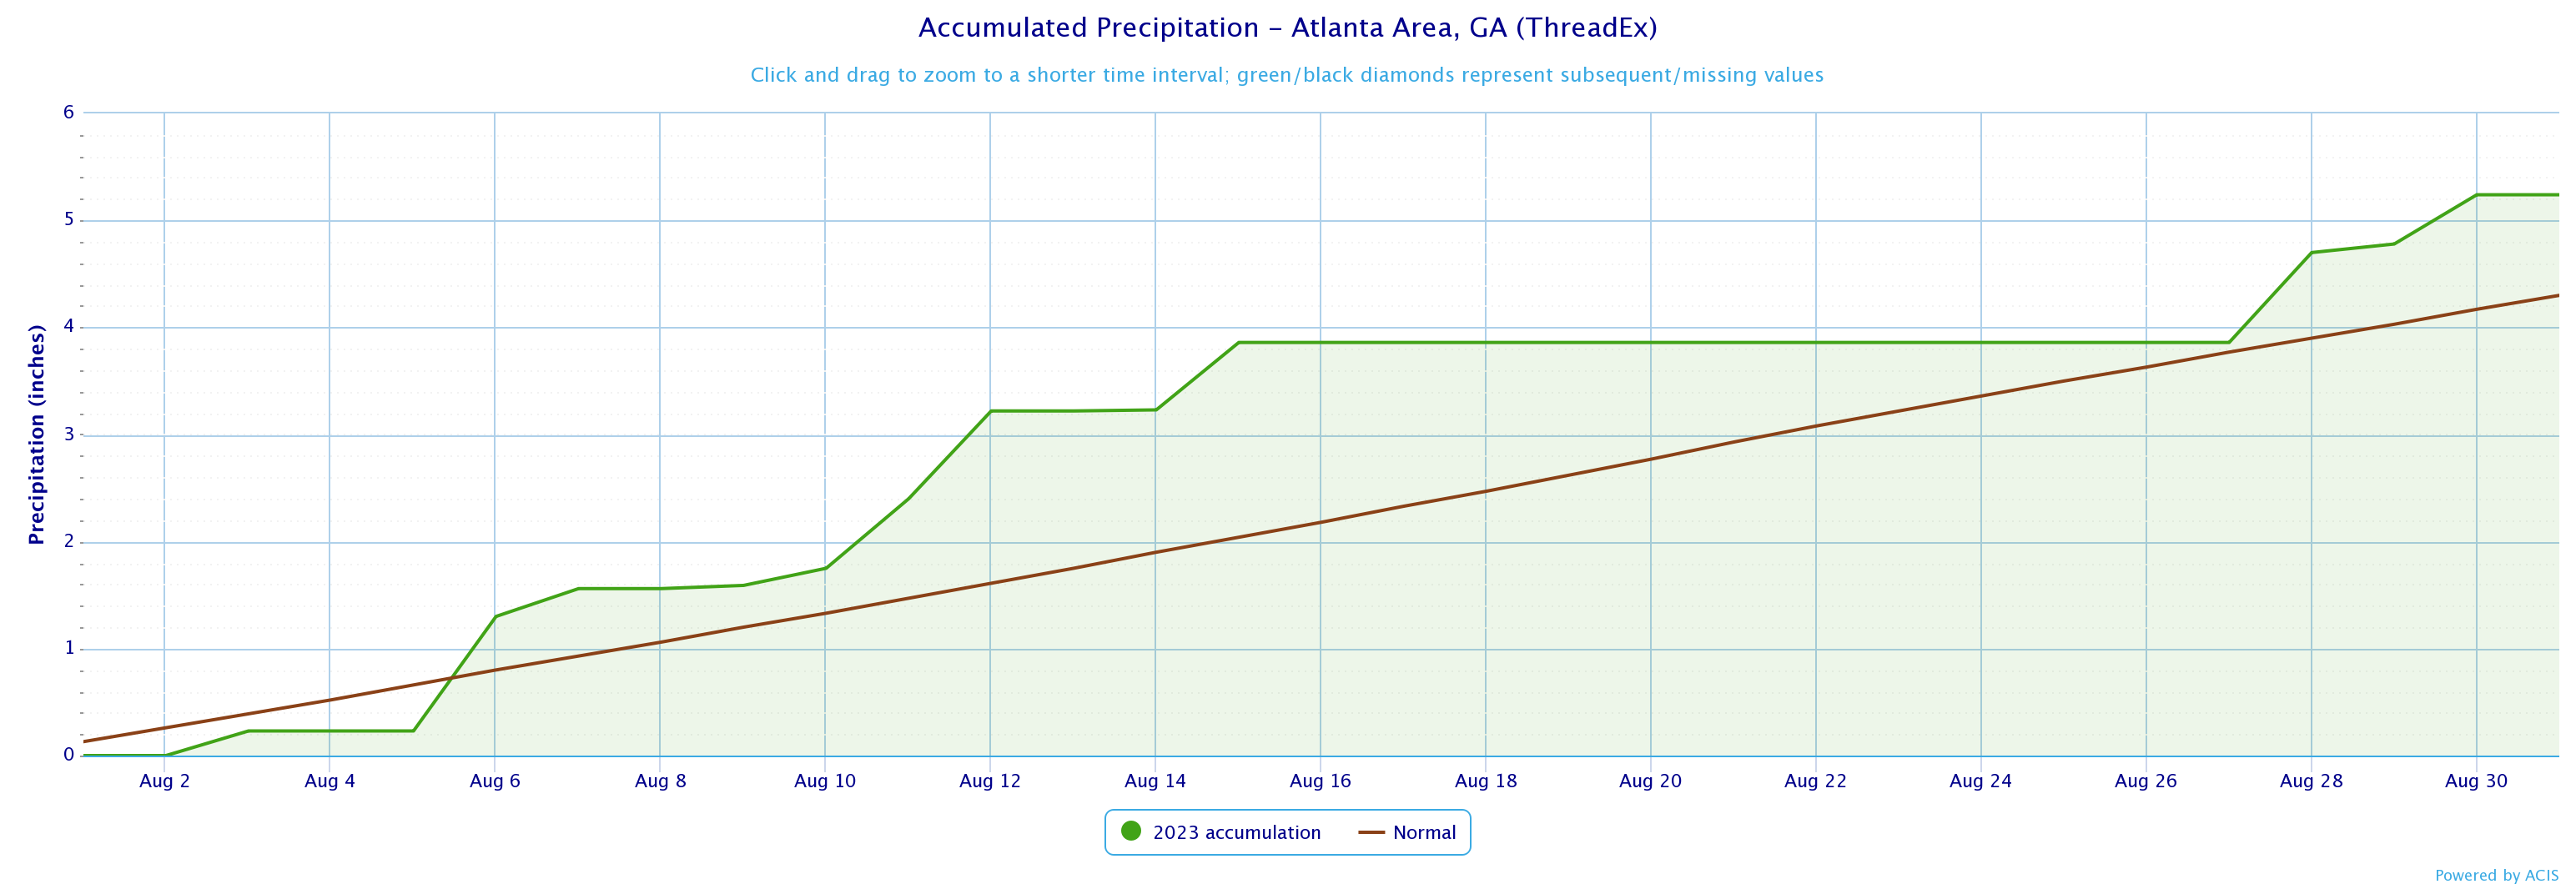
Atlanta
5.24
4.3
0.94
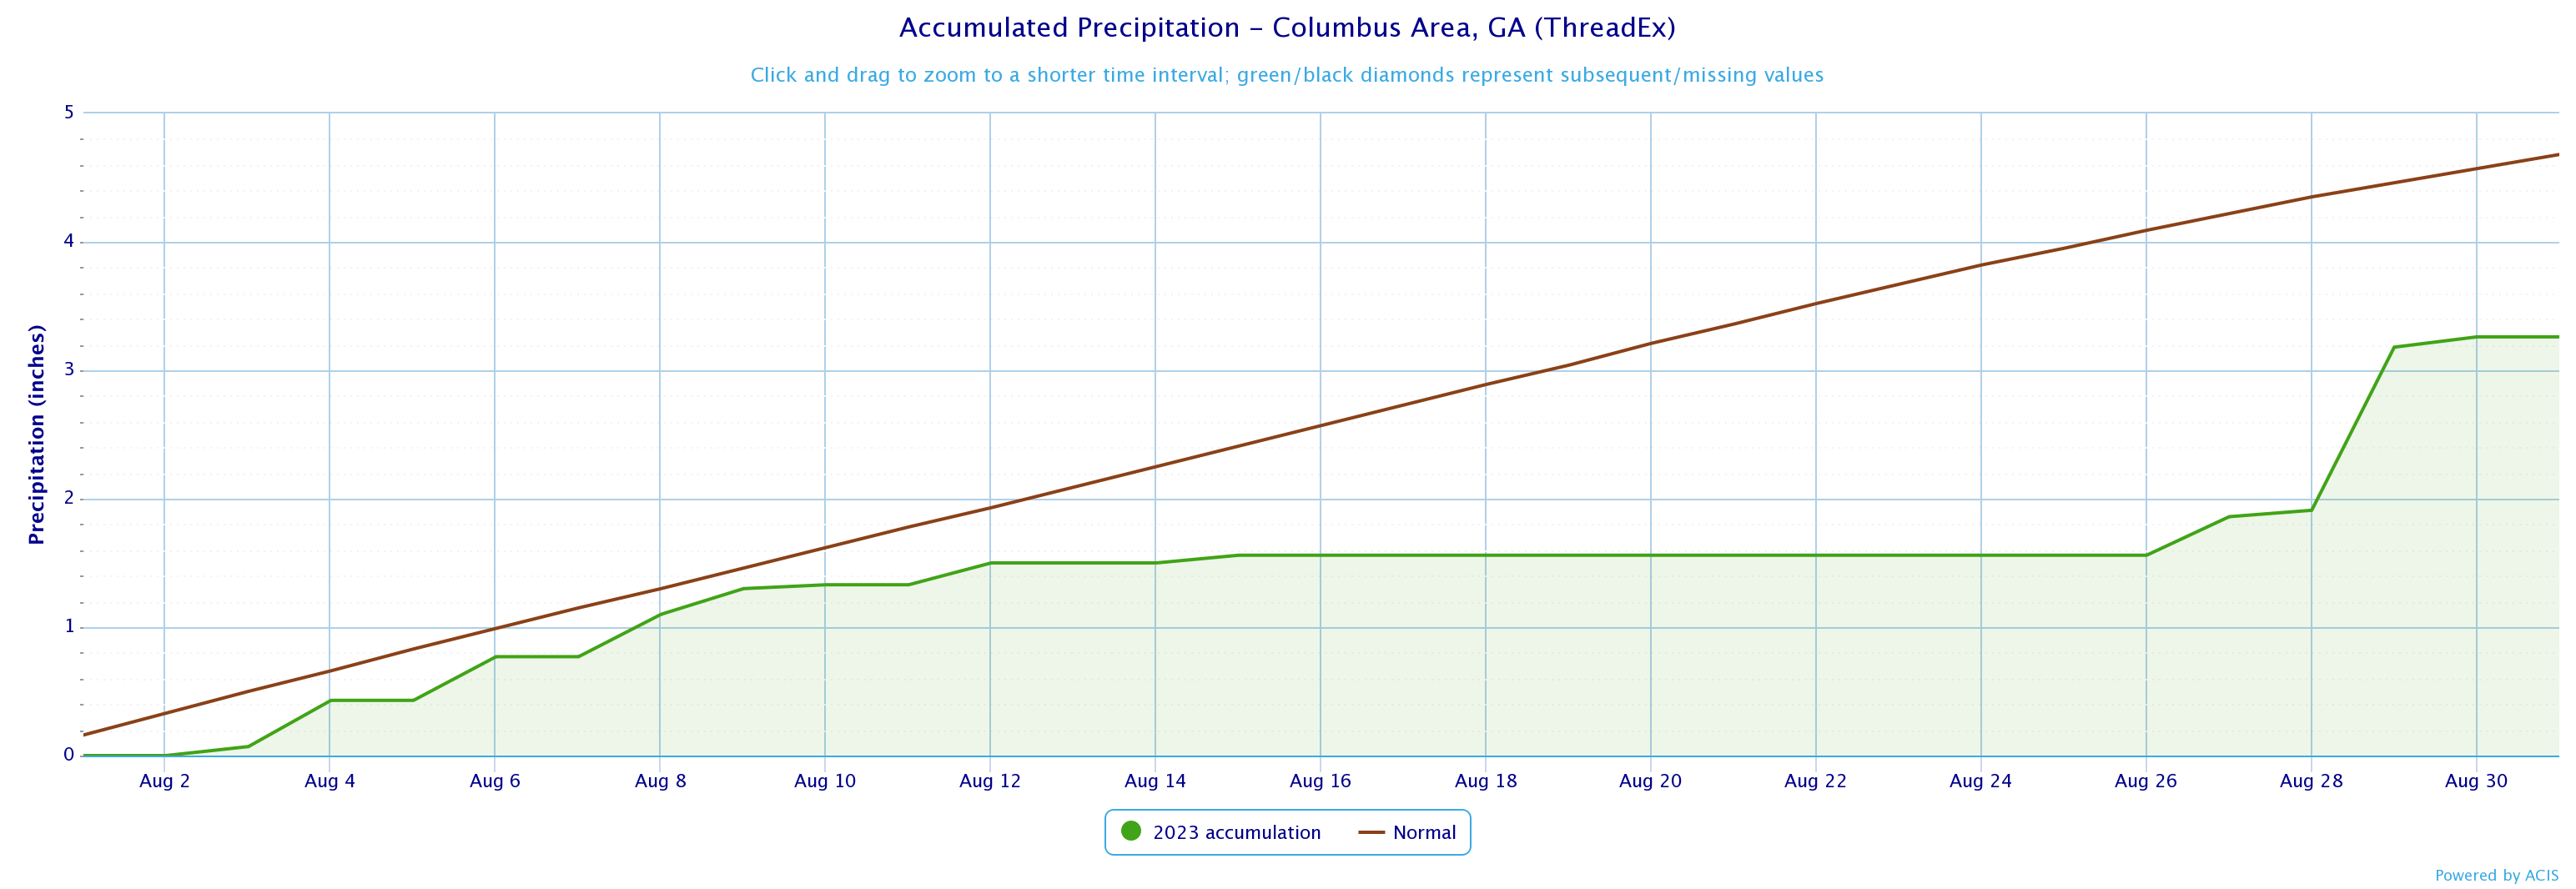
Columbus
3.26
4.68
-1.42
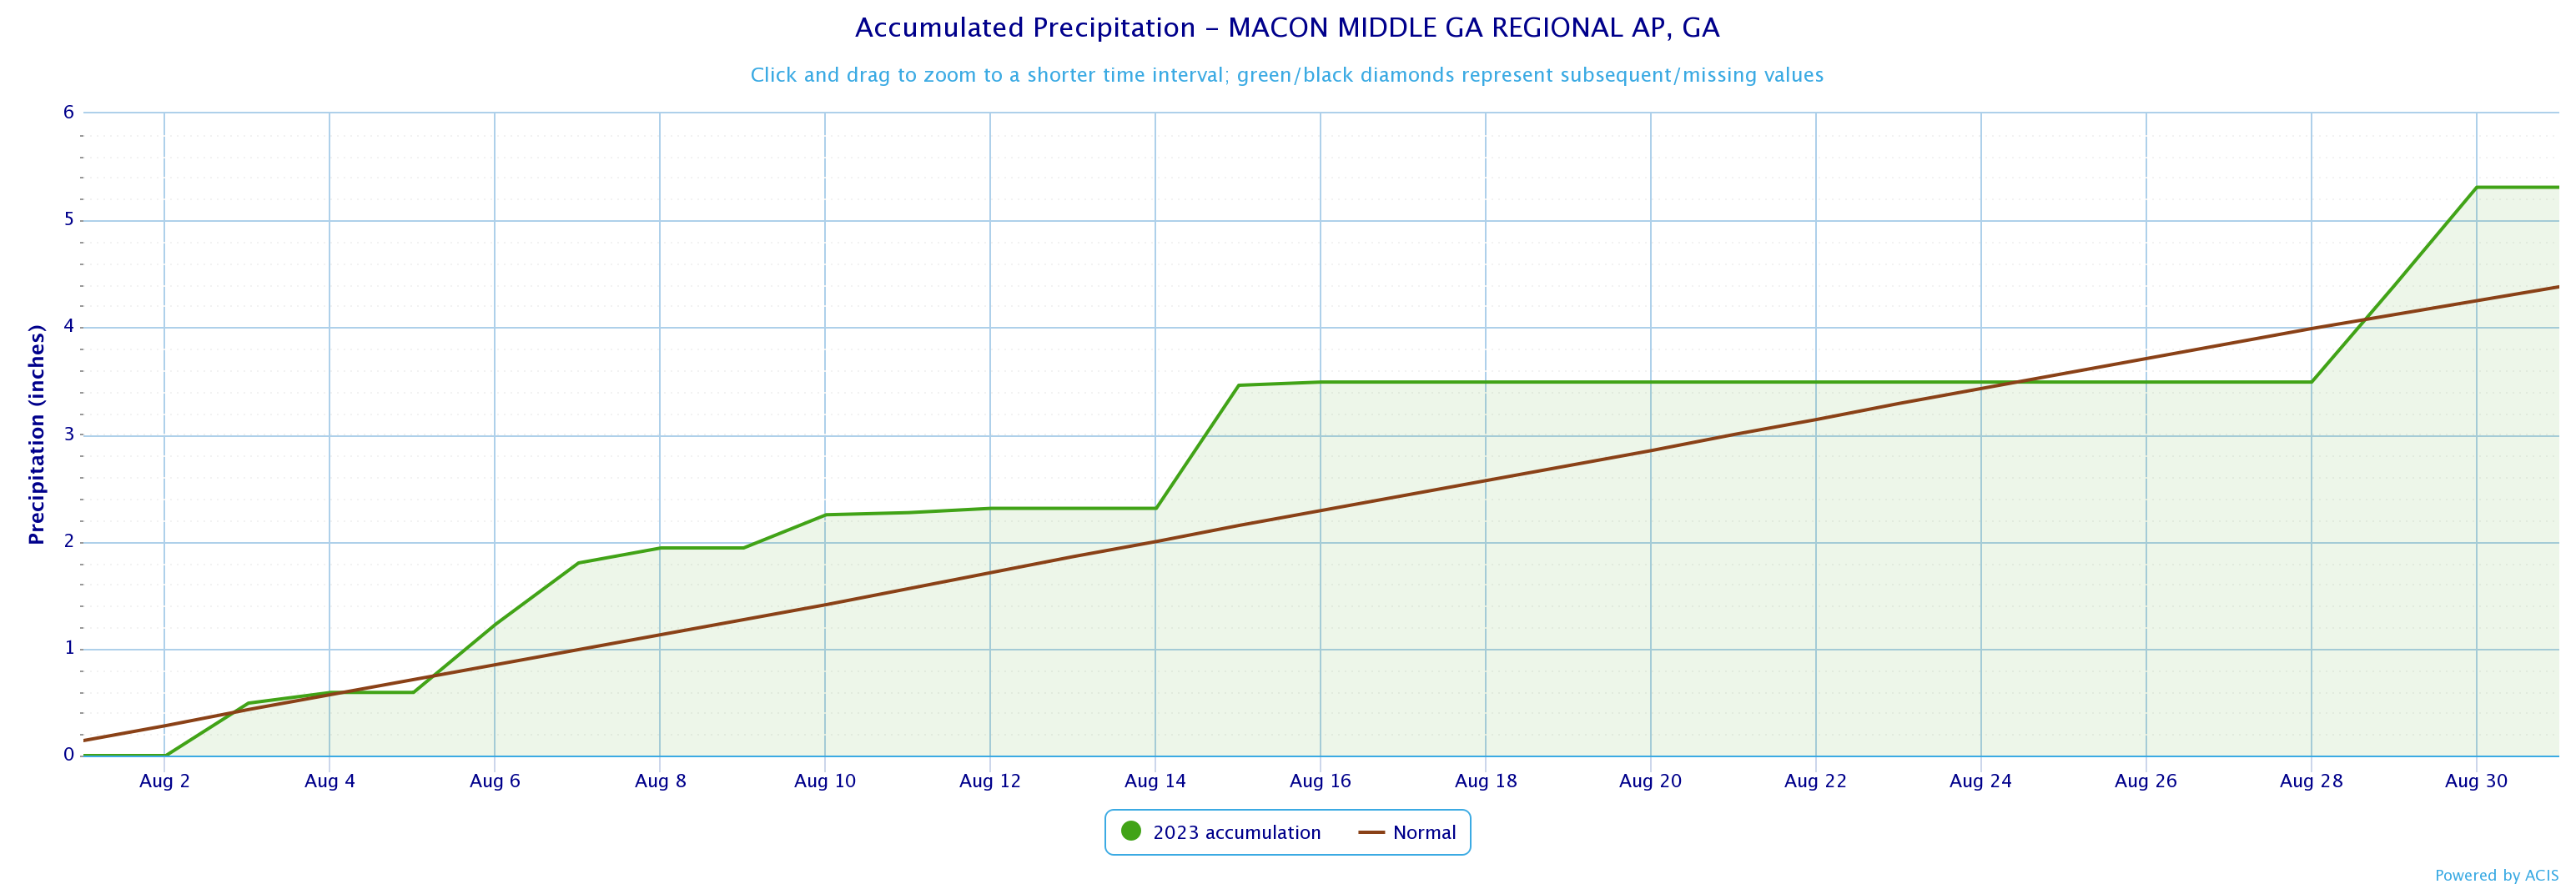
Macon
5.31
4.38
0.93
Dekalb Peachtree Arpt
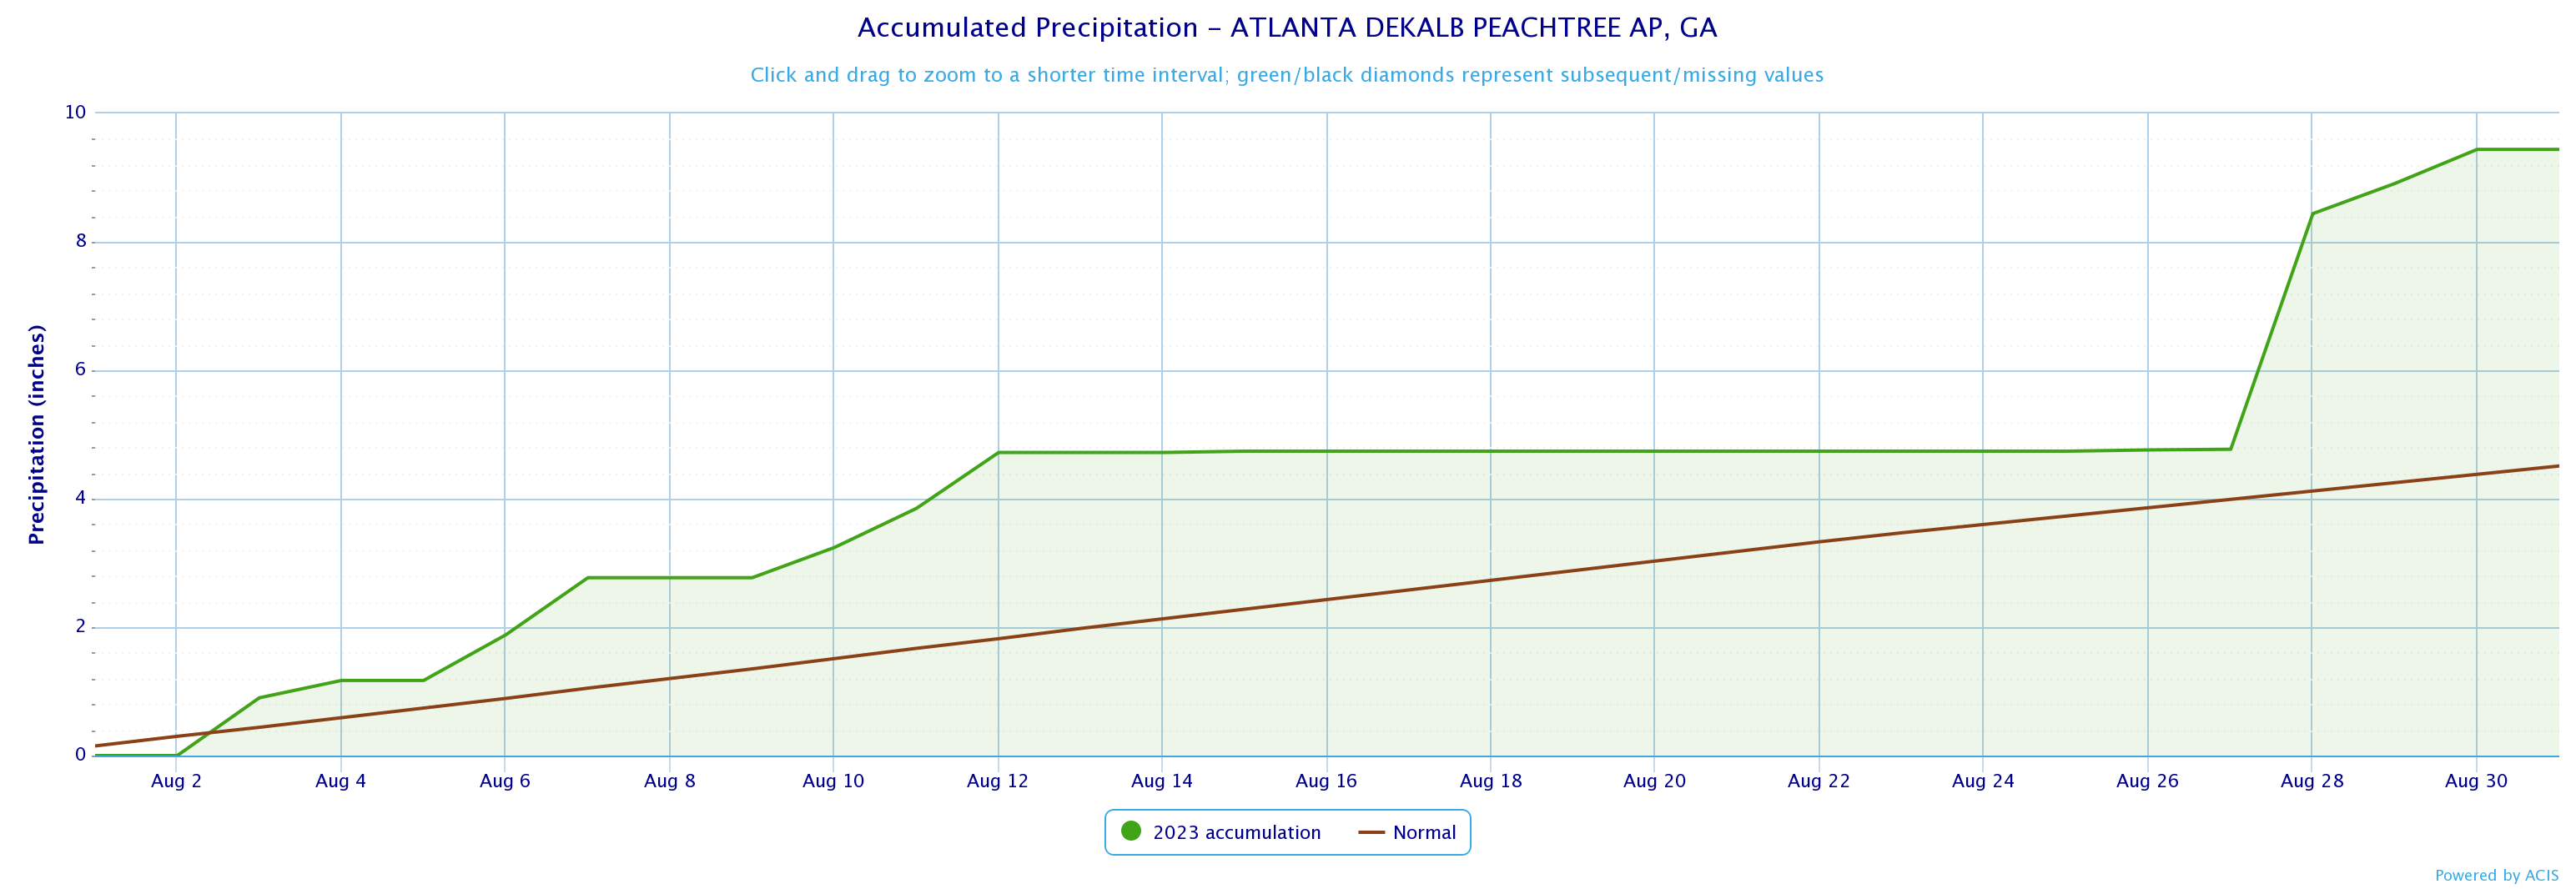
9.44
4.51
4.93
Fulton County Arpt
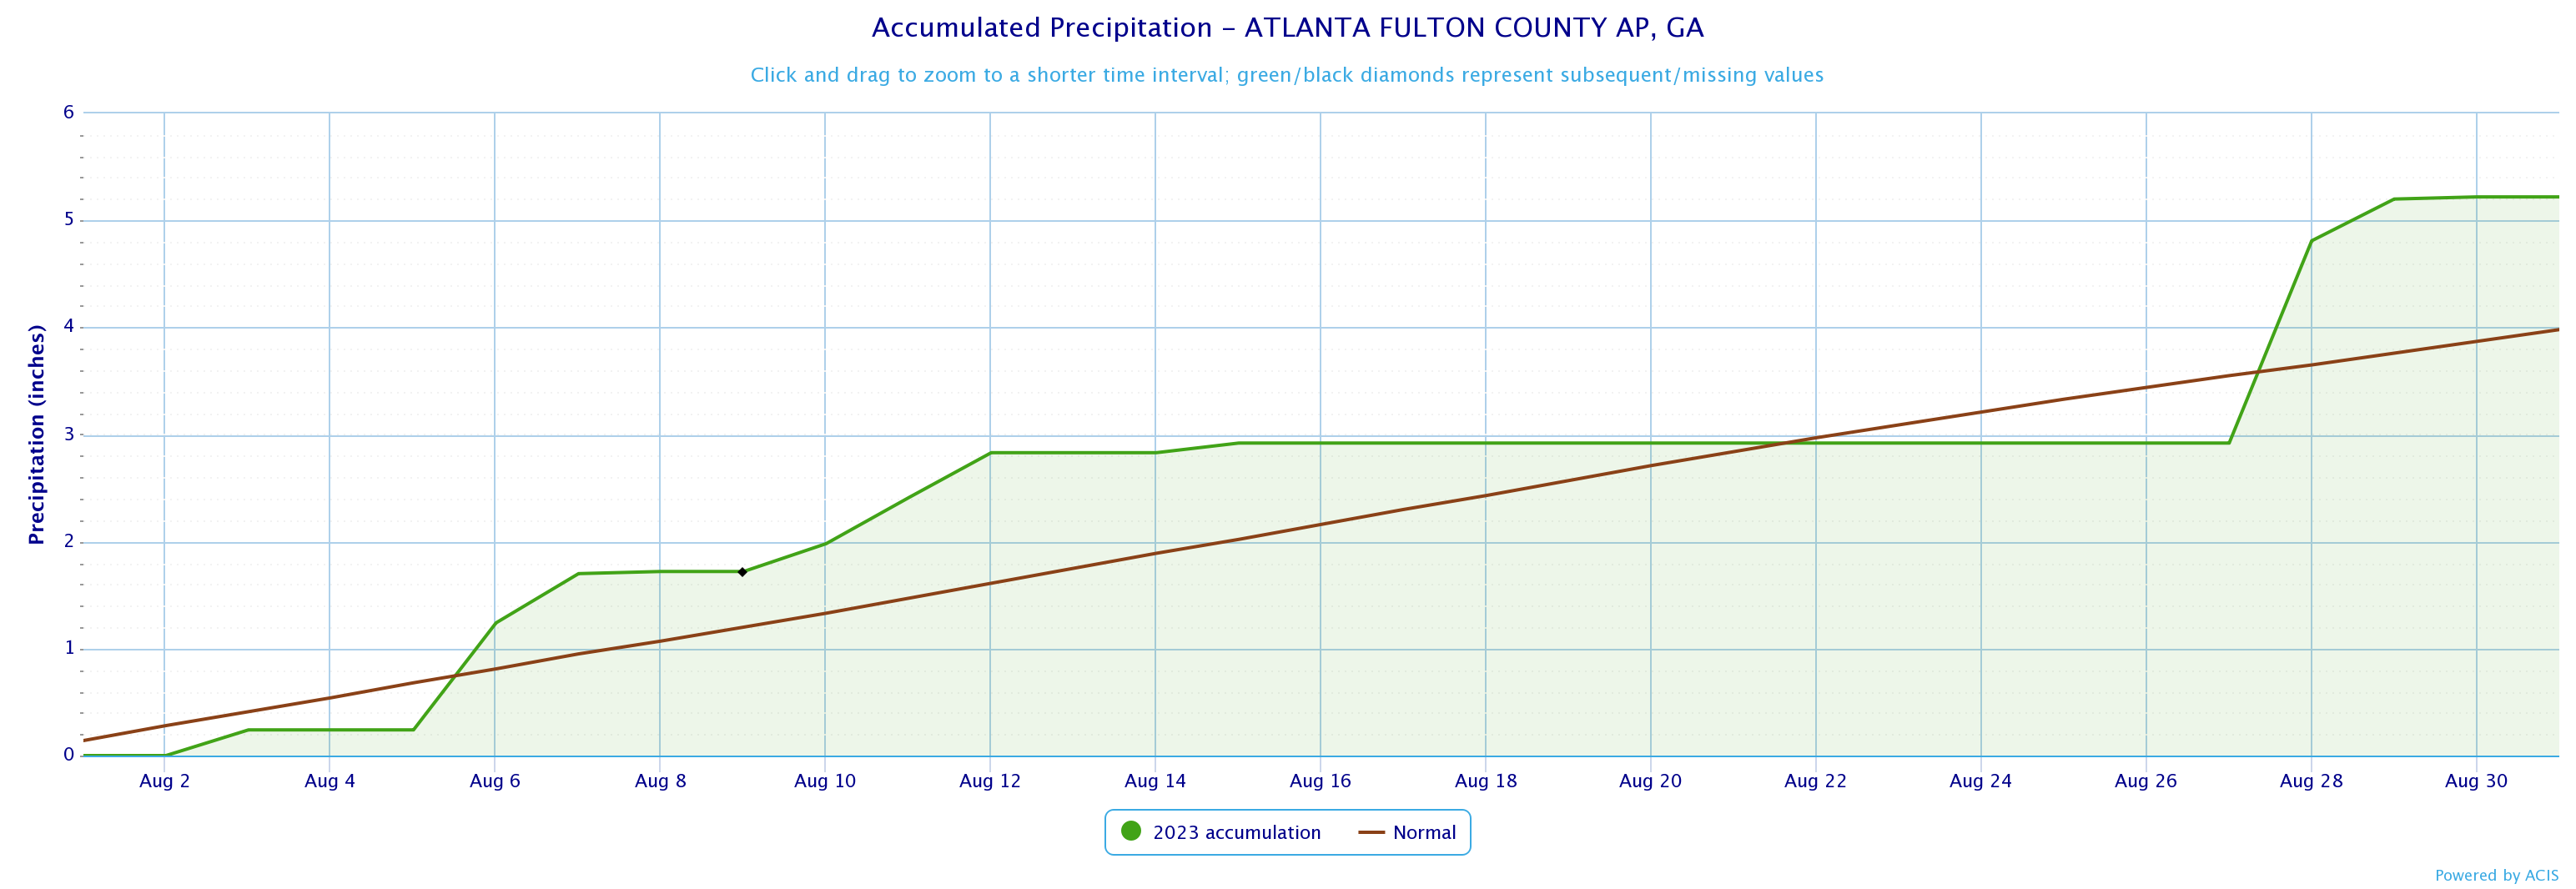
5.22
3.98
1.24
Gainesville
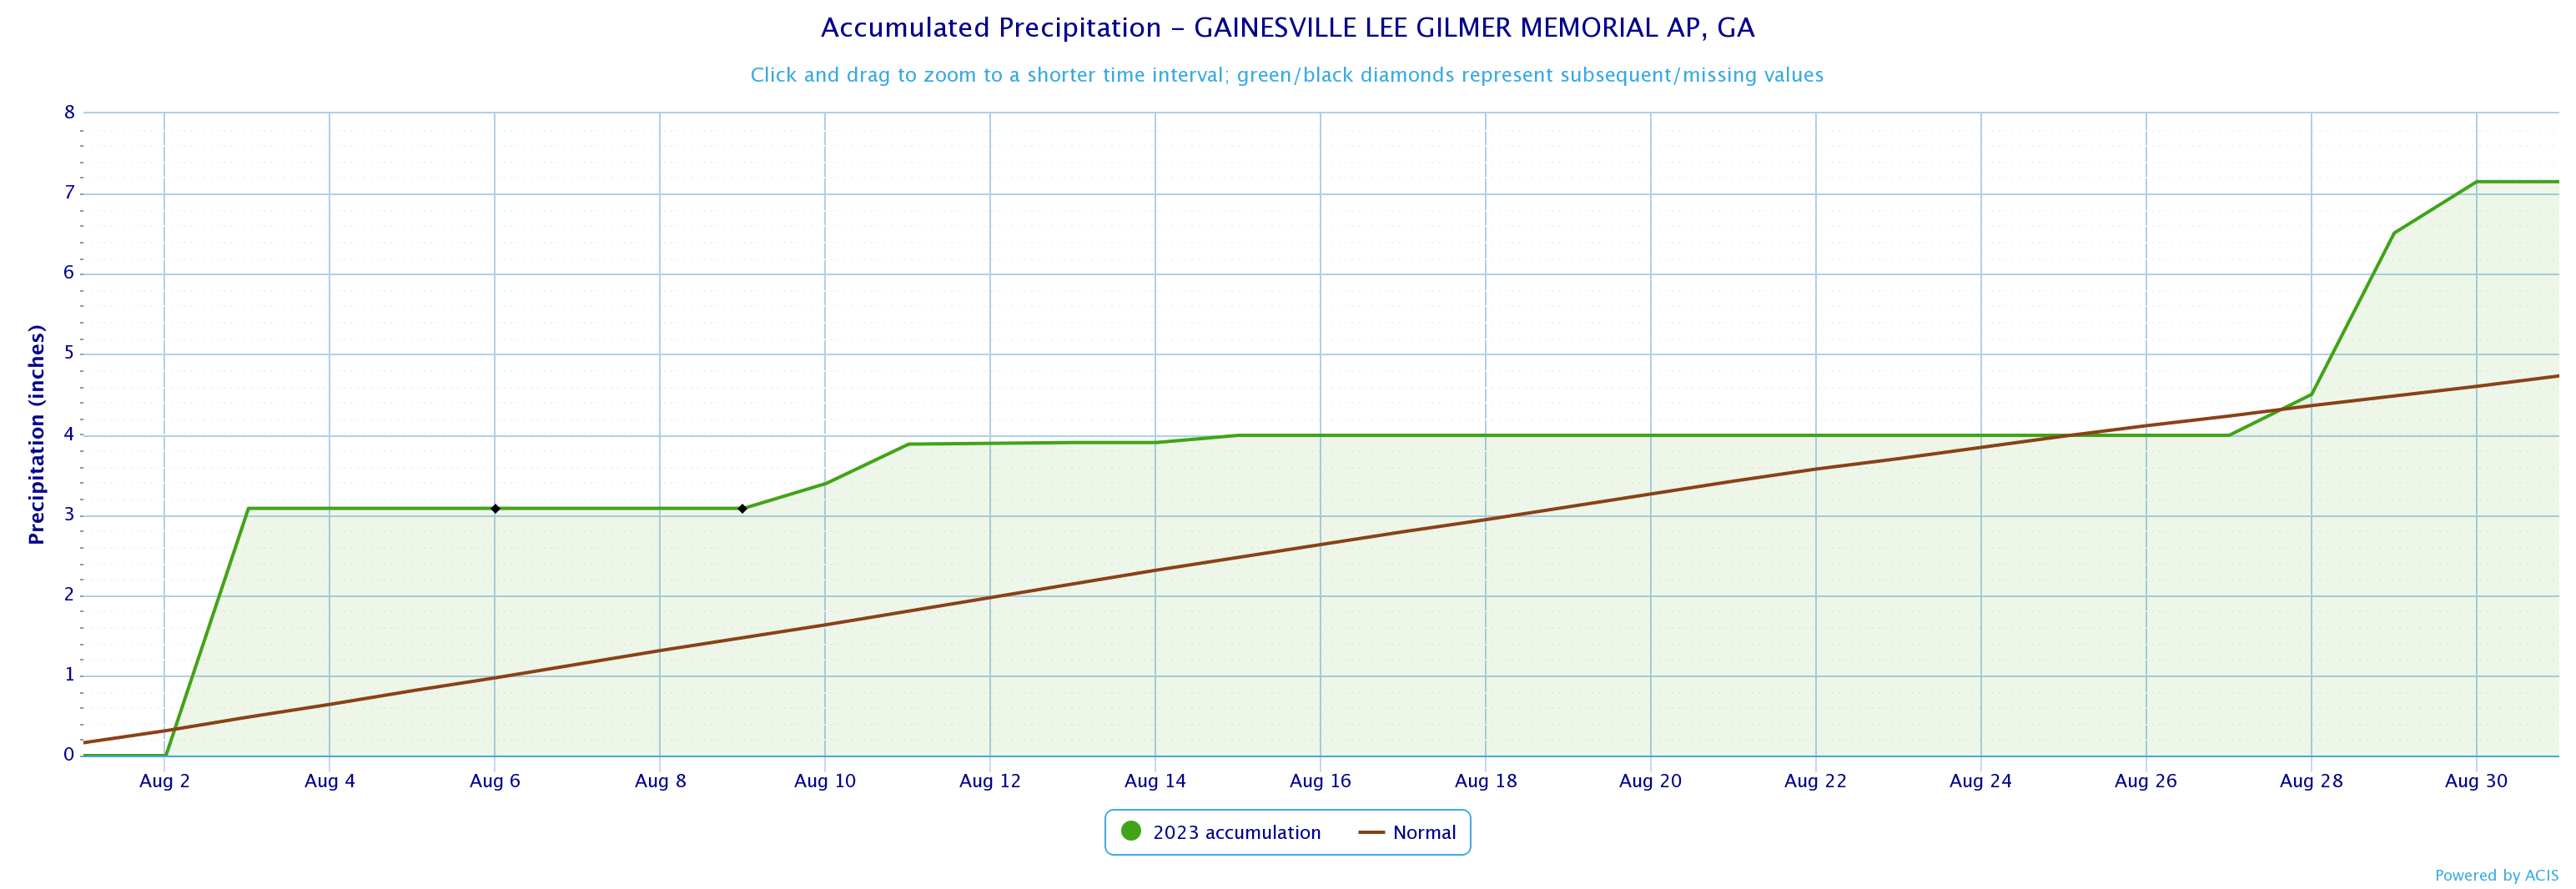
7.15
4.73
2.42
Peachtree City
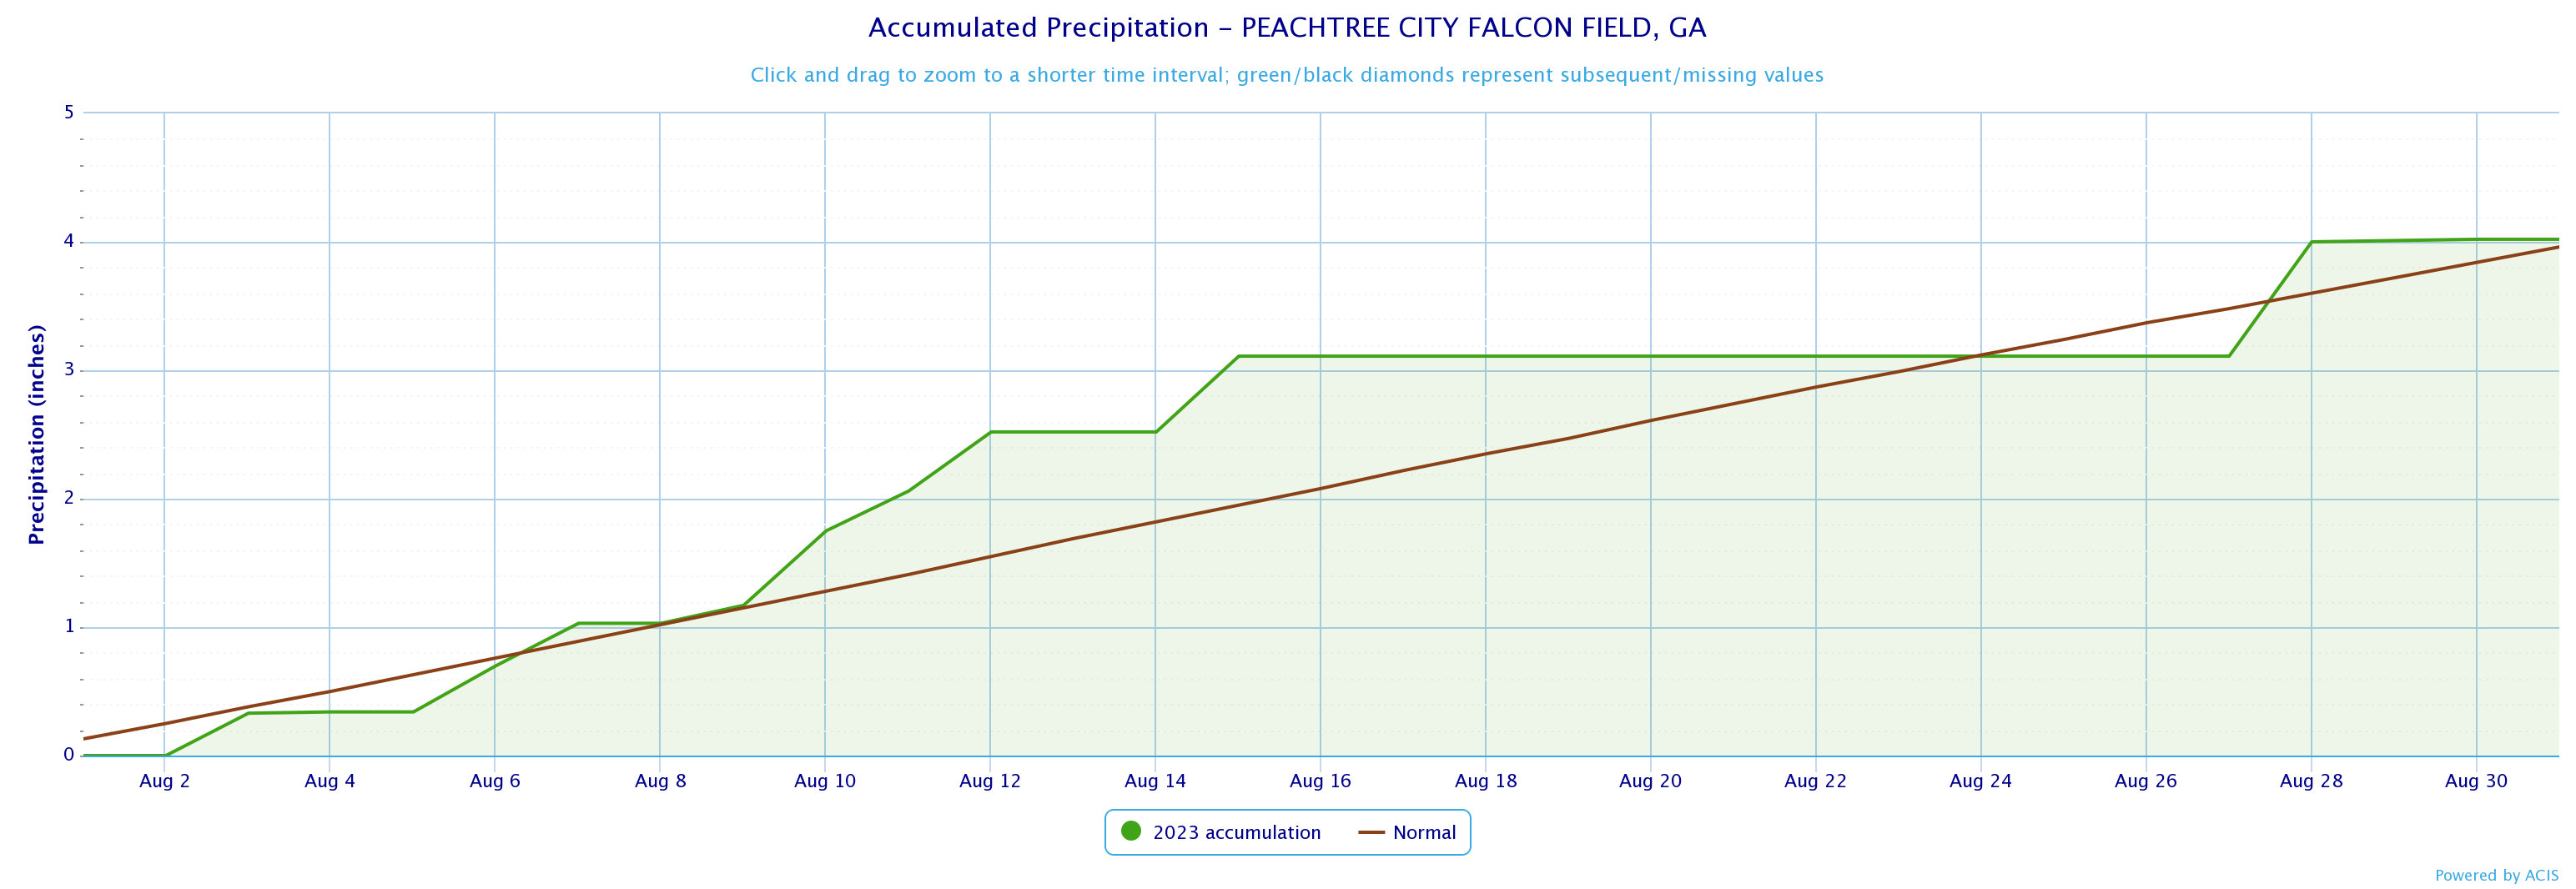
4.02
3.96
0.06
Rome
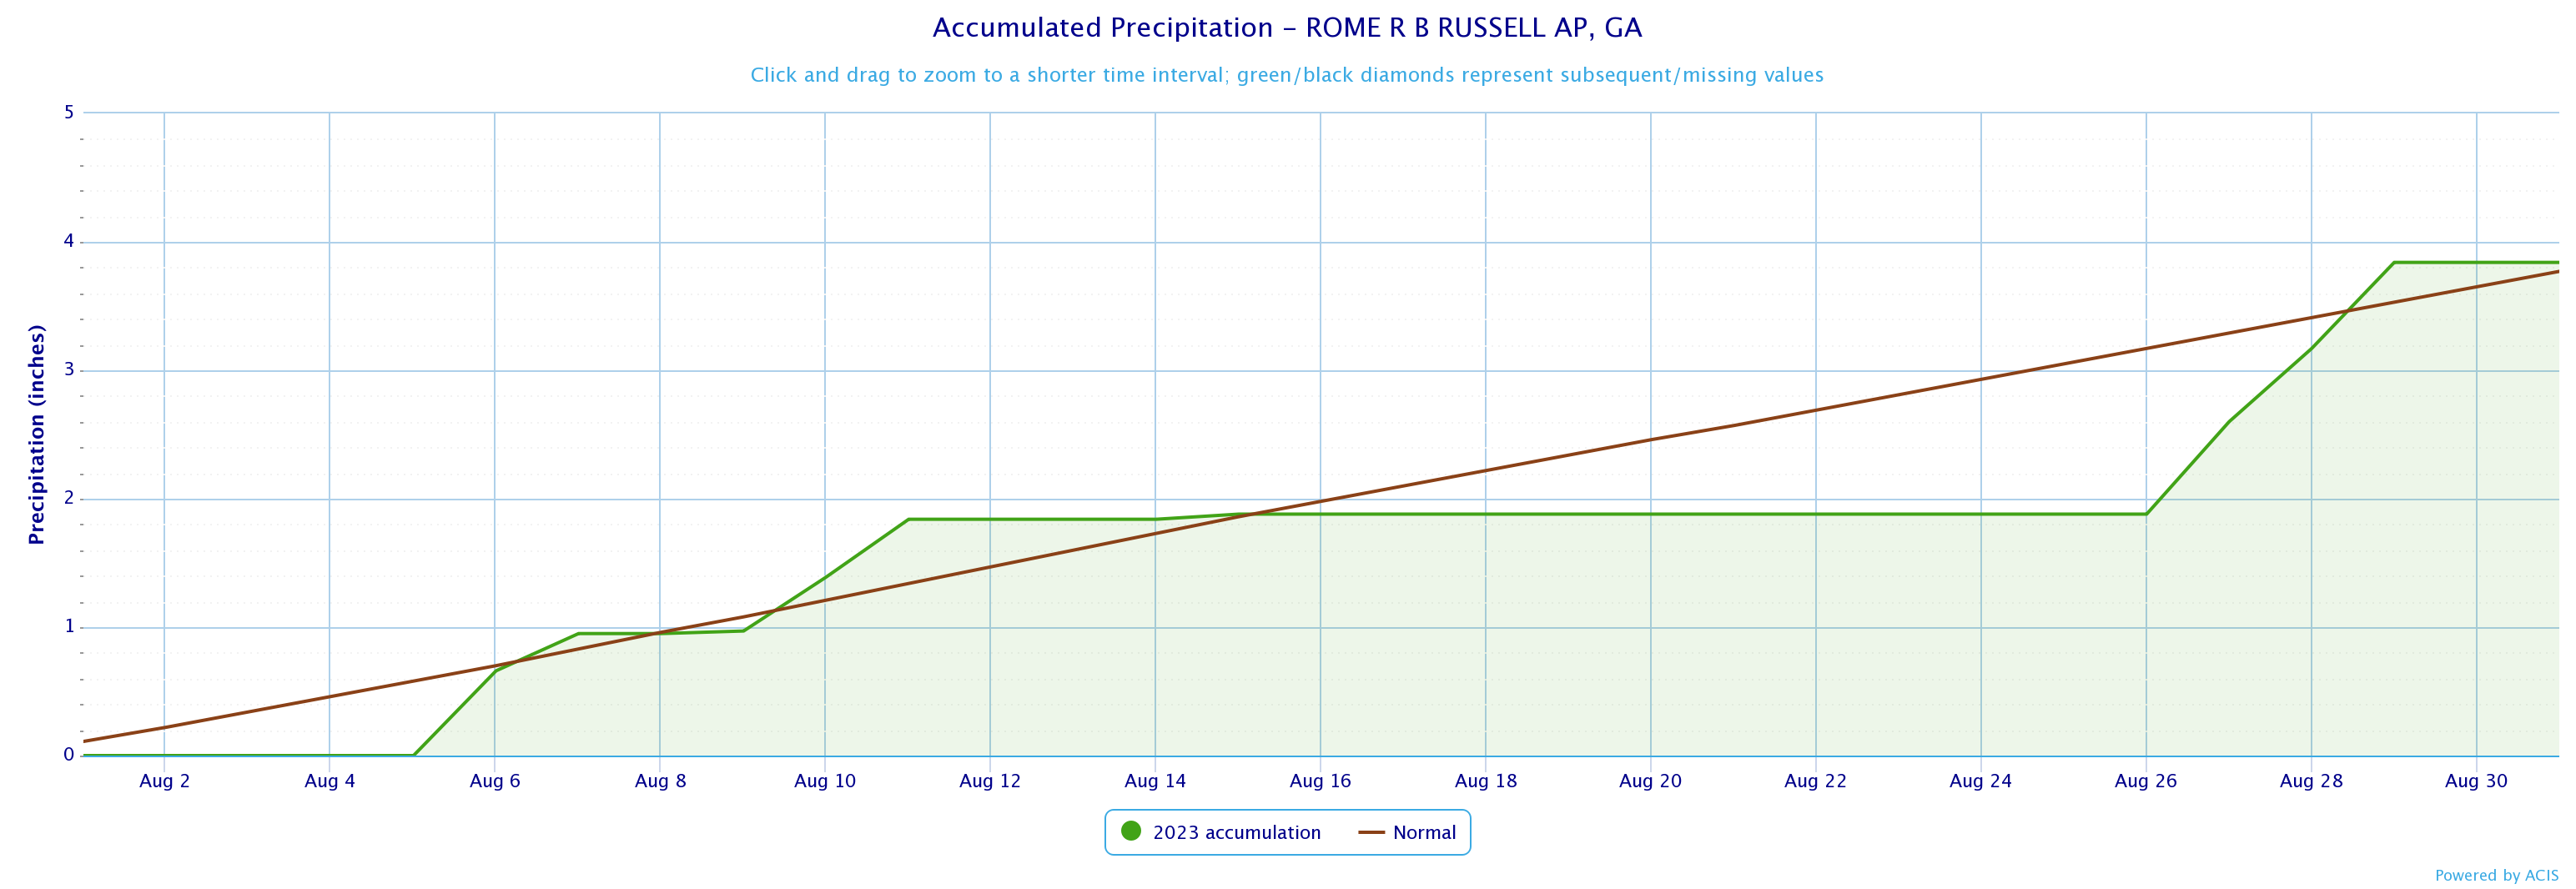
3.84
3.77
0.07
August 2023 Precipitation Climate Statistics
Athens
1.75
8/7
Atlanta
1.17
8/6
Columbus
1.30
8/29
Macon
1.77
8/29
Dekalb Peachtree Arpt
3.67
8/28
Fulton Co Arpt
1.89
8/26
Gainesville
3.08
8/3
Peachtree City
0.89
8/28
Rome
1.24
8/28
Click the links below to explore the temperature and precipitation data across north and central Georgia for the month of August 2023.
Temperature Maps
Precipitation Maps
Temperature Graphs
Precipitation Graphs
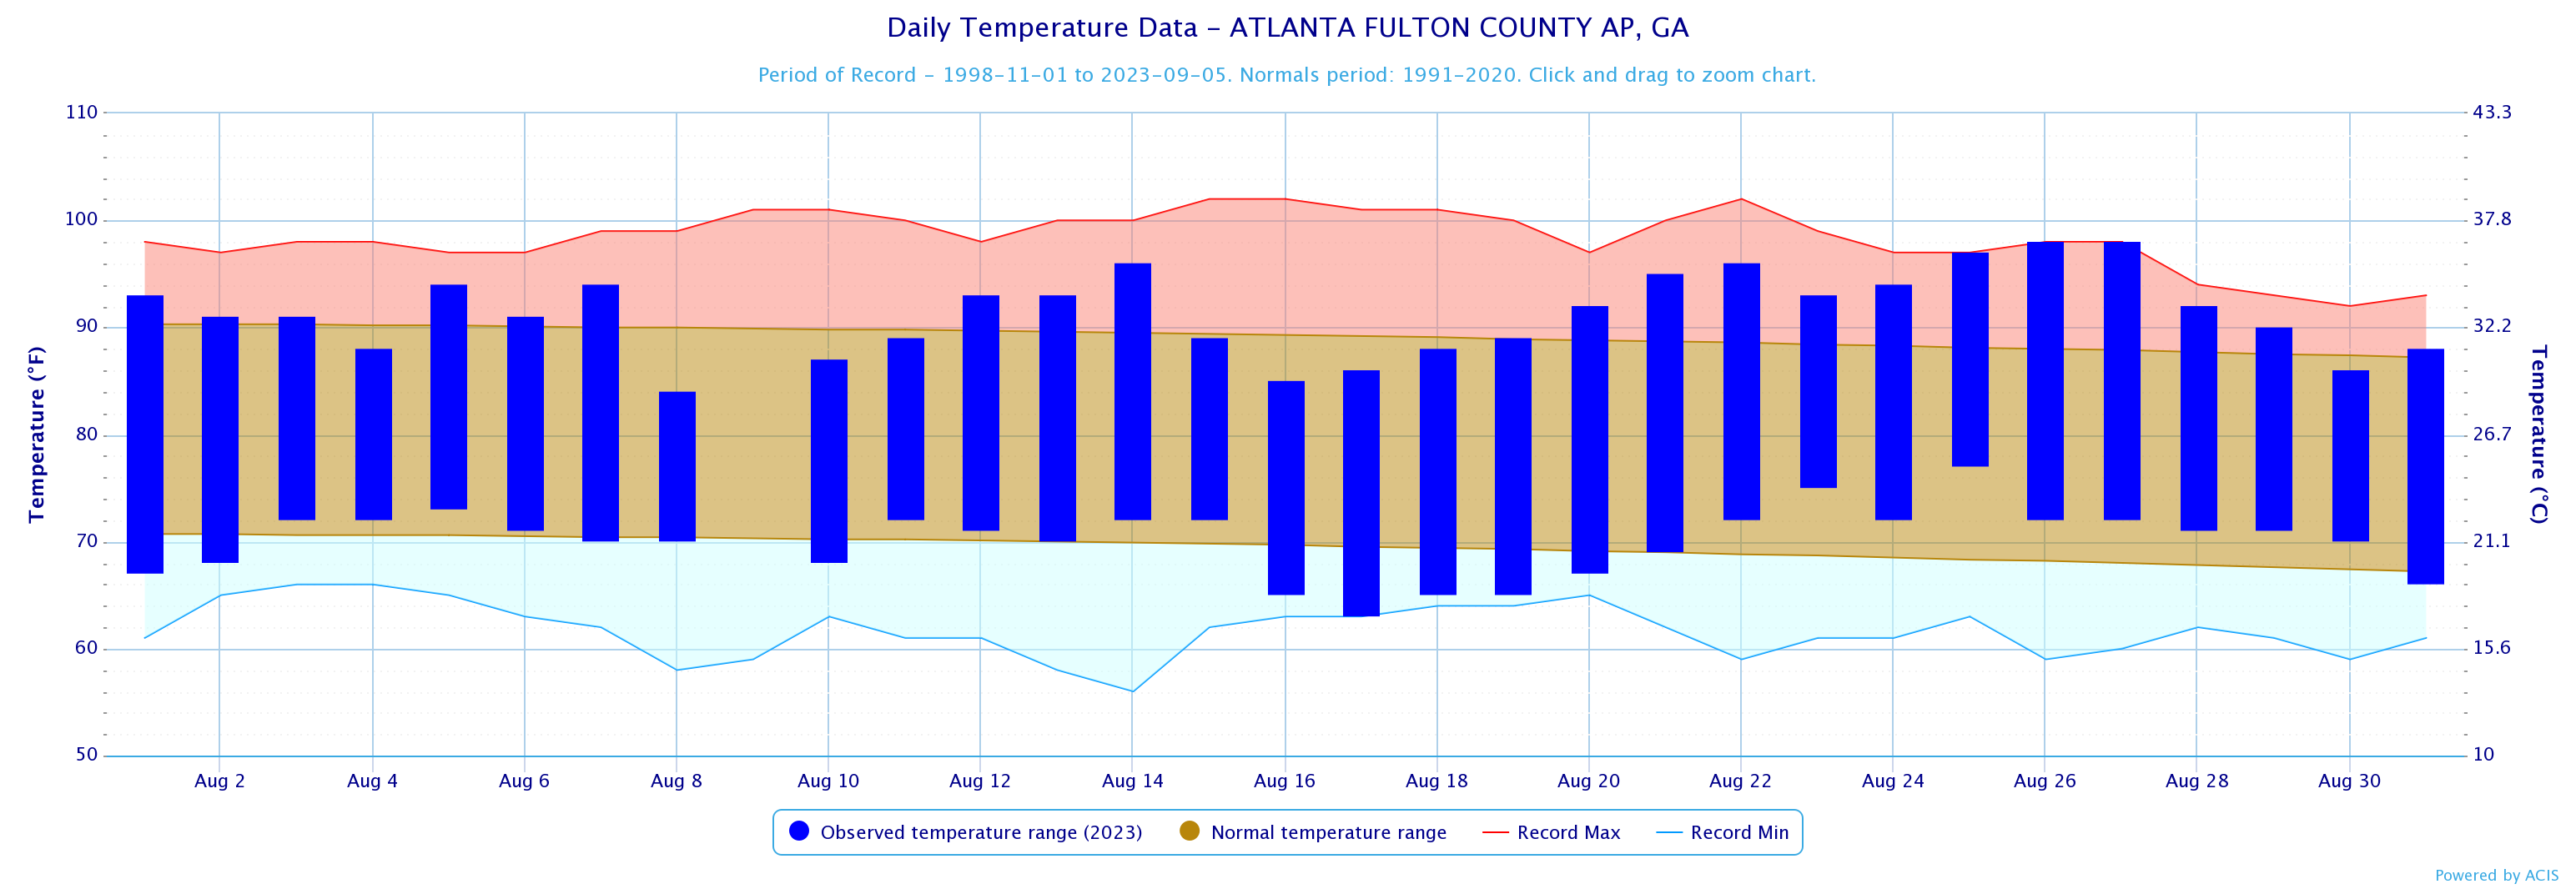
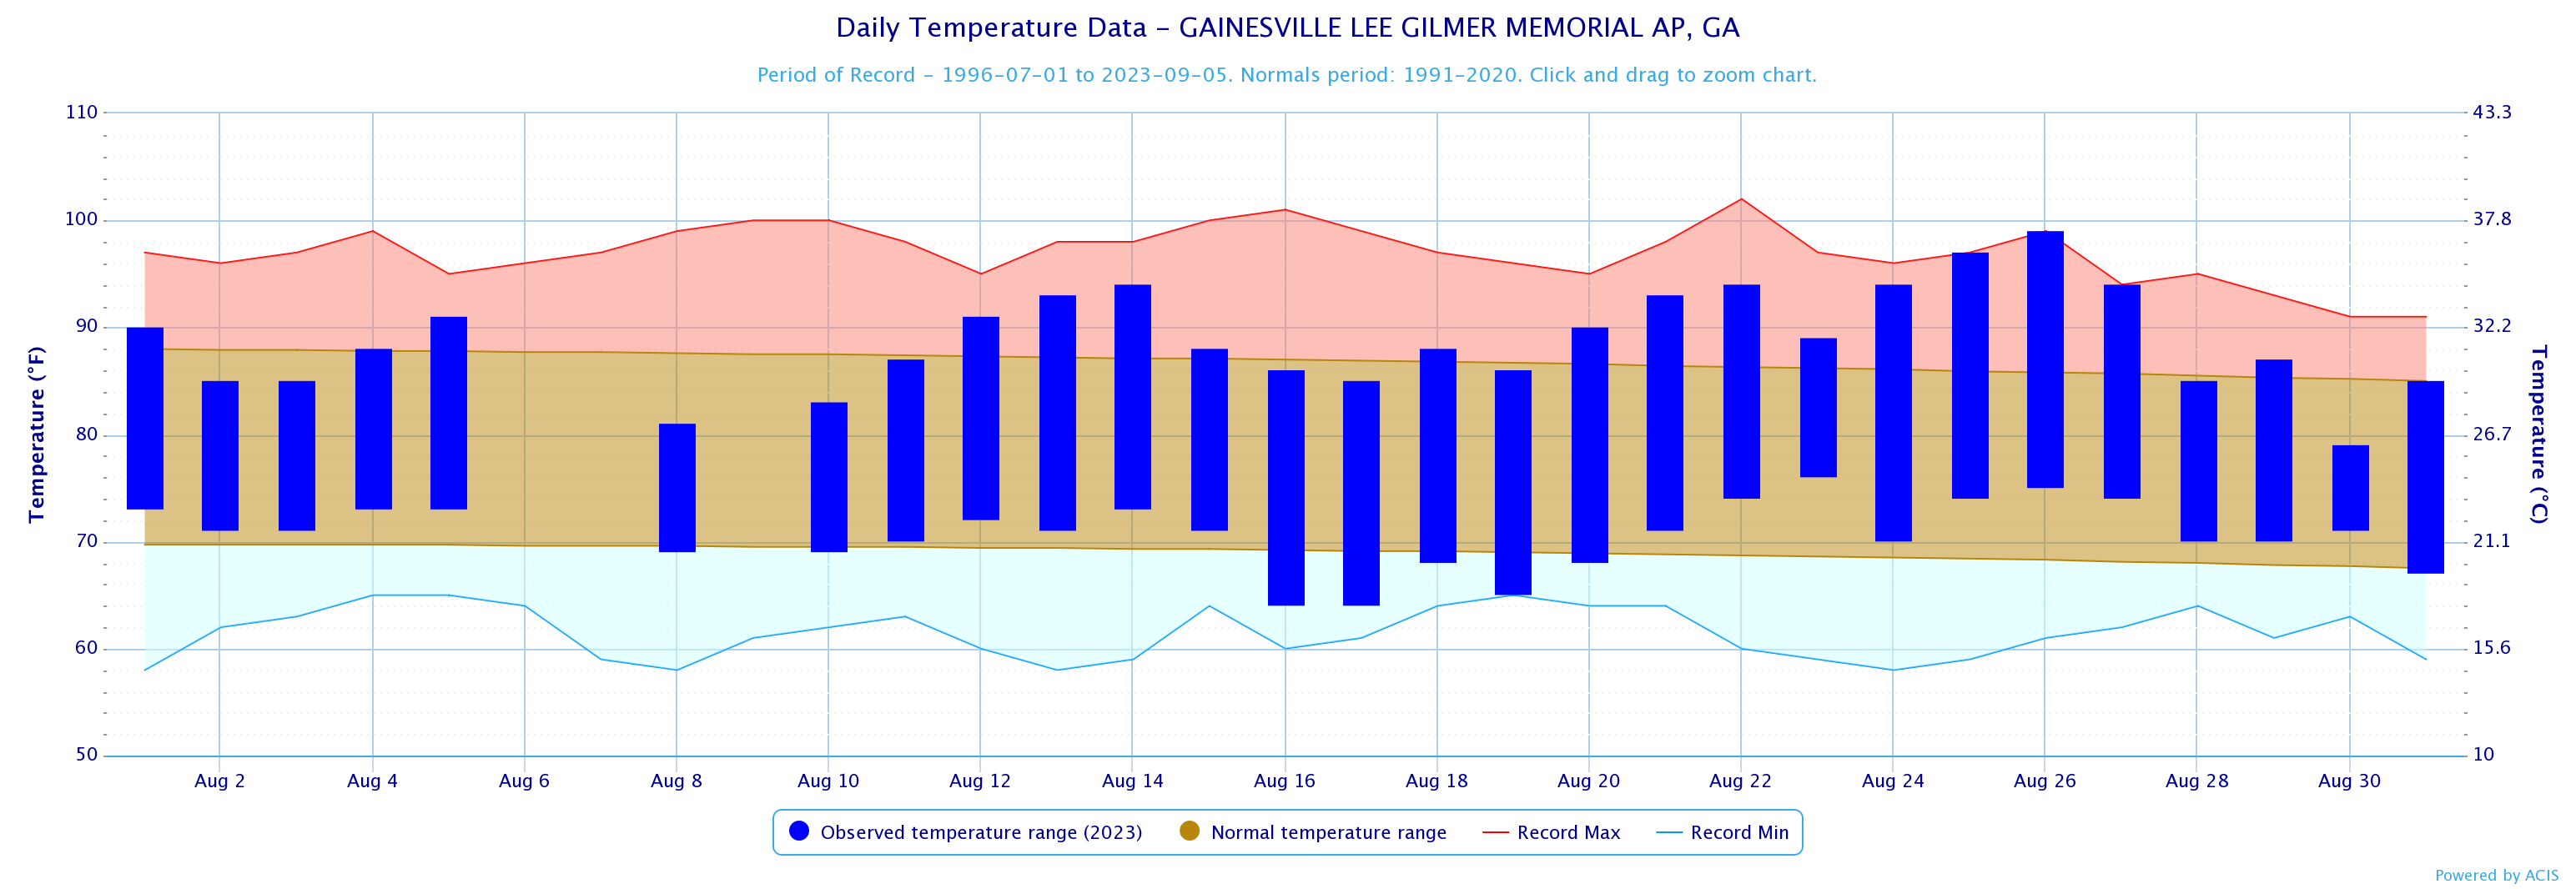
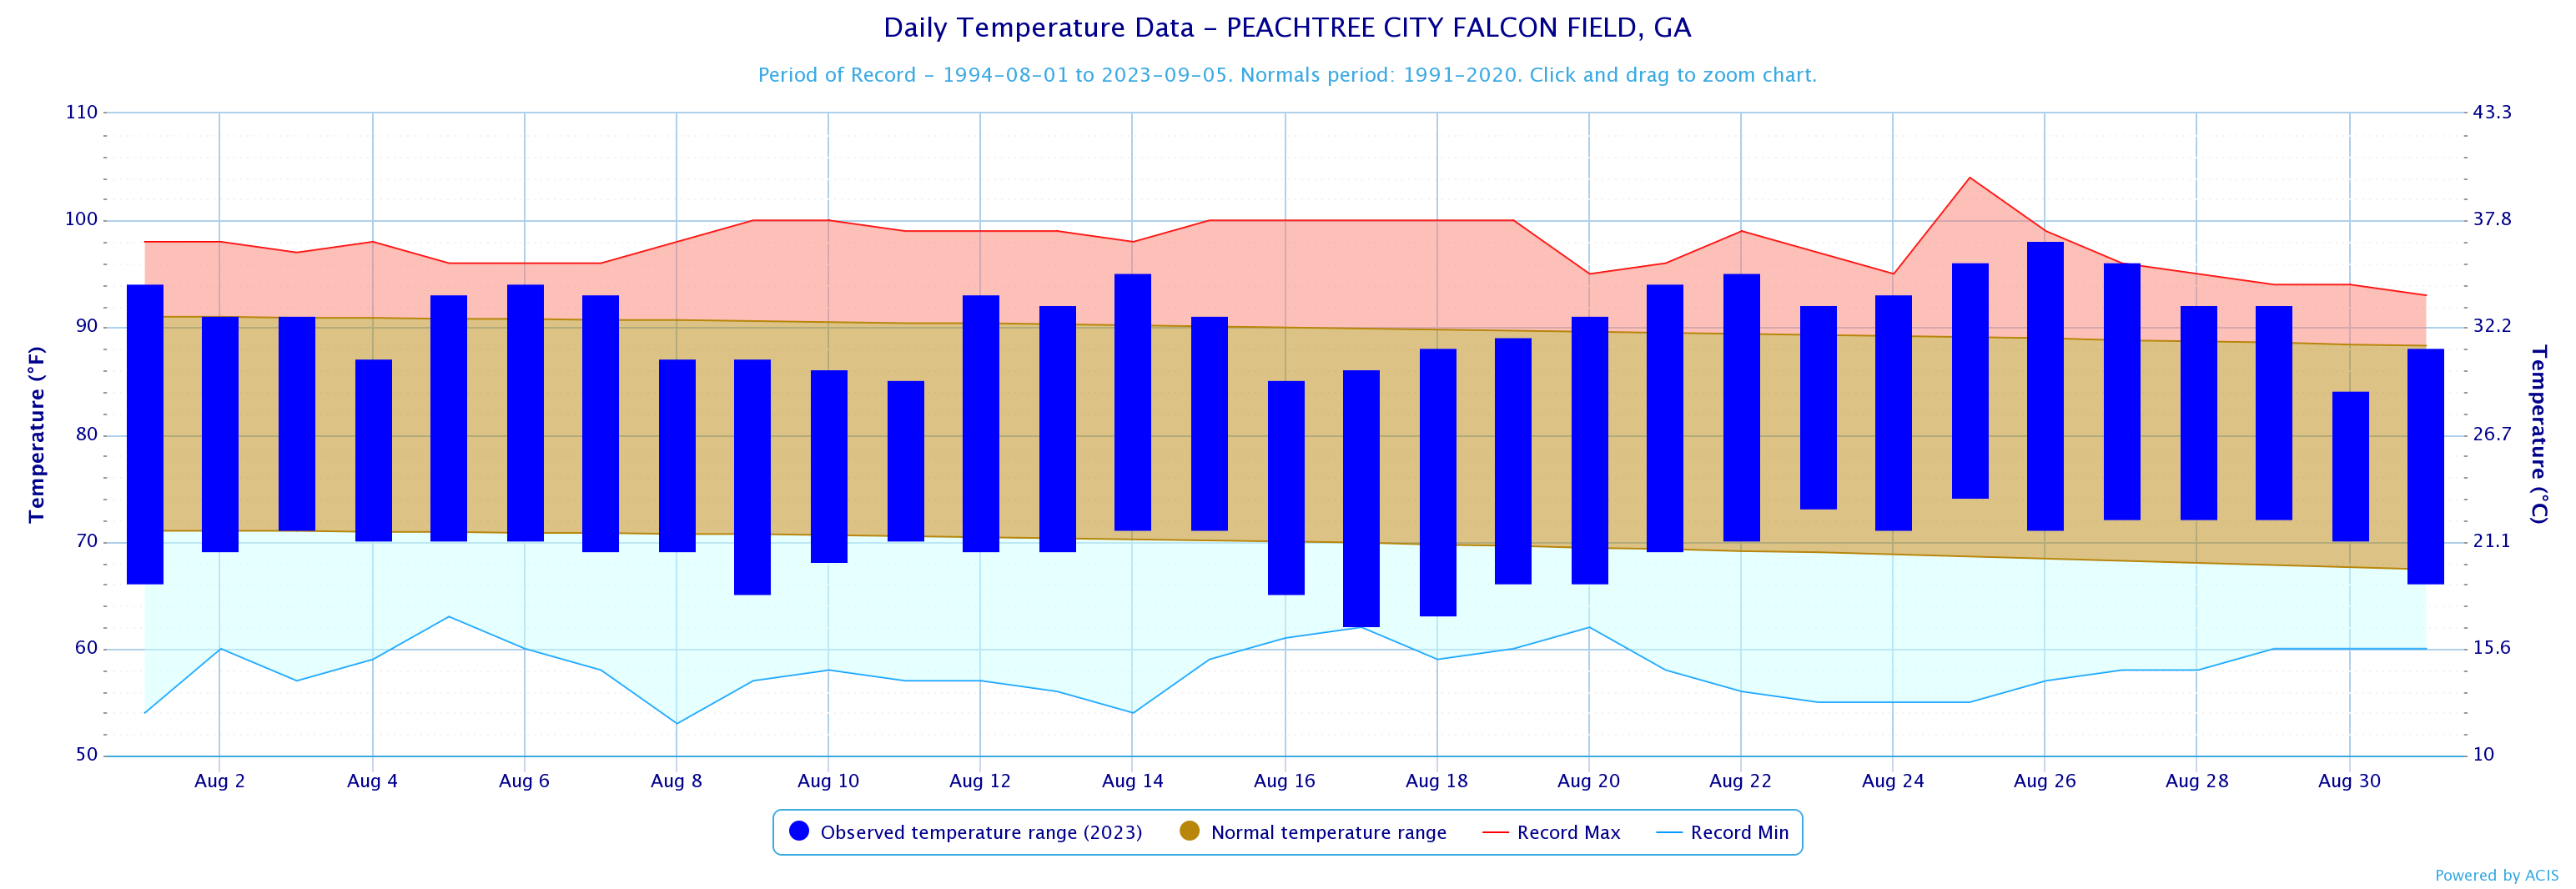
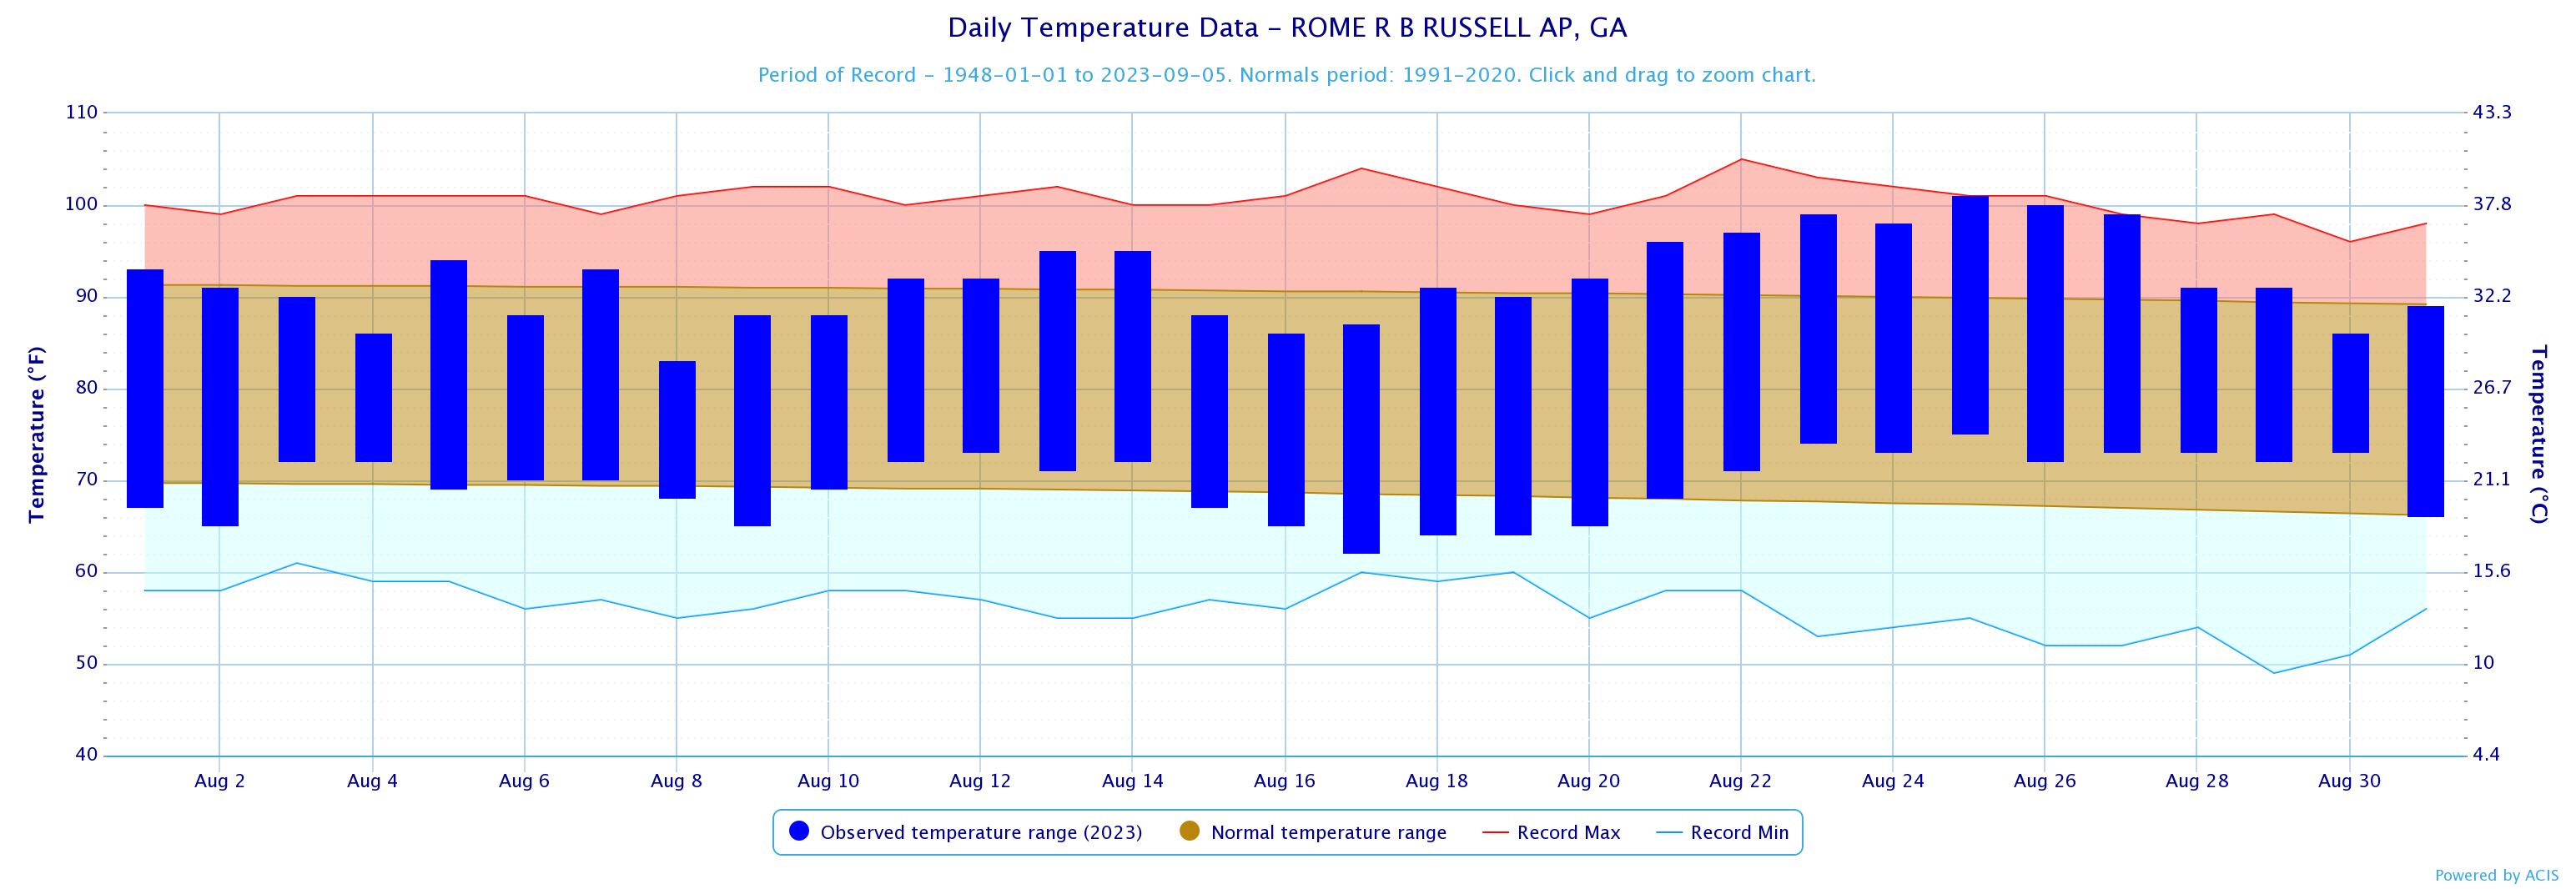
Temperature and precipitation records at our 4 main climate sites are located below.
August 2023 Climate Records
Date
Type
Location
Records set over a 24 hour period
8/26
High T
Macon
A daily record high Temperature of 104° breaks the old record of 101 set in 1998.
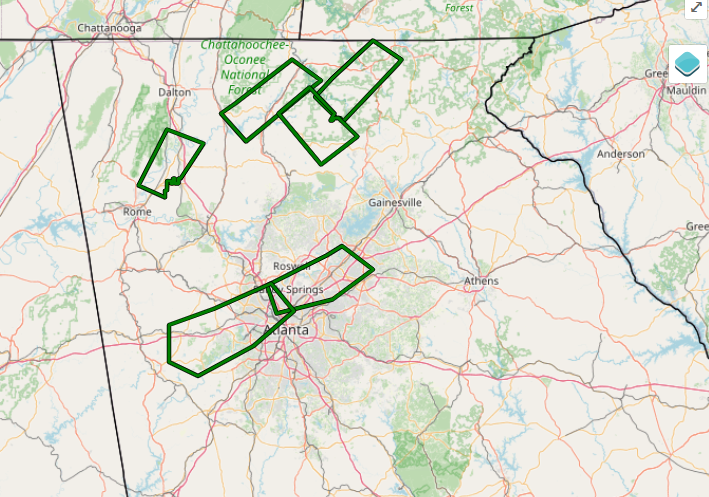
Larger events that occurred across north and central Georgia this past August can be found here.
The September climate outlook is below.
September Outlook