| Previous Month | Next Month |
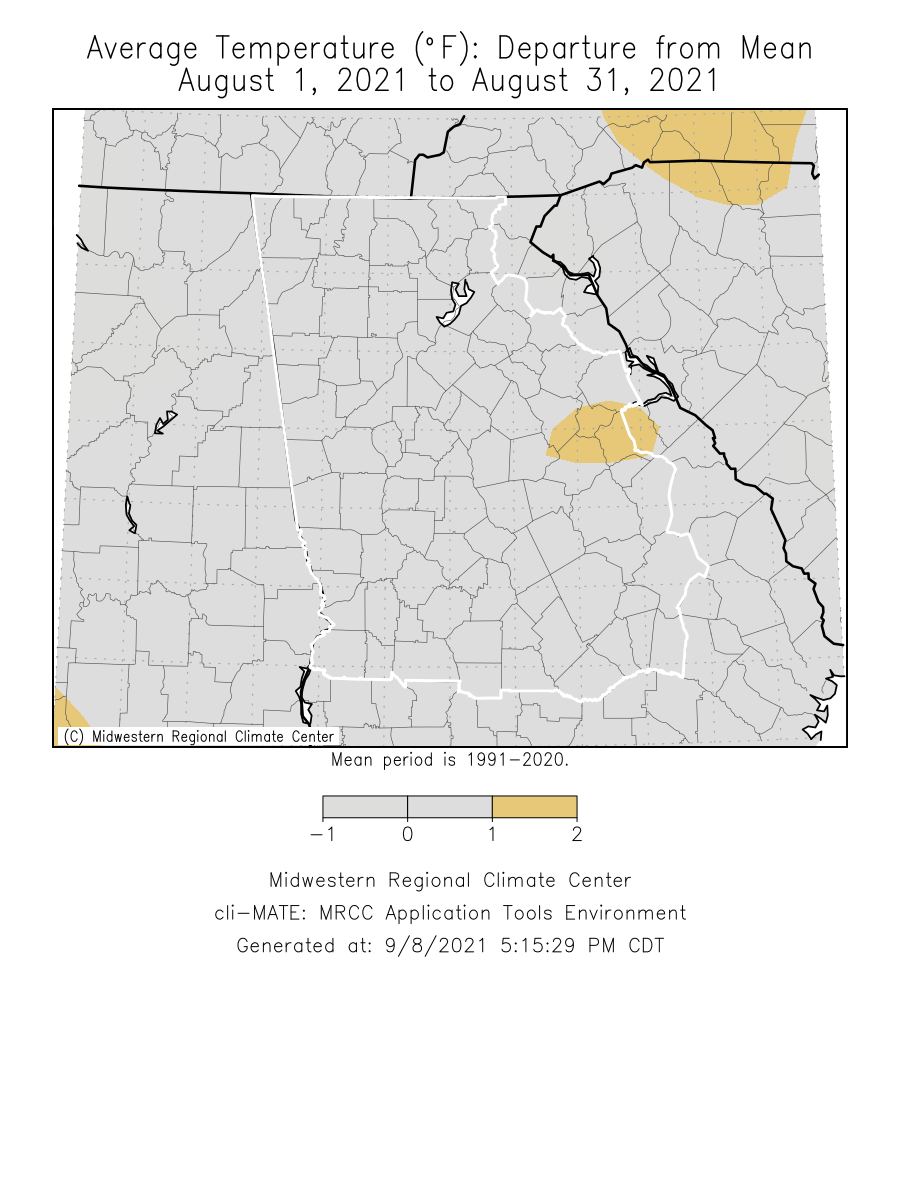
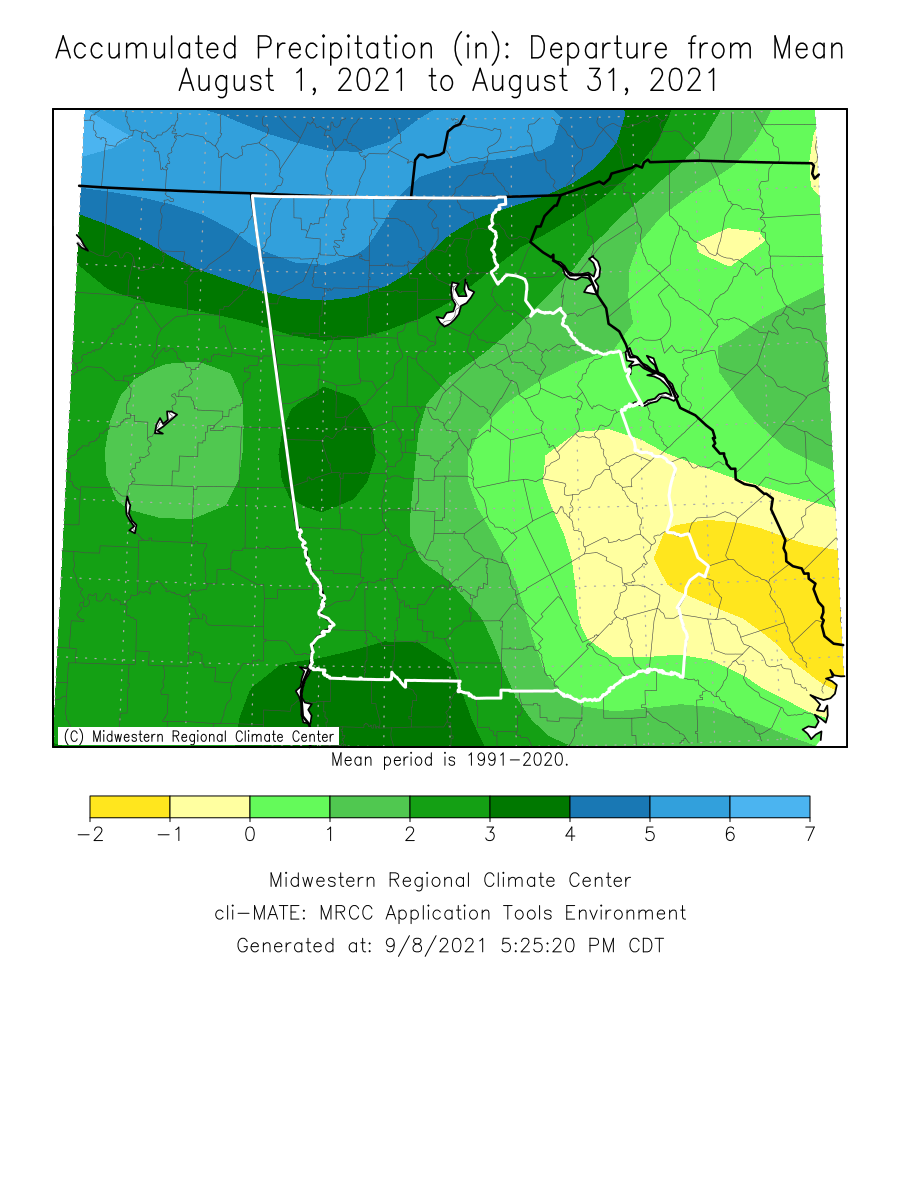
Temperatures through the month of August were around a degree above normal. Precipitation through the month of August was around 0 to 5 inches above normal.
|
August 2021 Climate Averages
|
|||
|
Climate Site
|
August Temp (°F)(°F)
|
Average Temp
|
Departure from normal
|
|
81.5
|
79.8
|
+1.7
|
|
|
80.4
|
80.2
|
+0.2
|
|
|
81.4
|
82.4
|
-1.0
|
|
|
81.5
|
81.4
|
+0.1
|
|
|
79.3
|
78.1
|
+1.2
|
|
|
79.3
|
78.6
|
+0.7
|
|
|
79.5
|
79.3
|
+0.2
|
|
|
79.3
|
77.9
|
+1.4
|
|
|
80.3
|
79.8
|
+0.5
|
|
|
80.7
|
79.5
|
+1.2
|
|
|
August 2021 Temperature Climate Statistics
|
||||
|
Climate Site |
Maximum Temperature |
Max T Date |
Minimum Temperature
|
Min T Date
|
|
Athens
|
97
|
8/10, 8/13
|
66
|
8/5
|
|
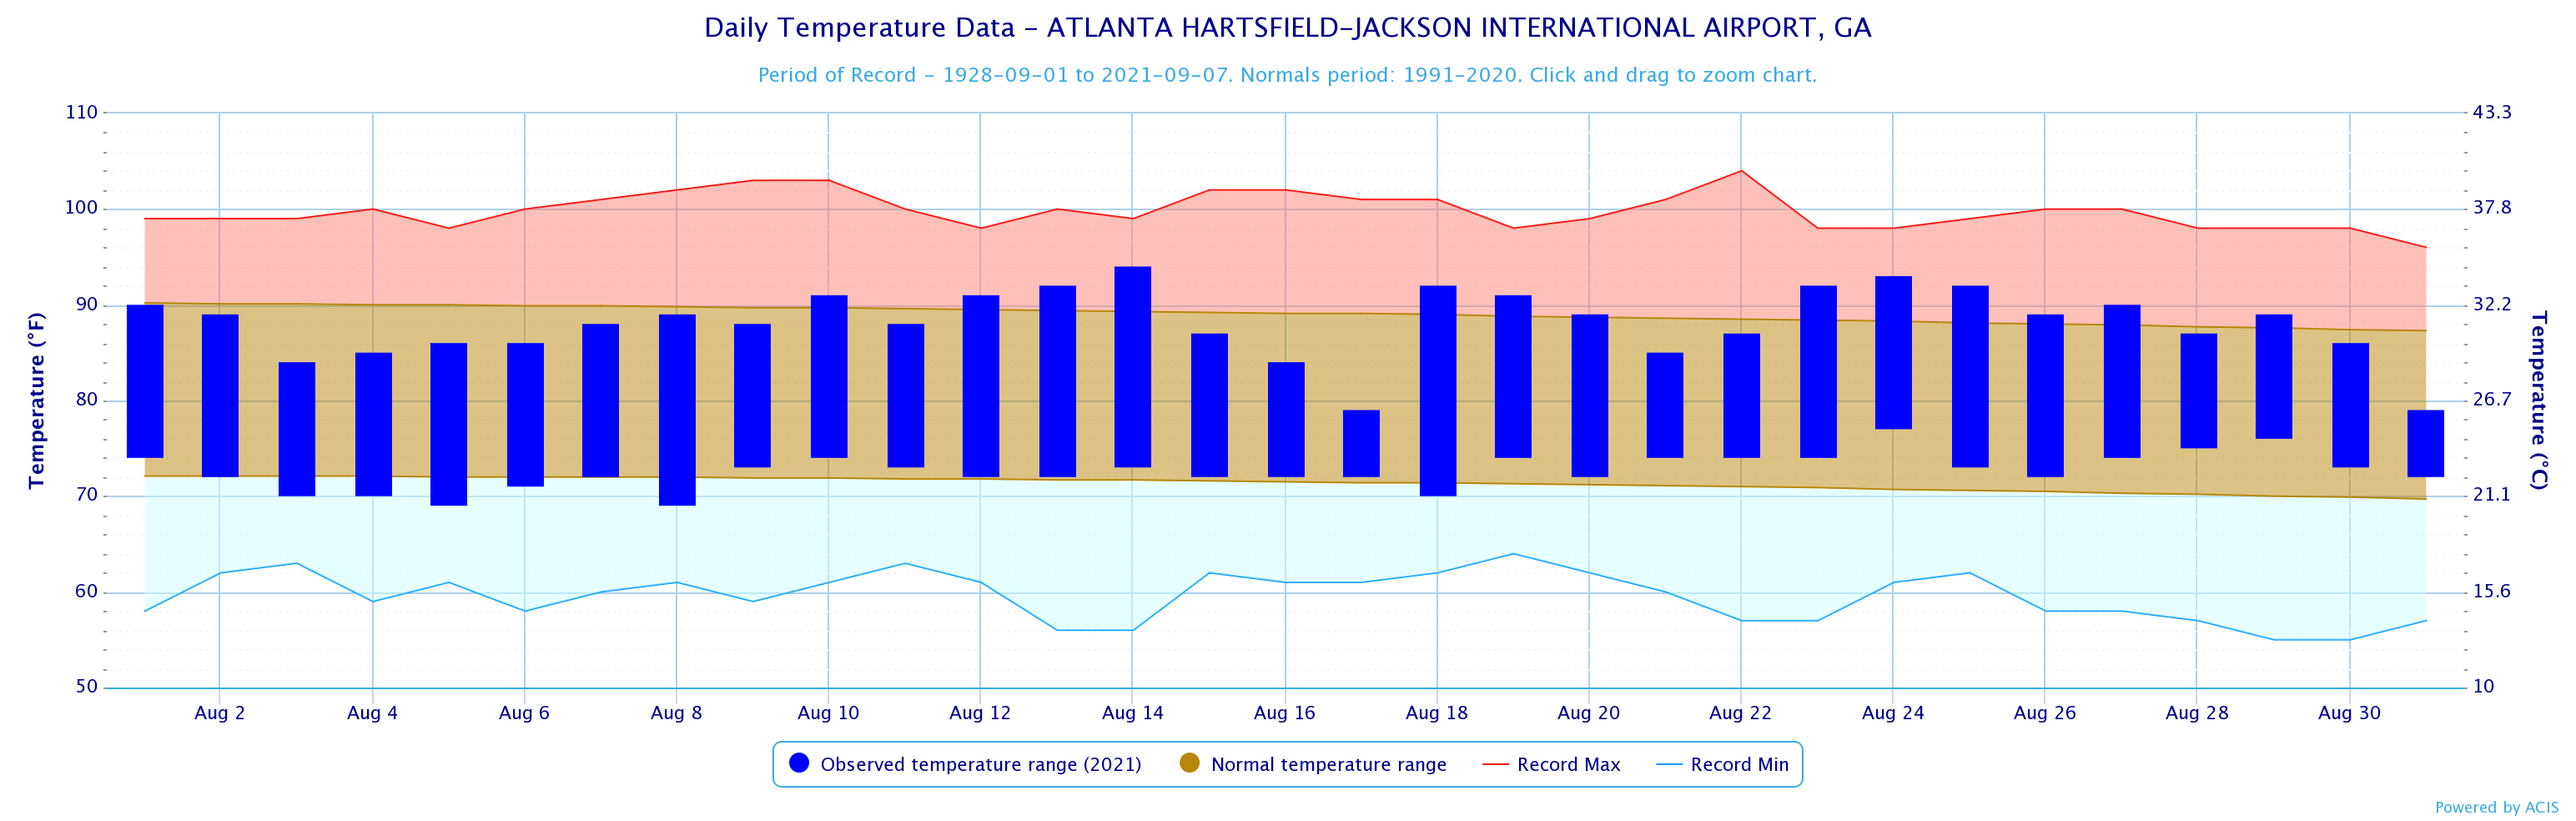
Atlanta
|
94
|
8/14
|
69
|
8/5, 8/8
|
|
Columbus
|
95
|
8/23, 8/24
|
68
|
8/6
|
|
Macon
|
97
|
8/13
|
66
|
8/6
|
|
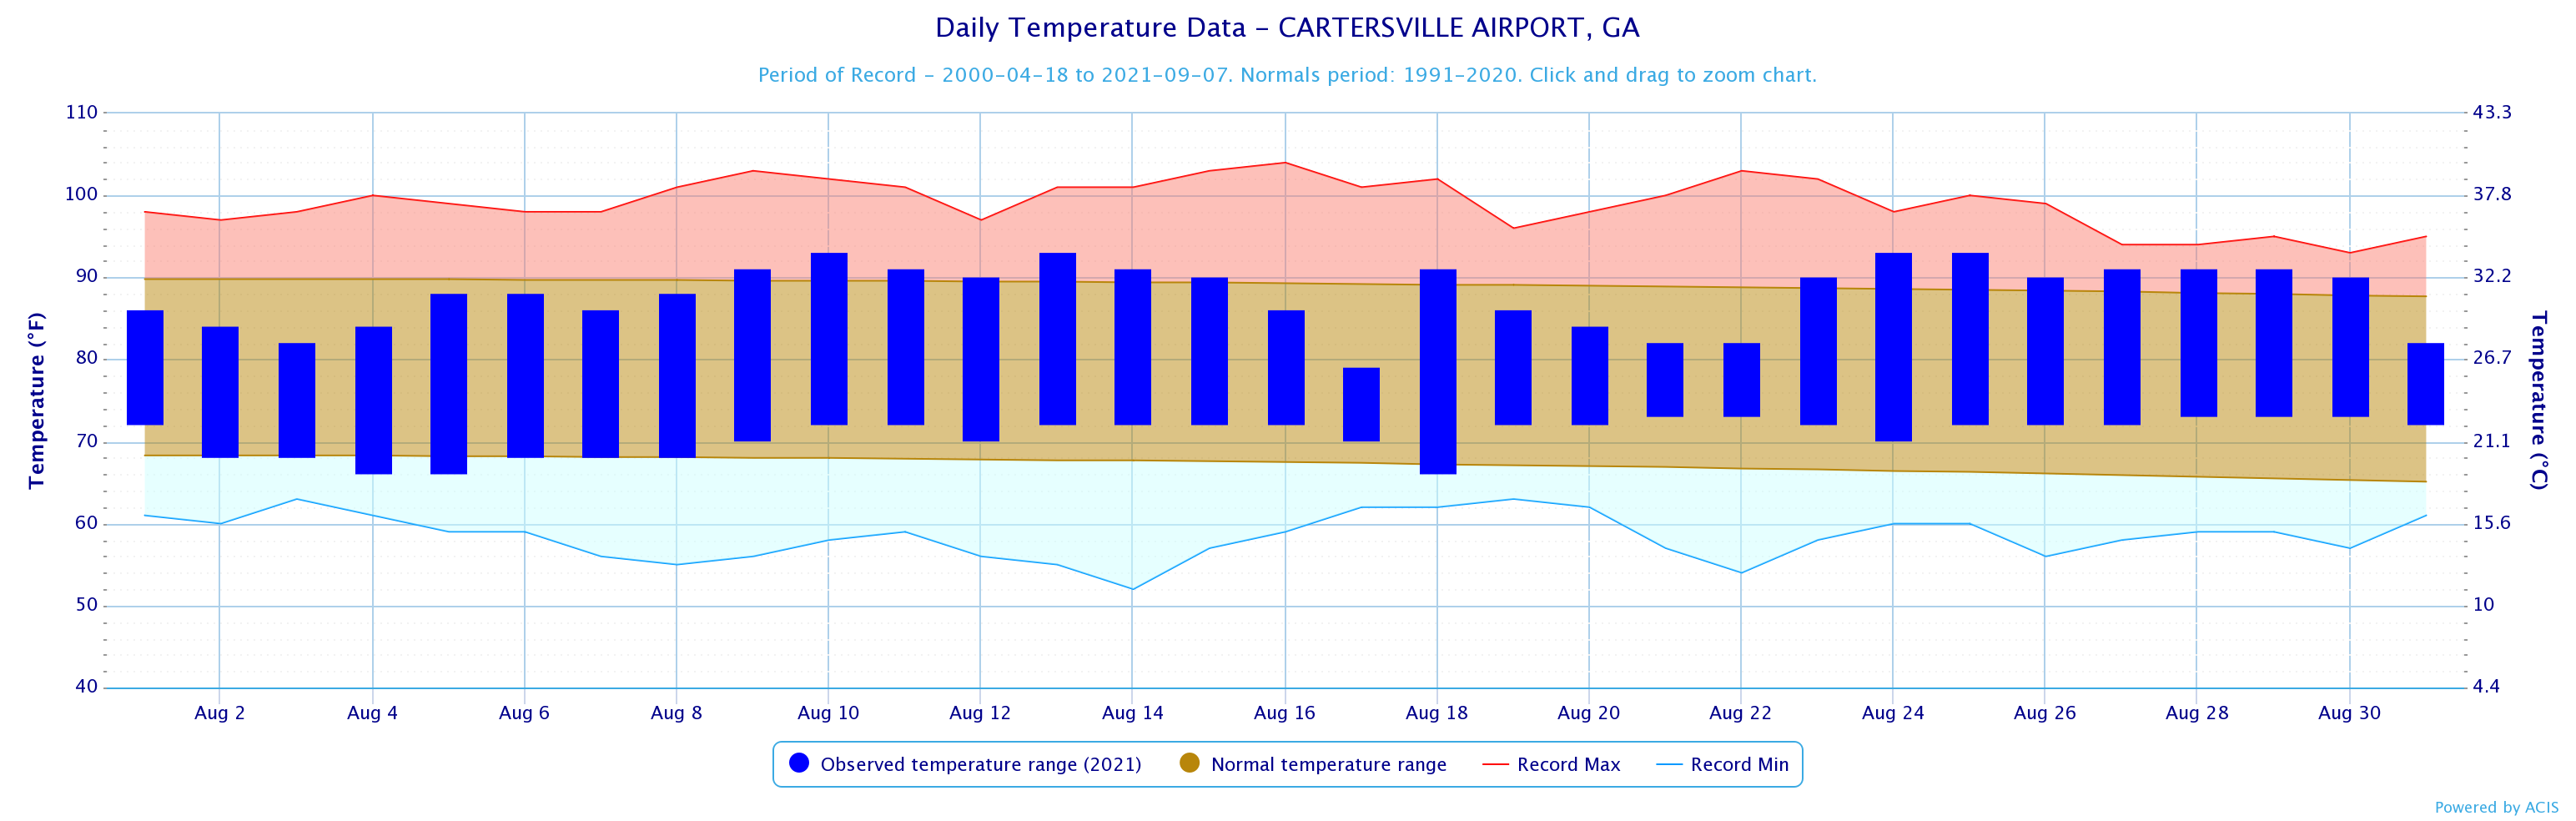
Cartersville
|
93
|
8/17
|
66
|
8/6
|
|
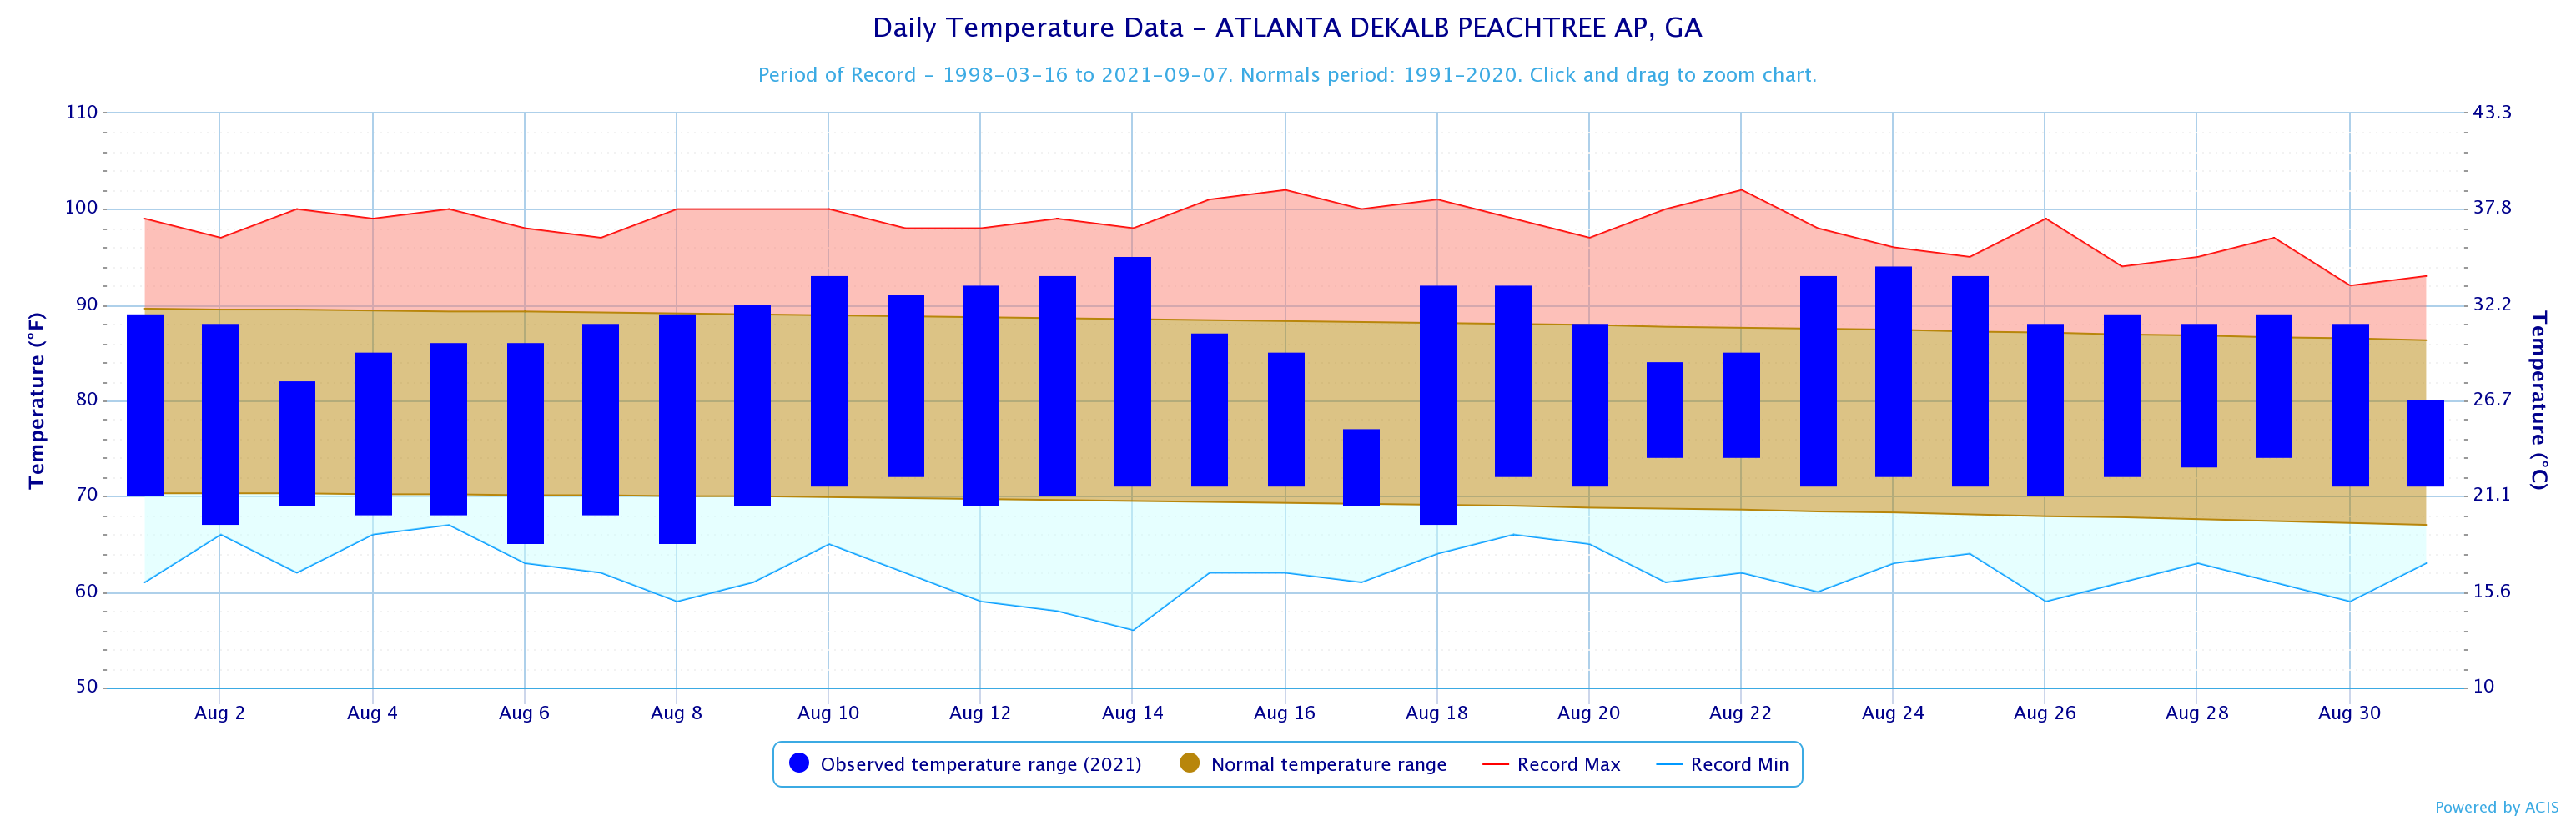
Dekalb Peachtree Arpt
|
95
|
8/14
|
65
|
8/6, 8/8
|
|
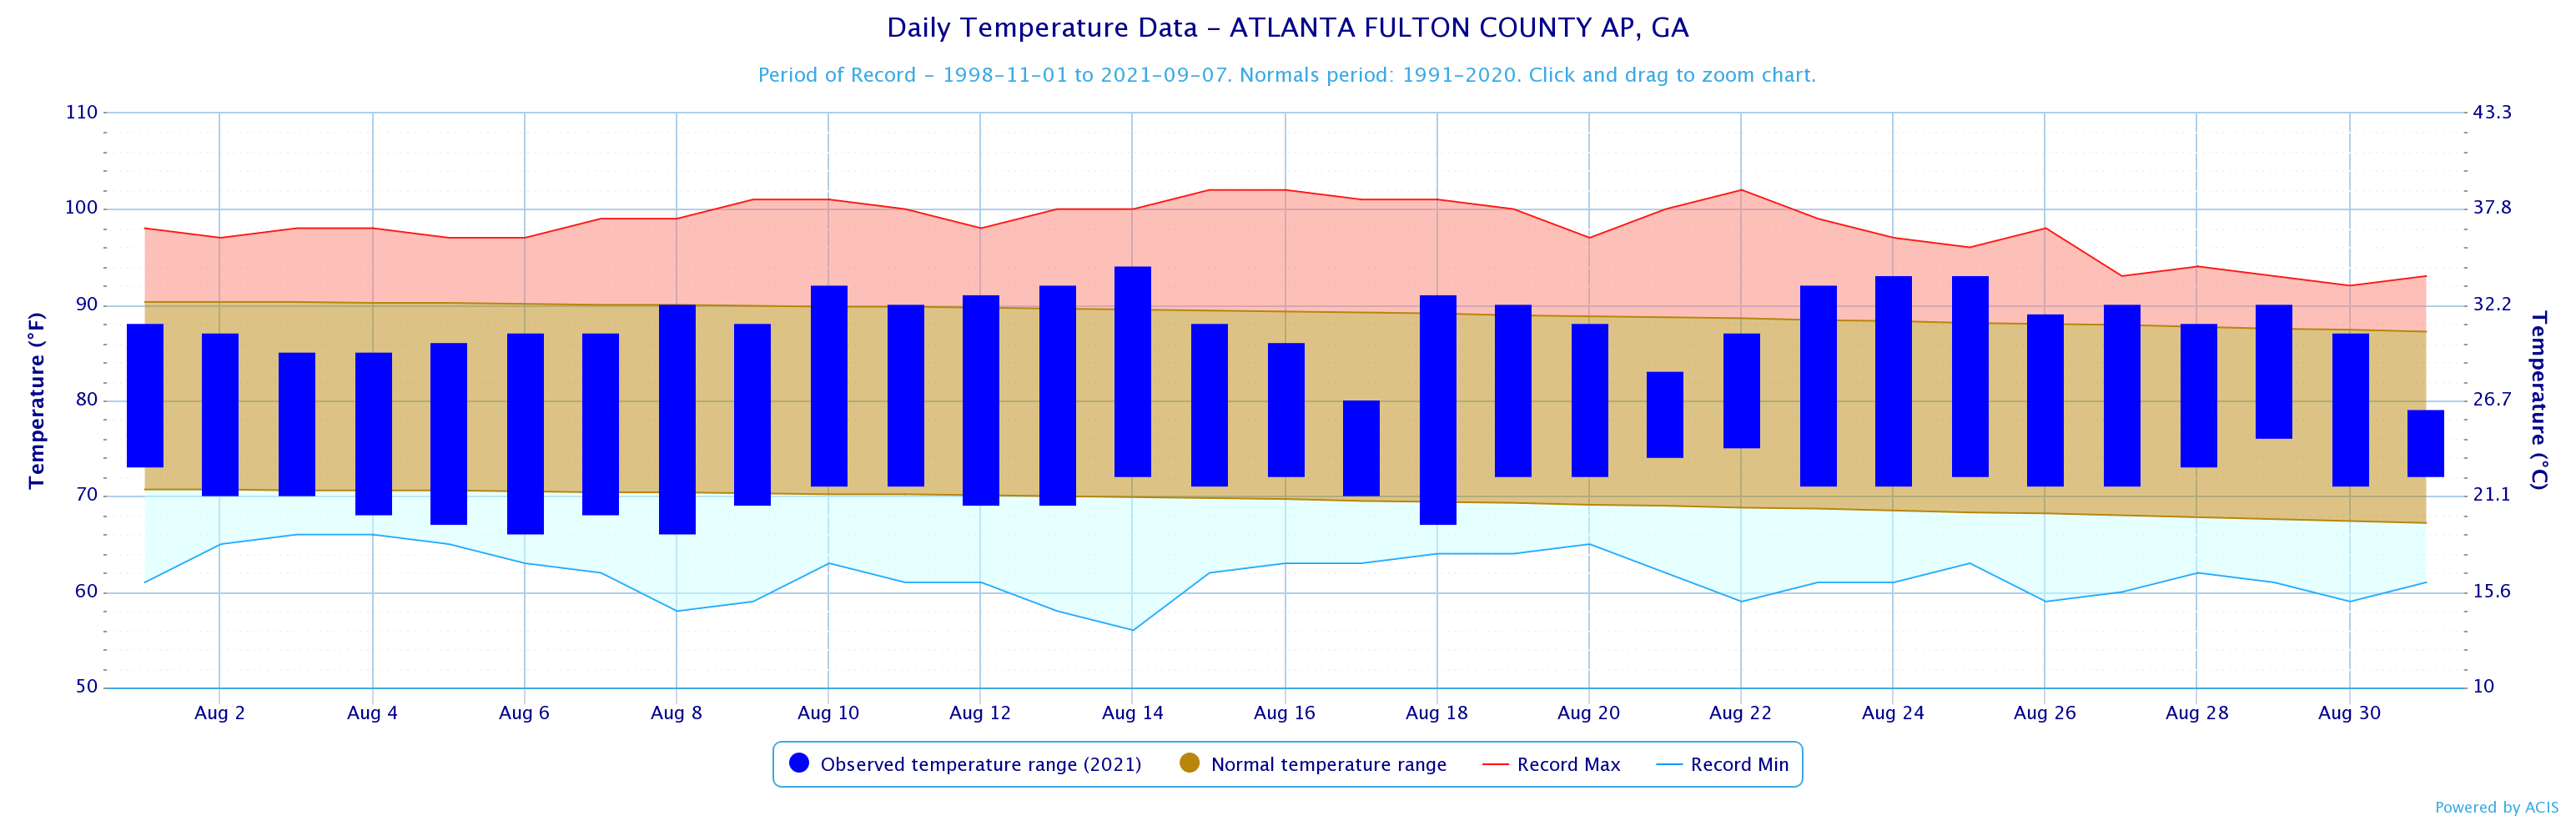
Fulton Co Arpt
|
94
|
8/14
|
66
|
8/6, 8/8
|
|
Gainesville
|
94
|
8/14
|
66
|
8/5
|
|
Peachtree City
|
96
|
8/14
|
66
|
8/5, 8/6
|
|
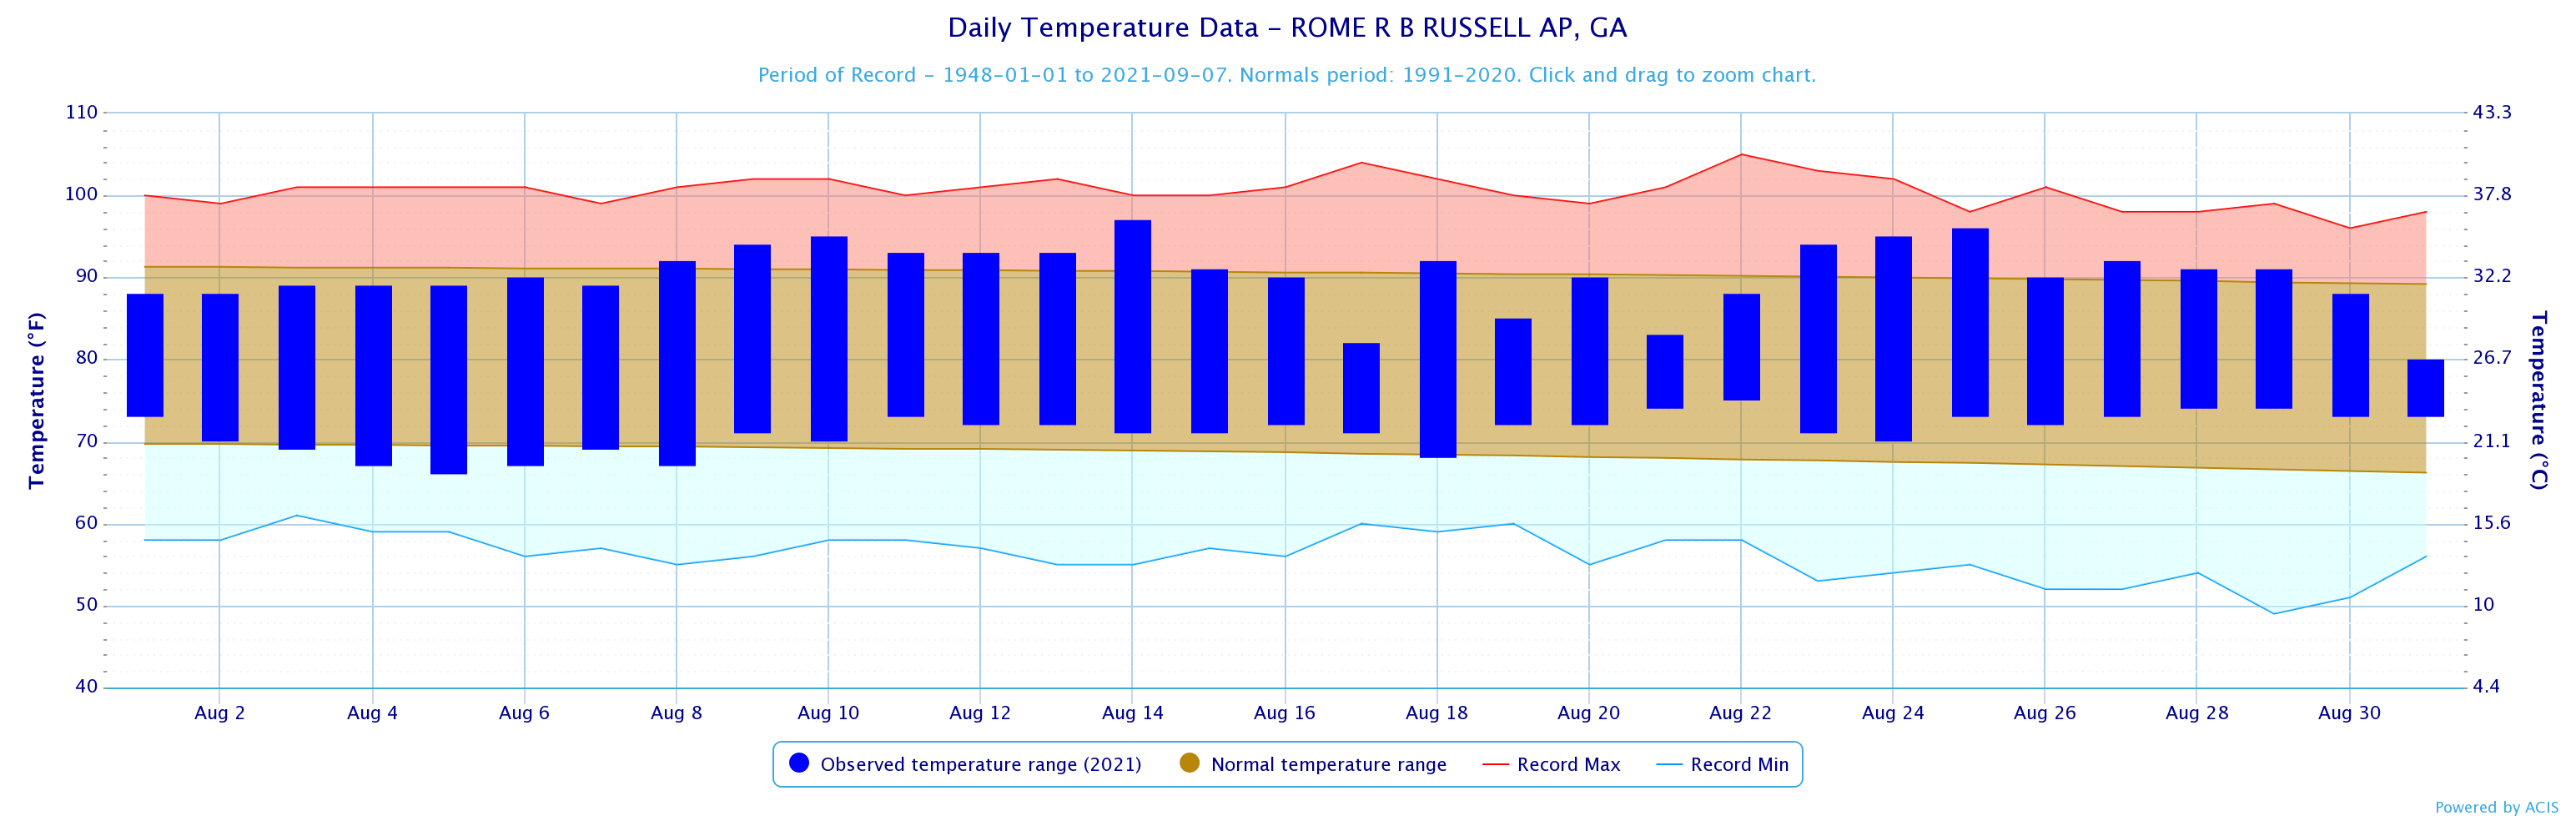
Rome
|
97
|
8/14
|
66
|
8/5
|
*Indicates a daily record was set
|
August 2021 Precipitation Climate Statistics
|
|||
|
Climate Site |
Total Precipitation |
Normal Precipitation
|
DFN (Departure From Normal)
|
|
6.8
|
4.55
|
+2.25
|
|
|
6.96
|
4.3
|
+2.66
|
|
|
7.25
|
4.68
|
+2.57
|
|
|
5.36
|
4.38
|
+0.98
|
|
|
8.23
|
3.44
|
+4.79
|
|
|
6.71
|
4.51
|
+2.20
|
|
|
4.44
|
3.98
|
+0.46
|
|
|
7.30
|
4.73
|
+2.57
|
|
|
3.53
|
3.96
|
-0.43
|
|
|
9.23
|
3.77
|
+5.46
|
|
|
August 2021 Precipitation Climate Statistics
|
||||
|
Climate Site |
Maximum Daily Precip |
Max P Date |
||
|
Athens
|
3.39
|
8/16*
|
||
|
Atlanta
|
3.61
|
8/16*
|
||
|
Columbus
|
2.28
|
8/16
|
||
|
Macon
|
1.92
|
8/16
|
||
|
Cartersville
|
2.84
|
8/17
|
||
|
Dekalb Peachtree Arpt
|
2.38
|
8/16
|
||
|
Fulton Co Arpt
|
2.24
|
8/16
|
||
|
Gainesville
|
2.54
|
8/16
|
||
|
Peachtree City
|
2.53
|
8/16
|
||
|
Rome
|
3.61
|
8/30
|
||
*Indicates a daily record was set
Data prepared by NWS Peachtree City/Atlanta
Temperature Maps |
Precipitation Maps
|
Temperature Graphs
|
Precipitation Graphs |


|
August 2021 Climate Records
|
|||
|
Date
|
Type
|
Location
|
Record
|
|
8/17
|
Daily Rainfall
|
Athens |
3.29 Inches of rain fell over 24 hours. This breaks the old record of 2.03 inches set in 2015
|
|
8/24
|
Highest Min Temp
|
Atlanta
|
A minimum temperature of 77 degrees was reached. This breaks the previous record of 76 degrees, last set in 1898.
|
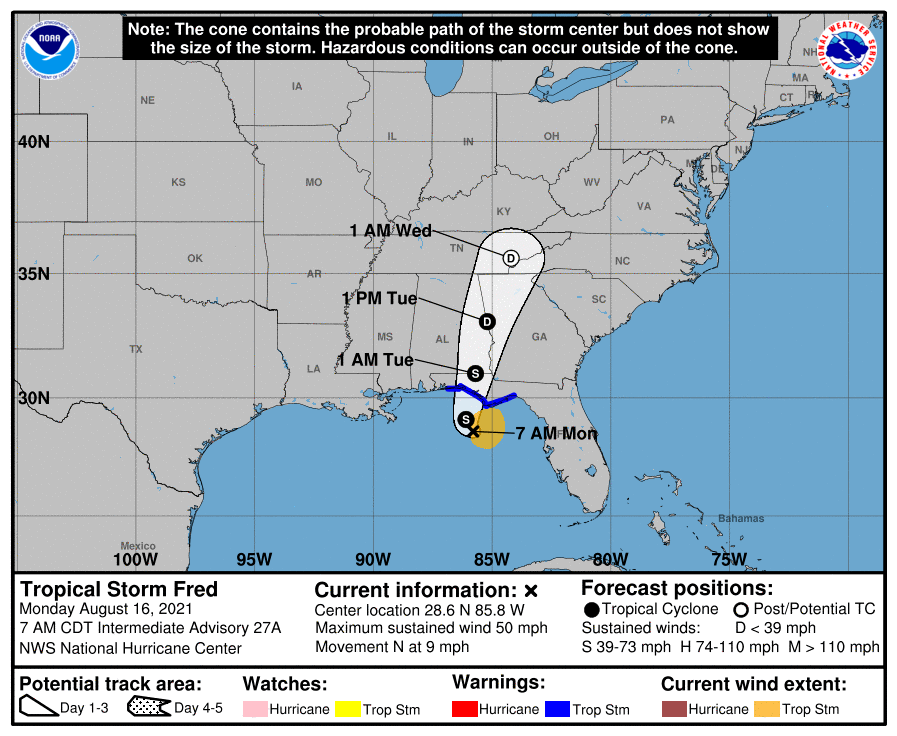
August 17th: The Remnants of Tropical Storm Fred
Tropical Storm Fred made landfall near Cape San Blas in the Florida panhandle as a tropical storm with sustained winds of 65 mph on the afternoon of August 16, 2021. The storm quickly weakened as it moved north bringing winds of up to 40 mph to south central Georgia. As the weakening storm moved northward, tropical moisture overspread central and north Georgia bringing widespread heavy rain, localized flash flooding, and seven tropical tornadoes. For more information on Tropical Storm Fred, please visit our event page for it's effects on north and central Georgia.
| Satellite Imagery | Storm Path |
 |
 |
Based on the Climate Prediction Center's outlook for September, northwest Georgia has a 33% chance of below normal temperatures while the remainder of Georgia has a equal chances for above, below or near normal temperatures. For precipitation, all of north and central Georgia has a 30% to 40% chance of above normal precipitation.
 |
 |

