| Previous Month | Next Month |
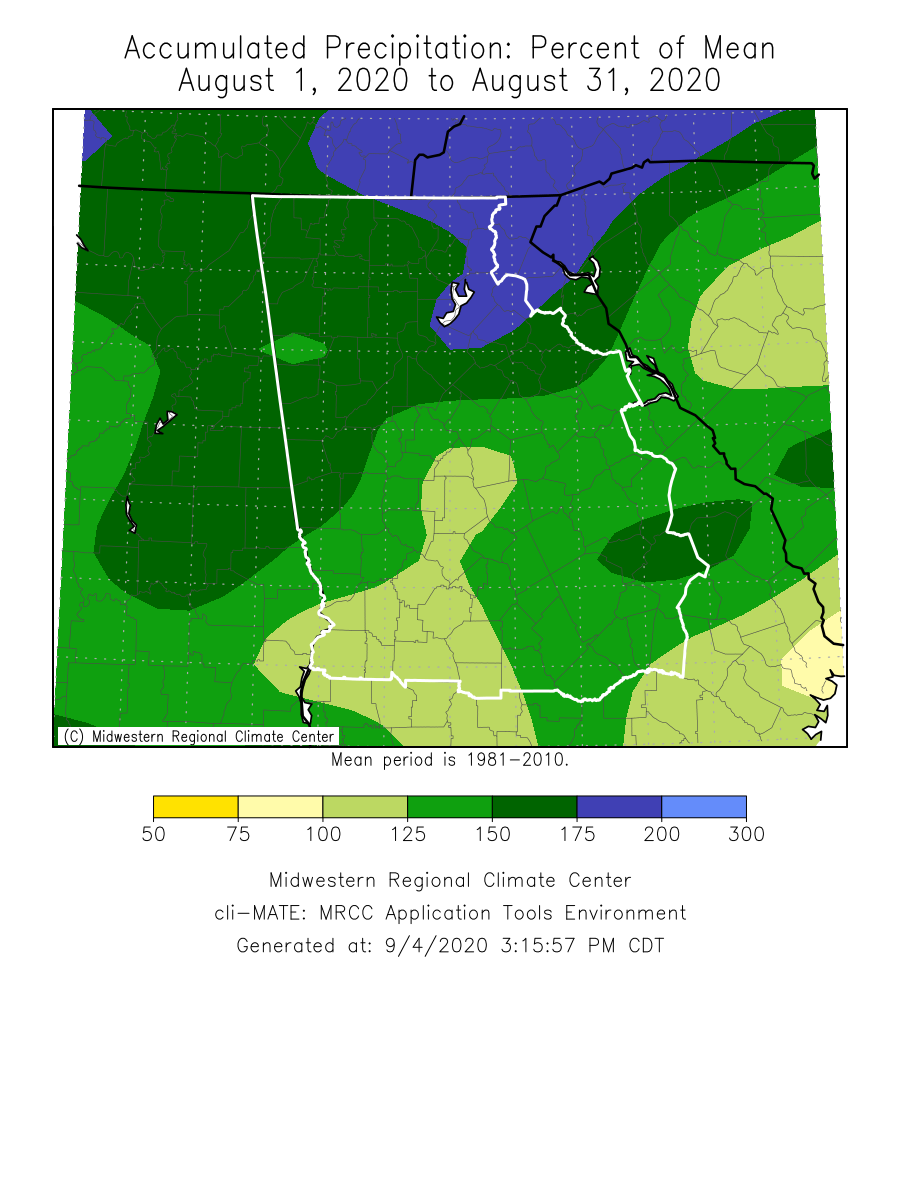
Temperatures through the month of August were around 0 to 2 degrees warmer than normal. Precipitation through the month of August was around 1 to 4 inches above normal.
|
August 2020 Temperature Climate Statistics
|
|||
| Climate Site | Average Temperature |
Normal Temperature
|
DFN (Departure
From Normal)
|
|
81.3
|
79.6
|
+1.7
|
|
|
80.9
|
79.4
|
+1.5
|
|
|
83.0
|
81.9
|
+1.1
|
|
|
82.6
|
80.9
|
+1.7
|
|
|
80.6
|
78.2
|
+2.4
|
|
|
79.1
|
79.0
|
+0.1
|
|
|
79.8
|
78.8
|
+1.0
|
|
|
78.2
|
78.1
|
+0.1
|
|
|
79.6
|
78.6
|
+1.0
|
|
|
80.9
|
78.6
|
+2.3
|
|
|
August 2020 Temperature Climate Statistics
|
||||
| Climate Site | Maximum Temperature | Max T Date |
Minimum Temperature
|
Min T Date
|
|
Athens
|
98
|
8/2
|
66
|
8/4
|
|
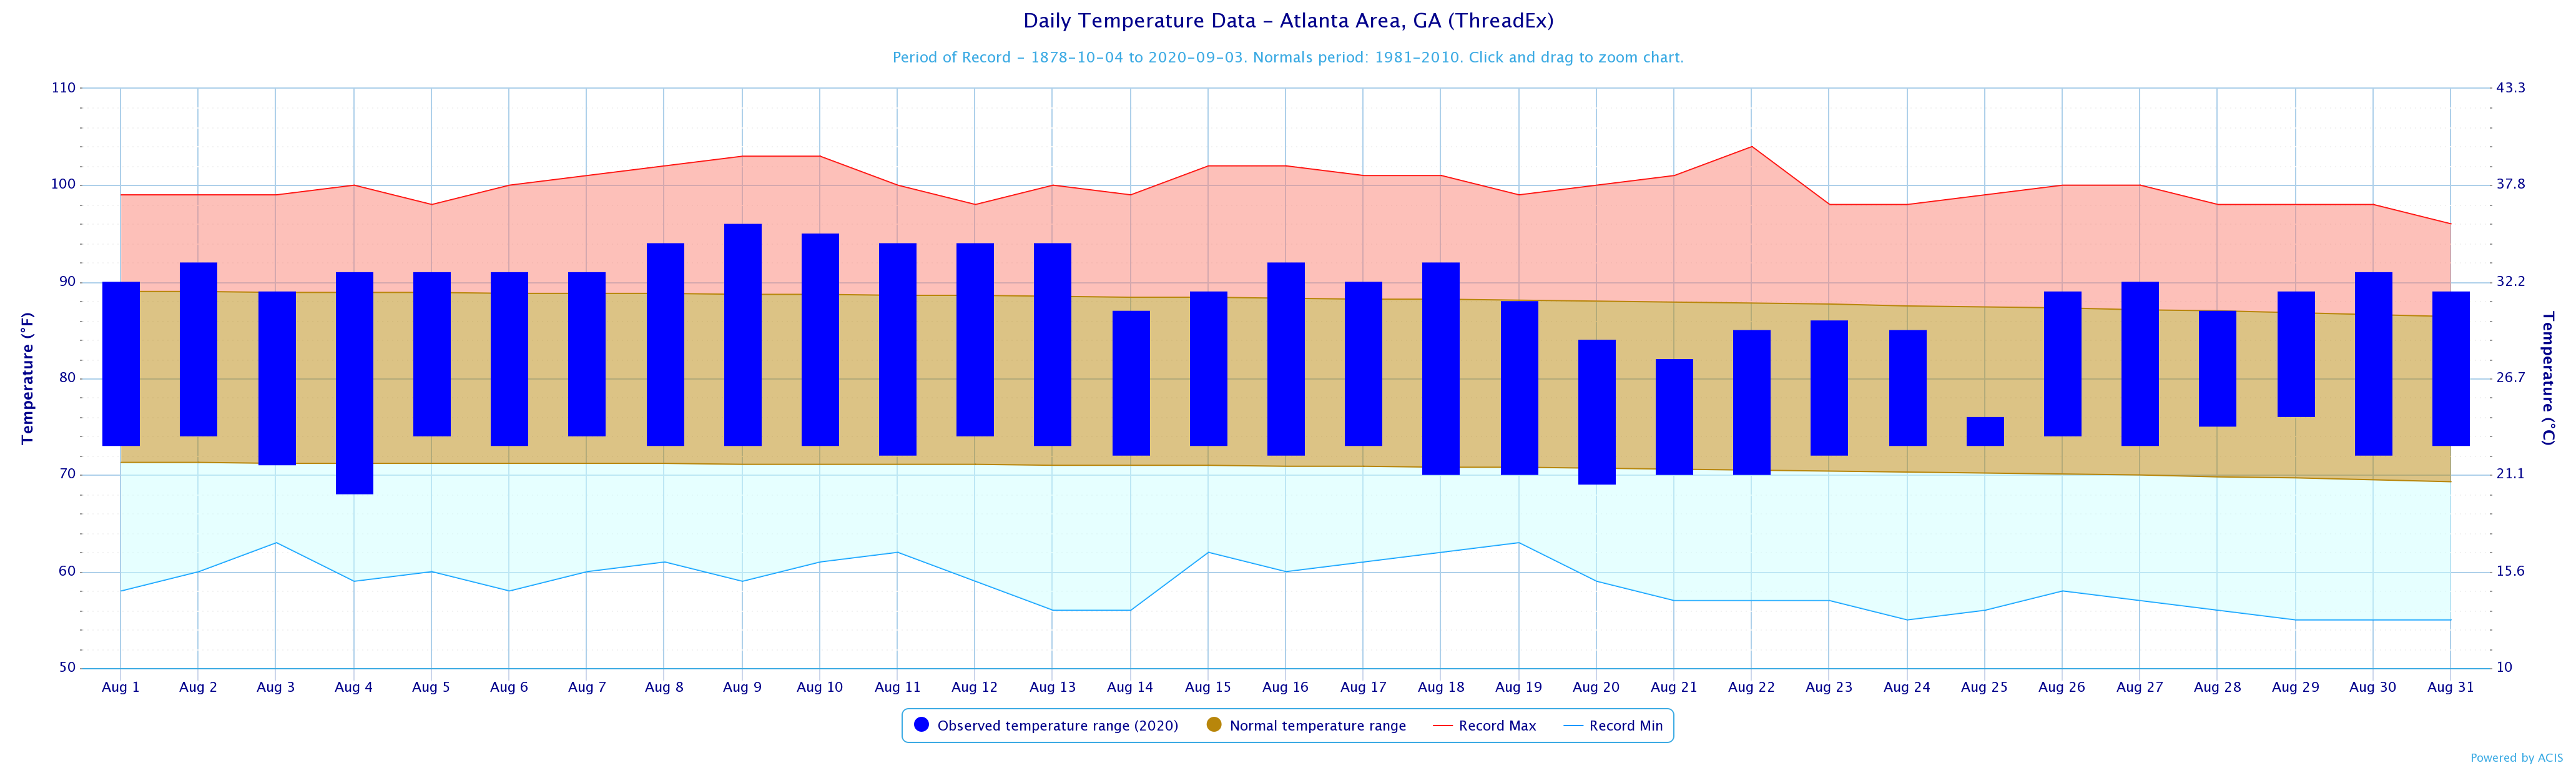
Atlanta
|
96
|
8/9
|
68
|
8/4
|
|
Columbus
|
97
|
8/12
|
70
|
8/20, 8/22
|
|
Macon
|
100
|
8/2
|
67
|
8/20
|
|
Cartersville
|
96
|
8/8
|
63
|
8/18
|
|
Dekalb Peachtree Arpt
|
94
|
8/10
|
64
|
8/18*
|
|
Fulton Co Arpt
|
95
|
8/9
|
64
|
8/18*
|
|
Gainesville
|
93
|
8/12
|
65
|
8/4*
|
|
Peactree City
|
95
|
8/9
|
63
|
8/18
|
|
Rome
|
98
|
8/12
|
66
|
8/18
|
*Indicates a daily record was set
|
August 2020 Precipitation Climate Statistics
|
|||
| Climate Site | Total Precipitation |
Normal Precipitation
|
DFN (Departure
From Normal)
|
|
9.27
|
3.53
|
+5.74
|
|
|
7.04
|
3.90
|
+3.14
|
|
|
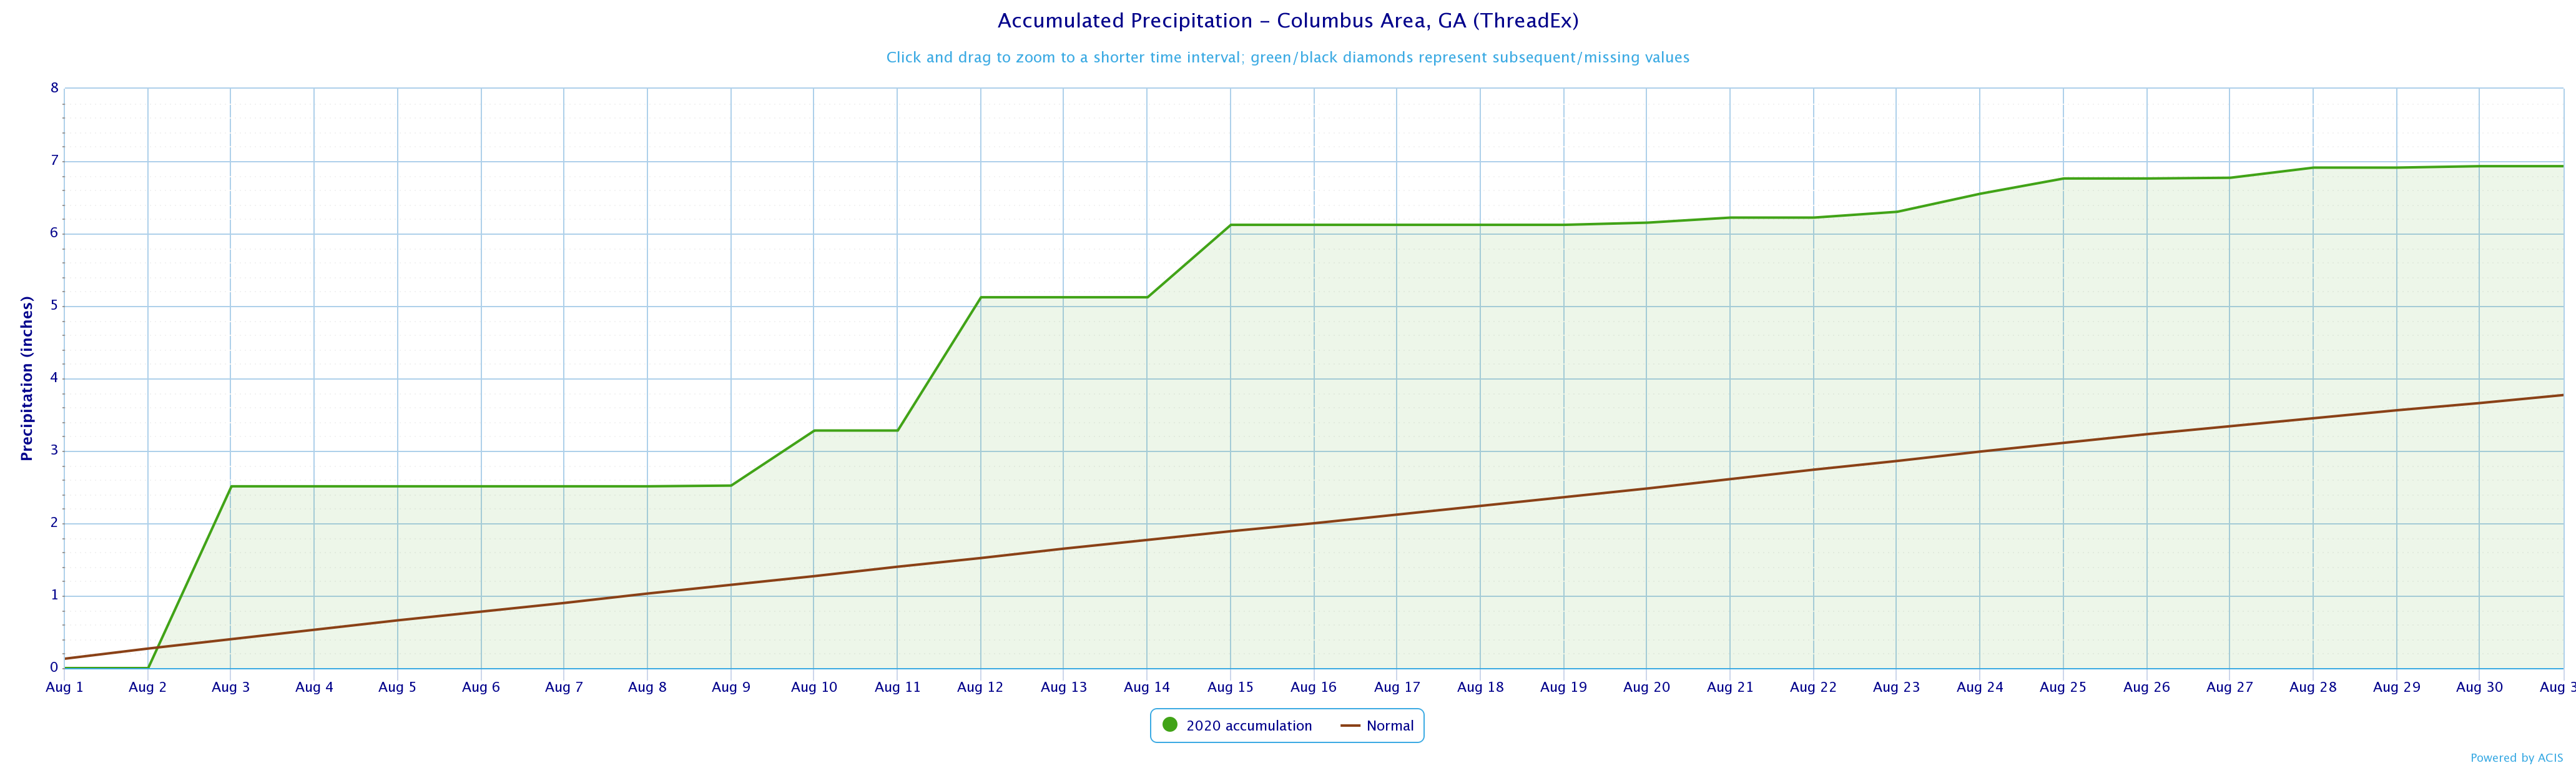
6.93
|
3.77
|
+3.16
|
|
|
5.34
|
4.10
|
+1.24
|
|
|
5.49
|
3.93
|
+1.56
|
|
|
7.59
|
4.31
|
+3.28
|
|
|
8.29
|
4.74
|
+3.55
|
|
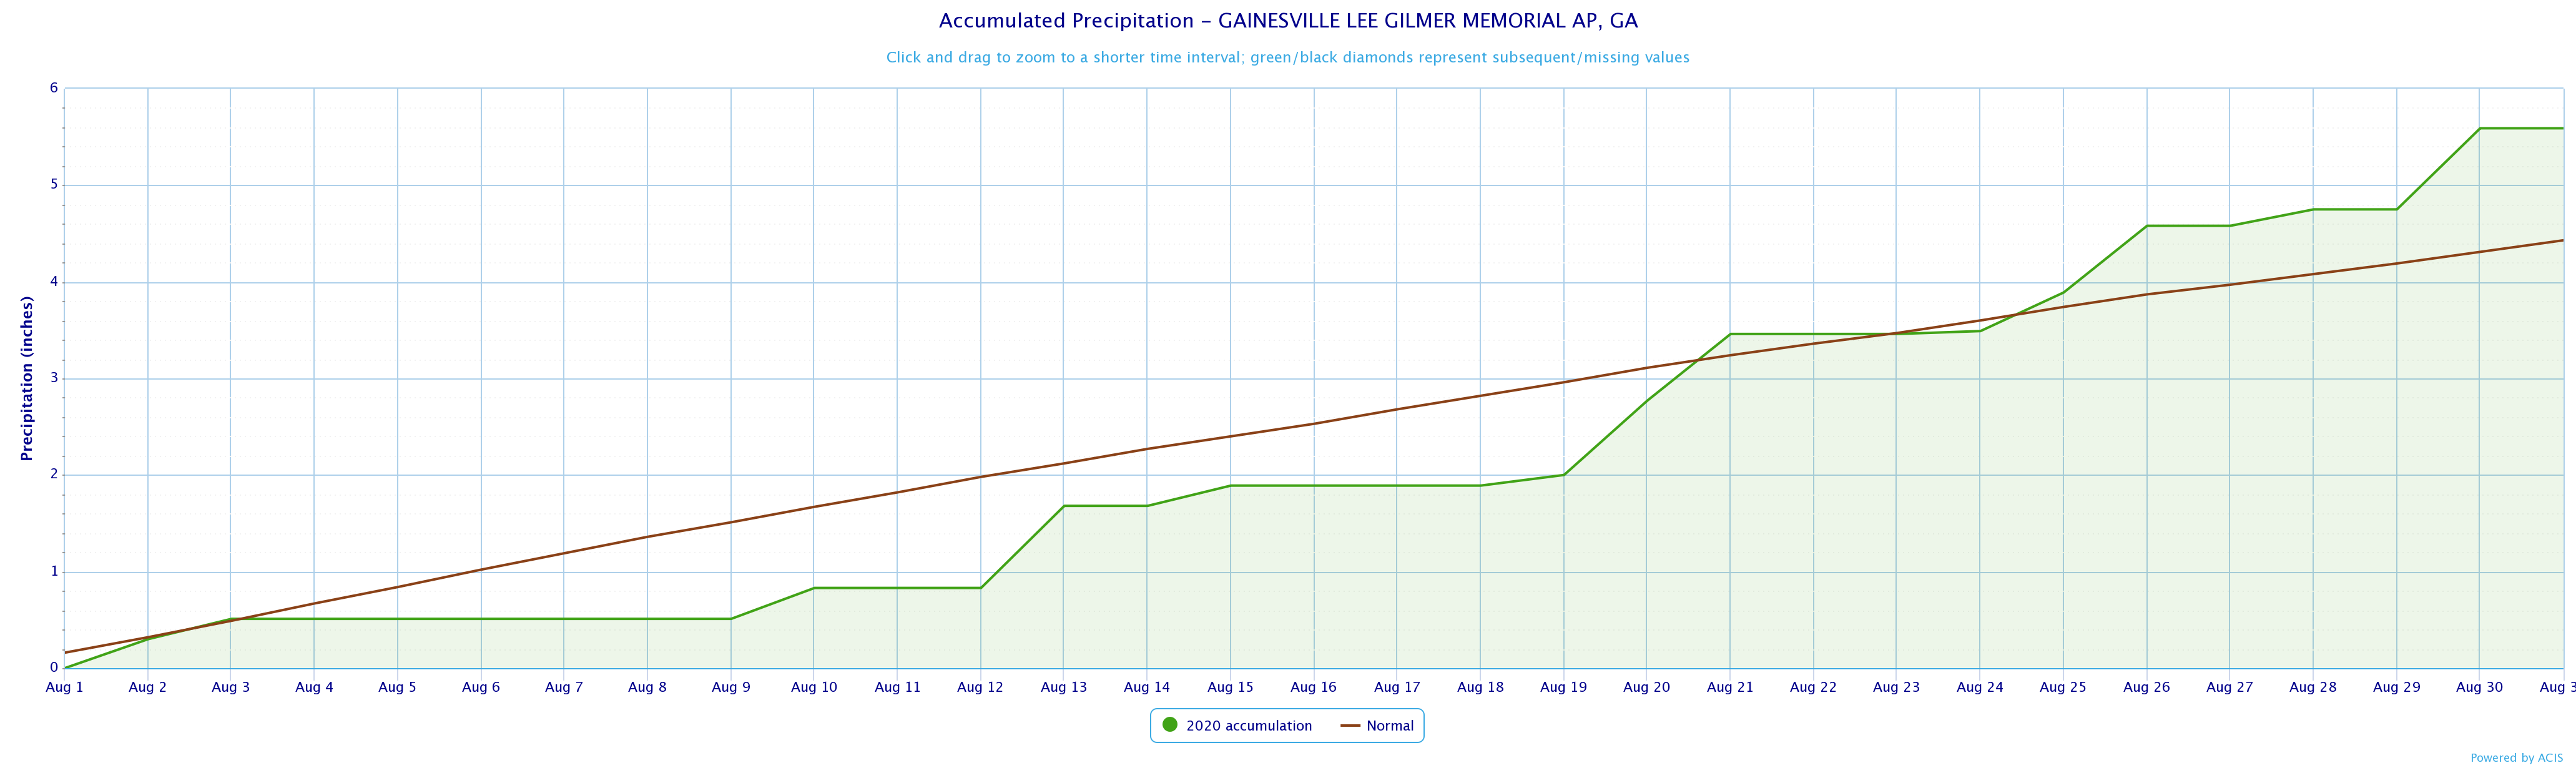
|
5.59
|
4.43
|
+1.16
|
|
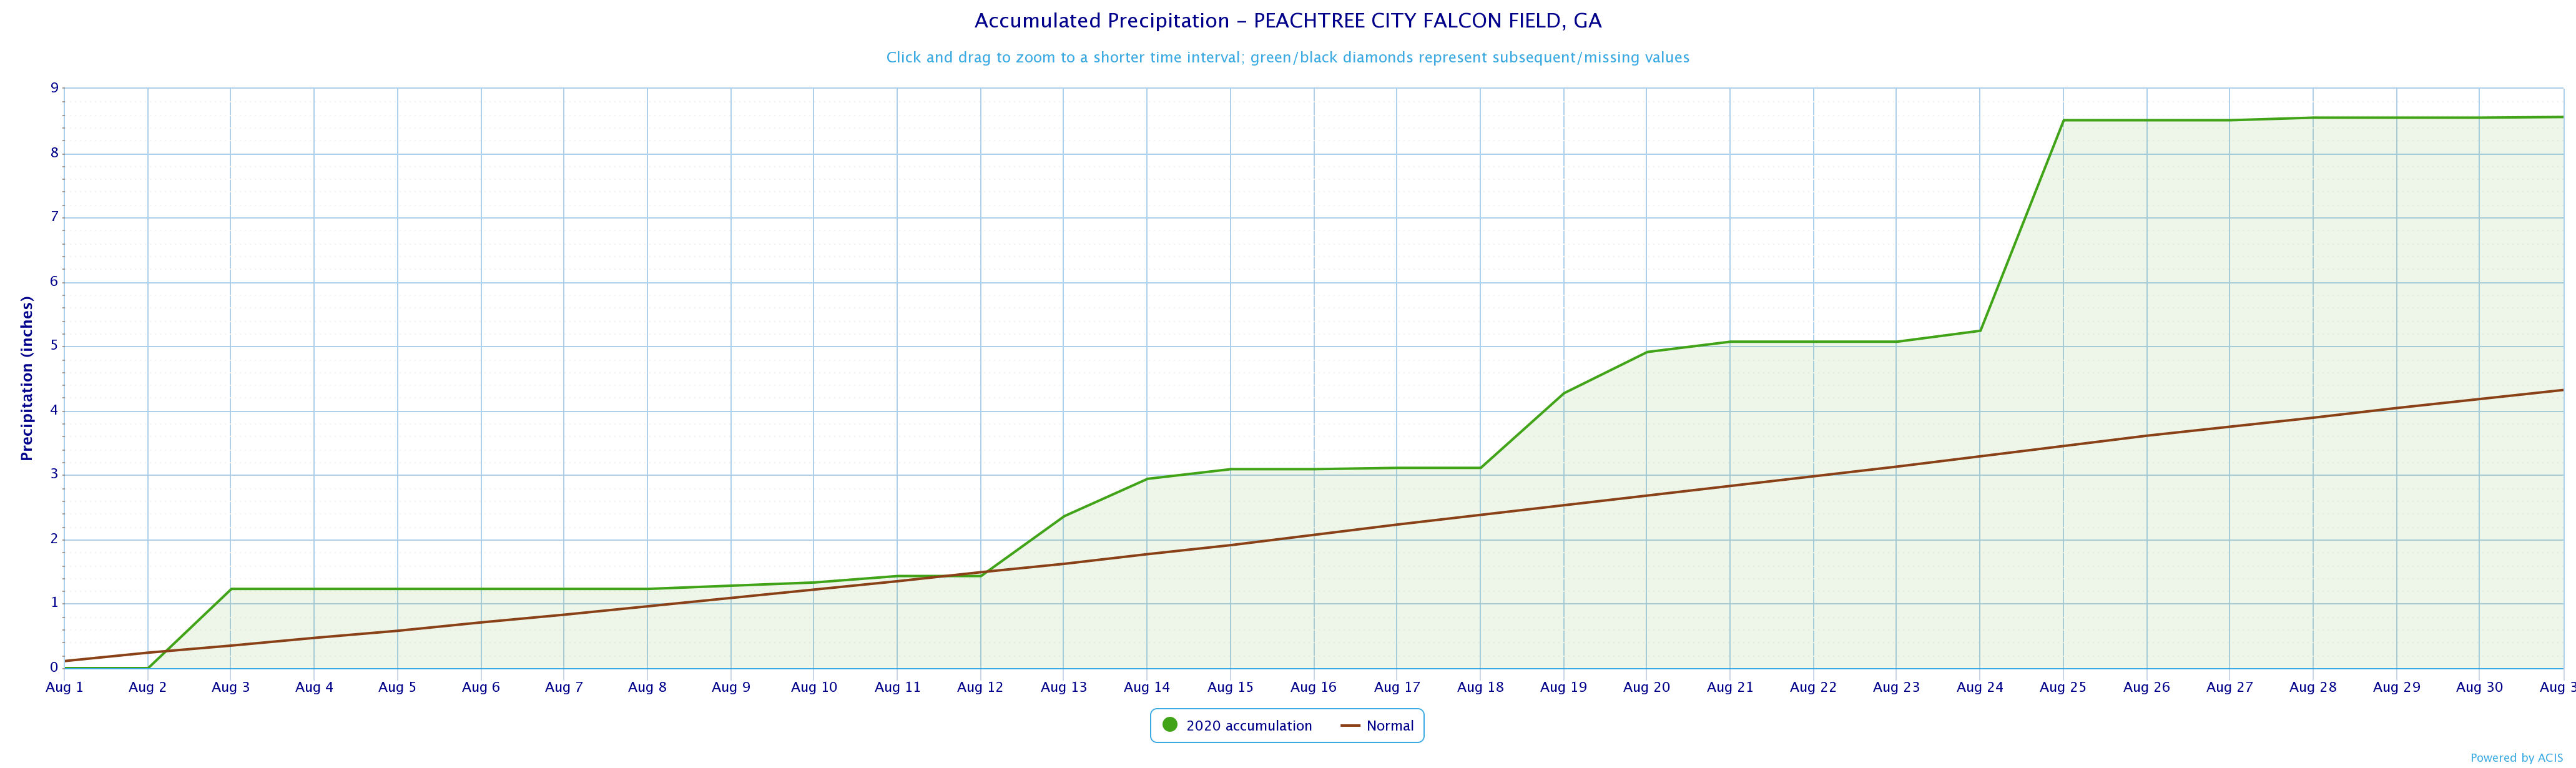
|
8.56
|
4.32
|
+4.24
|
|
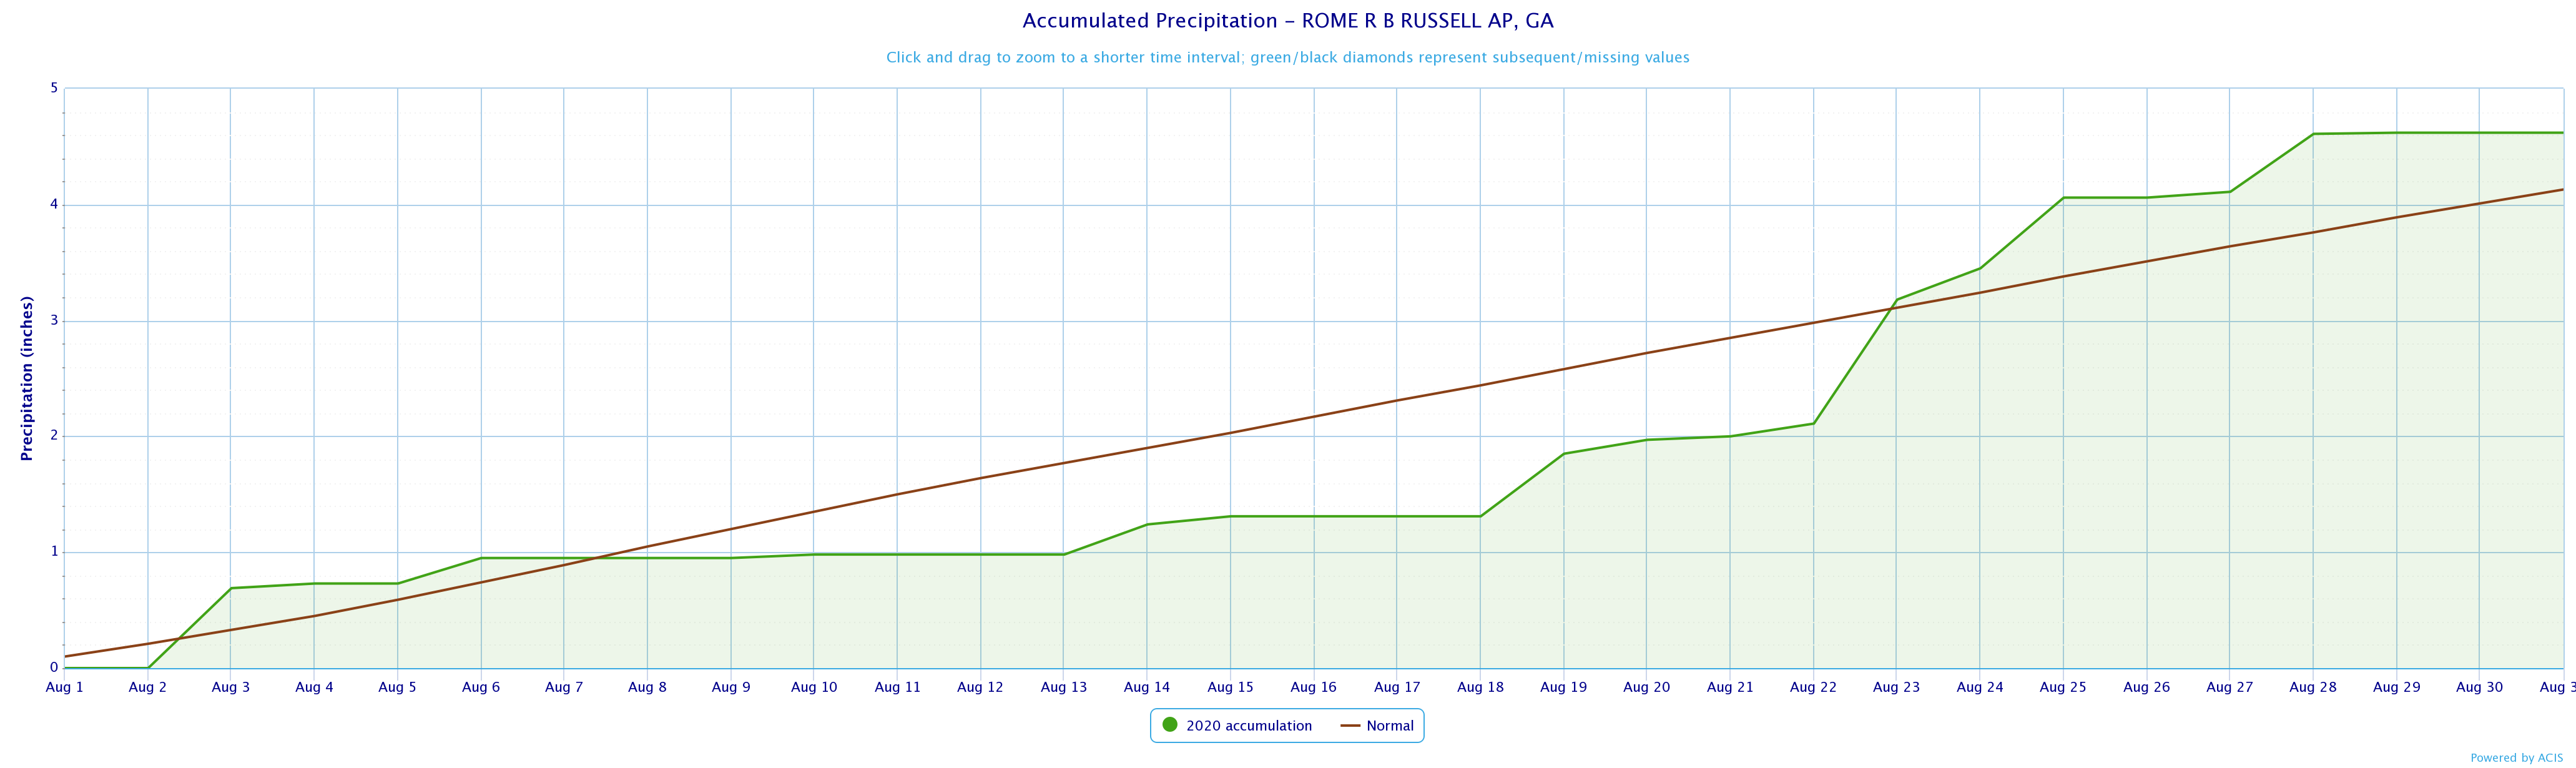
|
4.62
|
4.13
|
+0.49
|
|
|
August 2020 Precipitation Climate Statistics
|
||||
| Climate Site | Maximum Daily Precip | Max P Date | ||
|
Athens
|
2.37
|
8/21
|
||
|
Atlanta
|
2.70
|
8/30
|
||
|
Columbus
|
2.51
|
8/3
|
||
|
Macon
|
1.68
|
8/24
|
||
|
Cartersville
|
1.06
|
8/25*
|
||
|
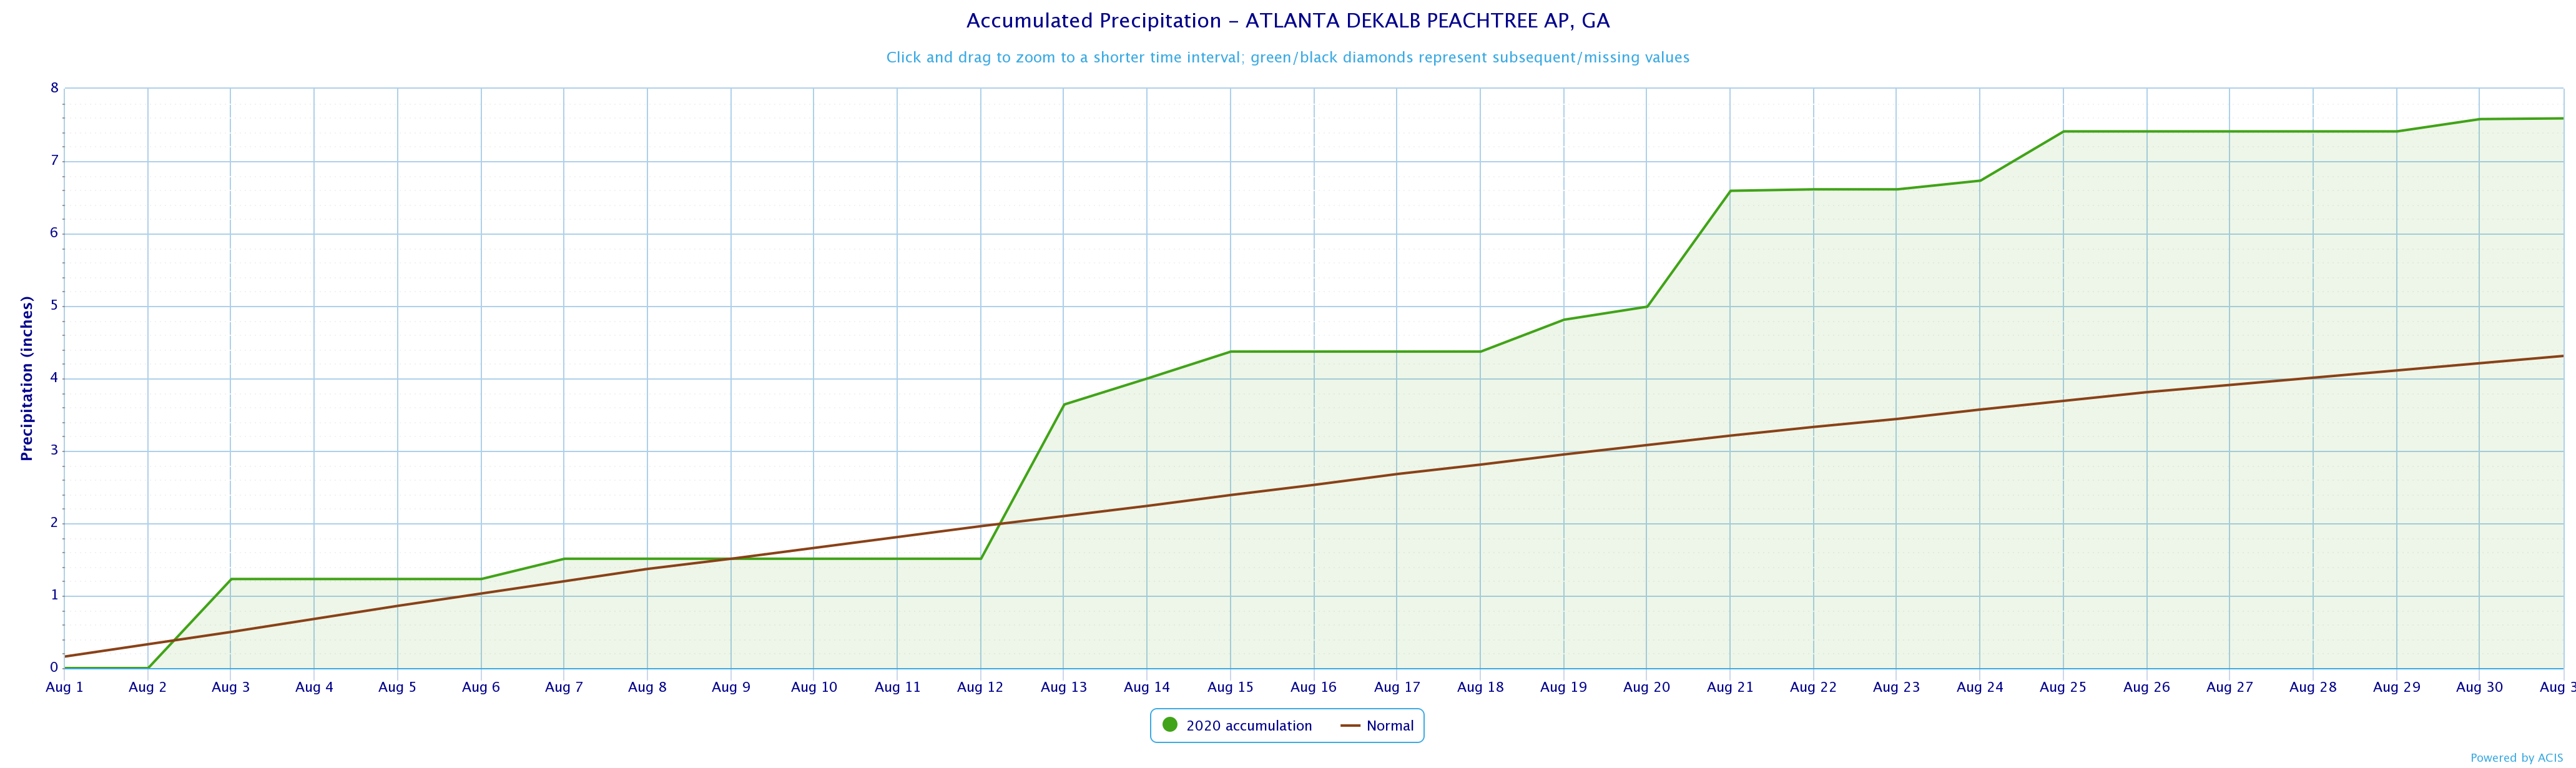
Dekalb Peachtree Arpt
|
2.13
|
8/13*
|
||
|
Fulton Co Arpt
|
1.72
|
8/21*
|
||
|
Gainesville
|
0.85
|
8/13
|
||
|
Peachtree City
|
3.27
|
8/25*
|
||
|
Rome
|
1.07
|
8/23* | ||
*Indicates a daily record was set; BOLD indicates an all time August record
Data prepared by NWS Peachtree City/Atlanta.
Temperature Maps |
Precipitation Maps
|
Temperature Graphs
|
Precipitation Graphs |


|
August 2020 Climate Records
|
|||
|
Date
|
Type
|
Location
|
Record
|
|
8/1
|
Highest Min Temp
|
Athens
|
A minimum temperature of 75 degrees was reached. This ties the previous record of 75 degrees, last set in 1947.
|
|
8/26
|
Highest Min Temp
|
Columbus
|
A minimum temperature of 77 degrees was reached. This ties the previous record of 77 degrees, last set in 1983.
|
|
8/26
|
Highest Min Temp
|
Macon
|
A minimum temperature of 76 degrees was reached. This ties the previous record of 76 degrees, last set in 1983.
|
|
8/28
|
Highest Min Temp
|
Columbus
|
A minimum temperature of 76 degrees was reached. This ties the previous record of 76 degrees, last set in 1983.
|
|
8/29
|
Highest Min Temp
|
Atlanta
|
A minimum temperature of 76 degrees was reached. This ties the previous record of 76 degrees, last set in 1932.
|
|
8/29
|
Highest Min Temp
|
Macon
|
A minimum temperature of 76 degrees was reached. This ties the previous record of 76 degrees, last set in 2005.
|
|
8/30
|
Highest Min Temp
|
Athens
|
A minimum temperature of 74 degrees was reached. This ties the previous record of 74 degrees, last set in 2005.
|
Although there were no large severe outbreaks in the month of August, 13 warnings were issued on August 3rd. Lots of heavy rain fell this day in addition to many trees and power lines that were downed. We also had several reports of tennis ball sized hail that day! Aside from the 3rd, numerous Severe Thunderstorm Warnings were issued throughout the month during typical summertime afternoon and evening storms, resulting in minor wind damage.
Here is a visual summary of all the warnings and local storm reports issued across portions of northern and central Georgia in August 2020.

Based on the Climate Prediction Center's outlook for September, north Georgia has equal chances of above normal, normal, or below normal temperatures and central Georgia has a 33% to 40% chance of above normal temperatures. For precipitation, all of north and central Georgia has a 40% to 50% chance of above normal precipitation .


Data prepared by NWS Peachtree City/Atlanta.

