North and Central Georgia
2020 Annual Climate Summary
Overall, 2020 was both warmer and wetter for all of North and Central Georgia.
Jump to:
| Average Temperatures | Temperature Graphs | Precipitation Totals | Precipitation Graphs | Snowfall Totals | Narrative Summary |
Annual Top 10 Rankings:
Athens
Atlanta
Columbus
Macon
Annual Avg. Temperature (ºF) and Rankings
* Click on site name below to view a graph with additional data
|
Site |
Avg. Temp. and Current Ranking |
Normal |
Dep. from Normal |
Previous Records |
|
64.9 (3rd Warmest) |
62.5 |
+2.4 |
65.6 (1933) |
|
|
64.8 (6th Warmest) |
62.5 |
+2.3 |
66.1 (2019) |
|
|
67.6 (11th Warmest) |
65.6 |
+2.0 |
69.3 (1927) |
|
|
66.8 (3rd Warmest - tied) |
64.5 |
+2.3 |
67.2 (2019) |
|
|
63.3 |
60.1 |
+3.2 |
|
|
|
62.4 |
61.7 |
+0.7 |
|
|
|
63.3 |
61.8 |
+1.5 |
|
|
|
62.1 |
60.9 |
+1.2 |
|
|
|
64.1 |
61.4 |
+2.7 |
|
|
|
63.3 |
60.5 |
+2.8 |
|
Monthly Avg. Temperature (ºF)
DFN = Departure from normal
Athens
|
Month |
Jan |
Feb |
Mar |
Apr |
May |
Jun |
Jul |
Aug |
Sep |
Oct |
Nov |
Dec |
Annual |
|
Temp. |
48.8 |
49.9 |
60.8 |
62.2 |
68.5 |
77.6 |
83.1 |
81.3 |
73.8 |
67.3 |
59.2 |
46.1 |
64.9 |
|
Normal |
43.5 |
47.2 |
54.3 |
61.7 |
70.0 |
77.5 |
80.6 |
79.6 |
73.3 |
63.0 |
53.8 |
45.4 |
62.5 |
|
DFN |
+1.5 |
+5.0 |
-0.8 |
+2.2 |
+5.5 |
-0.5 |
+1.4 |
+0.7 |
+6.0 |
+4.4 |
-1.9 |
+4.8 |
+2.4 |
Atlanta
|
Month |
Jan |
Feb |
Mar |
Apr |
May |
Jun |
Jul |
Aug |
Sep |
Oct |
Nov |
Dec |
Annual |
|
Temp. |
49.2 |
49.9 |
61.6 |
61.6 |
68.9 |
76.8 |
82.1 |
80.9 |
73.8 |
67.3 |
58.9 |
46.1 |
64.8 |
|
Normal |
43.3 |
47.2 |
54.3 |
62.0 |
70.1 |
77.3 |
80.2 |
79.4 |
73.5 |
63.3 |
54.0 |
45.3 |
62.5 |
|
DFN |
+5.9 |
+2.7 |
+7.3 |
-0.4 |
-1.2 |
-0.5 |
+1.9 |
+1.5 |
+0.3 |
+4.0 |
+4.9 |
+0.8 |
+2.3 |
Columbus
|
Month |
Jan |
Feb |
Mar |
Apr |
May |
Jun |
Jul |
Aug |
Sep |
Oct |
Nov |
Dec |
Annual |
|
Temp. |
52.4 |
53.2 |
65.4 |
64.9 |
71.7 |
79.3 |
83.7 |
83.0 |
76.8 |
70.3 |
62.0 |
48.2 |
67.6 |
|
Normal |
47.2 |
51.1 |
57.8 |
64.6 |
73.0 |
79.8 |
82.5 |
81.9 |
76.6 |
66.5 |
57.3 |
49.1 |
65.6 |
|
DFN |
+5.2 |
+2.1 |
+7.6 |
+0.3 |
-1.3 |
-0.5 |
+1.2 |
+1.1 |
+0.2 |
+3.8 |
+4.7 |
-0.9 |
+2.0 |
Macon
|
Month |
Jan |
Feb |
Mar |
Apr |
May |
Jun |
Jul |
Aug |
Sep |
Oct |
Nov |
Dec |
Annual |
|
Temp. |
52.5 |
52.4 |
64.5 |
63.7 |
70.8 |
78.8 |
83.6 |
82.6 |
75.2 |
69.3 |
61.3 |
47.3 |
66.8 |
|
Normal |
46.3 |
50.0 |
56.8 |
63.4 |
71.9 |
78.9 |
81.8 |
80.9 |
75.0 |
64.9 |
55.9 |
48.0 |
64.5 |
|
DFN |
+6.2 |
+2.4 |
+7.7 |
+0.3 |
-1.1 |
-0.1 |
+1.8 |
+1.7 |
+0.2 |
+4.4 |
+5.4 |
-0.7 |
+2.3 |
Cartersville
|
Month |
Jan |
Feb |
Mar |
Apr |
May |
Jun |
Jul |
Aug |
Sep |
Oct |
Nov |
Dec |
Annual |
|
Temp. |
47.2 |
48.9 |
59.4 |
59.1 |
67.2 |
76.2 |
81.8 |
80.6 |
73.3 |
65.6 |
56.5 |
44.3 |
63.3 |
|
Normal |
41.1 |
44.6 |
51.7 |
59.2 |
67.6 |
74.8 |
78.3 |
78.2 |
71.3 |
60.6 |
51.3 |
42.6 |
60.1 |
|
DFN |
+6.1 |
+4.3 |
+7.7 |
-0.1 |
-0.4 |
+1.4 |
+3.5 |
+2.4 |
+2.0 |
+5.0 |
+5.2 |
+1.7 |
+3.2 |
DeKalb Peachtree Arpt
|
Month |
Jan |
Feb |
Mar |
Apr |
May |
Jun |
Jul |
Aug |
Sep |
Oct |
Nov |
Dec |
Annual |
|
Temp. |
46.2 |
47.3 |
58.4 |
58.4 |
66.4 |
75.2 |
80.6 |
79.1 |
72.2 |
64.8 |
56.3 |
43.5 |
62.4 |
|
Normal |
42.2 |
46.1 |
53.3 |
61.6 |
69.4 |
76.8 |
79.8 |
79.0 |
72.9 |
61.9 |
52.7 |
44.3 |
61.7 |
|
DFN |
+4.0 |
+1.2 |
+5.1 |
-3.2 |
-3.0 |
-1.6 |
+0.8 |
+0.1 |
-0.7 |
+2.9 |
+3.6 |
-0.8 |
+0.7 |
Fulton Co. Arpt
|
Month |
Jan |
Feb |
Mar |
Apr |
May |
Jun |
Jul |
Aug |
Sep |
Oct |
Nov |
Dec |
Annual |
|
Temp. |
47.7 |
49.0 |
60.1 |
59.5 |
67.2 |
75.7 |
80.8 |
79.8 |
72.7 |
65.5 |
56.9 |
44.6 |
63.3 |
|
Normal |
43.1 |
46.3 |
53.6 |
61.0 |
69.3 |
76.7 |
79.8 |
78.8 |
72.8 |
62.5 |
53.0 |
44.8 |
61.8 |
|
DFN |
+4.6 |
+2.7 |
+6.5 |
-1.5 |
-2.1 |
-1.0 |
+1.0 |
+1.0 |
-0.1 |
+3.0 |
+3.9 |
-0.2 |
+1.5 |
Gainesville
|
Month |
Jan |
Feb |
Mar |
Apr |
May |
Jun |
Jul |
Aug |
Sep |
Oct |
Nov |
Dec |
Annual |
|
Temp. |
46.2 |
46.5 |
57.5 |
59.4 |
65.8 |
74.7 |
80.4 |
78.2 |
71.2 |
64.3 |
56.9 |
44.3 |
62.1 |
|
Normal |
41.7 |
45.5 |
52.7 |
60.4 |
68.2 |
75.6 |
78.8 |
78.1 |
71.7 |
61.7 |
52.6 |
43.7 |
60.9 |
|
DFN |
+4.5 |
+1.0 |
+4.8 |
-1.0 |
-2.4 |
-0.9 |
+1.6 |
+0.1 |
-0.5 |
+2.6 |
+4.3 |
+0.5 |
+1.2 |
Peachtree City
|
Month |
Jan |
Feb |
Mar |
Apr |
May |
Jun |
Jul |
Aug |
Sep |
Oct |
Nov |
Dec |
Annual |
|
Temp. |
49.7 |
51.0 |
62.3 |
61.6 |
68.8 |
76.0 |
80.7 |
79.6 |
72.4 |
65.8 |
57.0 |
44.7 |
64.1 |
|
Normal |
42.8 |
46.7 |
53.2 |
60.5 |
68.9 |
75.9 |
79.3 |
78.6 |
72.1 |
61.4 |
52.7 |
44.4 |
61.4 |
|
DFN |
+6.9 |
+4.3 |
+9.1 |
+1.1 |
-0.1 |
+0.1 |
+1.4 |
+1.0 |
+0.3 |
+4.4 |
+4.3 |
+0.3 |
+2.7 |
Rome
|
Month |
Jan |
Feb |
Mar |
Apr |
May |
Jun |
Jul |
Aug |
Sep |
Oct |
Nov |
Dec |
Annual |
|
Temp. |
46.7 |
48.1 |
59.4 |
59.6 |
67.3 |
76.6 |
82.3 |
80.9 |
73.6 |
65.2 |
55.8 |
43.5 |
63.3 |
|
Normal |
41.1 |
44.3 |
52.1 |
59.8 |
68.2 |
75.9 |
79.4 |
78.6 |
72.0 |
61.1 |
50.9 |
42.6 |
60.5 |
|
DFN |
+5.6 |
+3.8 |
+7.3 |
-0.2 |
-0.9 |
+0.7 |
+2.9 |
+2.3 |
+1.6 |
+4.1 |
+4.9 |
+0.9 |
+2.8 |
Temp. Extremes (ºF)
|
Site |
Warmest Temp. |
Coldest Temp. |
|
Athens |
102 (7/20) |
21 (1/22, 12/26) |
|
Atlanta |
96 (8/9) |
22 (12/26) |
|
Columbus |
99 (7/19) |
25 (12/26, 12/27) |
|
Macon |
102 (7/20) |
22 (12/26, 12/27) |
|
Cartersville |
99 (7/20) |
18 (1/22) |
|
DeKalb Peachtree Arpt |
96 (7/20) |
20 (1/22) |
|
Fulton Co. Arpt |
96 (7/20) |
20 (1/22) |
|
Gainesville |
95 (7/17*, 7/18, 7/20) |
20 (12/26*) |
|
Peachtree City |
96 (7/20) |
22 (1/22) |
|
Rome |
99 (7/17, 7/19, 7/20*) |
18 (12/26) |
* Set record for day


Annual Precipitation Totals (inches) and Rankings
* Click on site name below to view a graph with additional data
|
Site |
Total Precip. and Current Ranking |
Normal |
Dep. from Normal |
% of Normal |
Previous Records |
|
63.67 (9th Wettest) |
46.33 |
+17.34 |
137% |
72.37 (1929) |
|
|
66.99 (6th Wettest) |
49.71 |
+17.28 |
135% |
71.45 (1948) |
|
|
69.09 (5th Wettest) |
46.75 |
+22.34 |
148% |
80.20 (2009) |
|
|
59.93 (8th Wettest) |
45.68 |
+14.25 |
131% |
72.67 (2013) |
|
|
59.36 |
49.93 |
+9.43 |
119% |
|
|
|
71.26 |
52.97 |
+18.29 |
135% |
|
|
|
65.97 |
51.17 |
+14.80 |
129% |
|
|
|
71.10 |
53.98 |
+17.12 |
132% |
|
|
|
64.22 |
49.99 |
+14.23 |
128% |
|
|
|
58.91 |
51.92 |
+6.99 |
113% |
|
Monthly Precipitation Totals (inches)
DFN = Departure from normal
Athens
|
Month |
Jan |
Feb |
Mar |
Apr |
May |
Jun |
Jul |
Aug |
Sep |
Oct |
Nov |
Dec |
Annual |
|
Total |
7.49 |
11.05 |
5.42 |
4.52 |
3.75 |
2.66 |
1.90 |
9.54 |
6.08 |
3.45 |
4.77 |
3.04 |
63.67 |
|
Normal |
4.05 |
4.48 |
4.43 |
3.15 |
3.00 |
4.18 |
4.47 |
3.53 |
3.94 |
3.55 |
3.82 |
3.73 |
46.33 |
|
DFN |
+3.44 |
+6.57 |
+0.99 |
+1.37 |
+0.75 |
-1.52 |
-2.57 |
+6.01 |
+2.14 |
-0.10 |
+0.95 |
-0.69 |
+17.34 |
Atlanta
|
Month |
Jan |
Feb |
Mar |
Apr |
May |
Jun |
Jul |
Aug |
Sep |
Oct |
Nov |
Dec |
Annual |
|
Total |
8.01 |
10.58 |
7.45 |
5.36 |
4.19 |
2.64 |
2.60 |
7.04 |
5.67 |
8.23 |
2.93 |
2.29 |
66.99 |
|
Normal |
4.20 |
4.67 |
4.81 |
3.36 |
3.67 |
3.95 |
5.27 |
3.90 |
4.47 |
3.41 |
4.10 |
3.90 |
49.71 |
|
DFN |
+3.81 |
+5.91 |
+2.64 |
+2.00 |
+0.52 |
-1.31 |
-2.67 |
+3.14 |
+1.20 |
+4.82 |
-1.17 |
-1.61 |
+17.28 |
Columbus
|
Month |
Jan |
Feb |
Mar |
Apr |
May |
Jun |
Jul |
Aug |
Sep |
Oct |
Nov |
Dec |
Annual |
|
Total |
7.53 |
9.90 |
5.63 |
10.57 |
1.37 |
4.83 |
3.49 |
6.93 |
7.52 |
4.51 |
3.73 |
3.08 |
69.09 |
|
Normal |
3.85 |
4.44 |
5.46 |
3.55 |
3.19 |
3.72 |
4.76 |
3.77 |
3.06 |
2.58 |
4.10 |
4.27 |
46.75 |
|
DFN |
+3.68 |
+5.46 |
+0.17 |
+7.02 |
-1.82 |
+1.11 |
-1.27 |
+3.16 |
+4.46 |
+1.93 |
-0.37 |
-1.19 |
+22.34 |
Macon
|
Month |
Jan |
Feb |
Mar |
Apr |
May |
Jun |
Jul |
Aug |
Sep |
Oct |
Nov |
Dec |
Annual |
|
Total |
4.13 |
9.91 |
6.00 |
11.90 |
1.31 |
2.21 |
1.85 |
5.34 |
7.97 |
1.49 |
5.38 |
2.44 |
59.93 |
|
Normal |
4.24 |
4.36 |
4.55 |
2.96 |
2.72 |
4.06 |
4.95 |
4.10 |
3.59 |
2.79 |
3.32 |
4.04 |
45.68 |
|
DFN |
-0.11 |
+5.55 |
+1.45 |
+8.94 |
-1.41 |
-1.85 |
-3.10 |
+1.24 |
+4.38 |
-1.30 |
+2.06 |
-1.60 |
+14.25 |
Cartersville
|
Month |
Jan |
Feb |
Mar |
Apr |
May |
Jun |
Jul |
Aug |
Sep |
Oct |
Nov |
Dec |
Annual |
|
Total |
5.56 |
11.56 |
7.02 |
7.16 |
2.45 |
2.87 |
1.50 |
5.49 |
6.02 |
4.10 |
2.13 |
3.50 |
59.36 |
|
Normal |
4.60 |
4.90 |
4.72 |
3.91 |
4.03 |
3.84 |
4.66 |
3.93 |
3.62 |
3.40 |
4.08 |
4.24 |
49.93 |
|
DFN |
+0.96 |
+6.66 |
+2.30 |
+3.25 |
-1.58 |
-0.97 |
-3.16 |
+1.56 |
+2.40 |
+0.70 |
-1.95 |
-0.74 |
+9.43 |
DeKalb Peachtree Arpt
|
Month |
Jan |
Feb |
Mar |
Apr |
May |
Jun |
Jul |
Aug |
Sep |
Oct |
Nov |
Dec |
Annual |
|
Total |
7.87 |
9.90 |
6.42 |
4.87 |
3.24 |
4.85 |
5.03 |
7.59 |
7.06 |
8.35 |
3.49 |
2.59 |
71.26 |
|
Normal |
4.80 |
5.01 |
4.98 |
3.65 |
4.05 |
4.76 |
5.02 |
4.31 |
4.56 |
3.45 |
4.22 |
4.16 |
52.97 |
|
DFN |
+3.07 |
+4.89 |
+1.44 |
+1.22 |
-0.81 |
+0.09 |
+0.01 |
+3.28 |
+2.50 |
+4.90 |
-0.73 |
-1.57 |
+18.29 |
Fulton Co. Arpt
|
Month |
Jan |
Feb |
Mar |
Apr |
May |
Jun |
Jul |
Aug |
Sep |
Oct |
Nov |
Dec |
Annual |
|
Total |
7.82 |
9.79 |
6.60 |
5.05 |
1.71 |
3.39 |
2.96 |
8.29 |
6.11 |
8.99 |
2.75 |
2.51 |
65.97 |
|
Normal |
4.27 |
4.90 |
4.81 |
3.74 |
3.77 |
4.13 |
5.06 |
4.74 |
3.98 |
3.61 |
4.17 |
3.99 |
51.17 |
|
DFN |
+3.55 |
+4.89 |
+1.79 |
+1.31 |
-2.06 |
-0.74 |
-2.10 |
+3.55 |
2.13 |
+5.38 |
-1.42 |
-1.48 |
+14.80 |
Gainesville
|
Month |
Jan |
Feb |
Mar |
Apr |
May |
Jun |
Jul |
Aug |
Sep |
Oct |
Nov |
Dec |
Annual |
|
Total |
7.52 |
10.84 |
6.41 |
5.29 |
4.94 |
5.15 |
4.13 |
5.59 |
7.19 |
7.76 |
2.89 |
3.39 |
71.10 |
|
Normal |
5.03 |
4.87 |
5.42 |
3.56 |
4.04 |
4.39 |
4.51 |
4.43 |
4.68 |
4.08 |
4.47 |
4.50 |
53.98 |
|
DFN |
+2.49 |
+5.97 |
+0.99 |
+1.73 |
+0.90 |
+0.76 |
-0.38 |
+1.16 |
+2.51 |
+3.68 |
-1.58 |
-1.11 |
+17.12 |
Peachtree City
|
Month |
Jan |
Feb |
Mar |
Apr |
May |
Jun |
Jul |
Aug |
Sep |
Oct |
Nov |
Dec |
Annual |
|
Total |
8.03 |
11.57 |
6.63 |
3.72 |
2.55 |
2.92 |
3.22 |
8.56 |
6.43 |
4.70 |
3.31 |
2.58 |
64.22 |
|
Normal |
4.20 |
4.90 |
5.11 |
3.92 |
3.39 |
3.63 |
5.26 |
4.32 |
3.84 |
3.41 |
3.87 |
4.14 |
49.99 |
|
DFN |
+3.83 |
+6.67 |
+1.52 |
-0.20 |
-0.84 |
-0.71 |
-2.04 |
+4.24 |
+2.59 |
+1.29 |
-0.56 |
-1.56 |
+14.23 |
Rome
|
Month |
Jan |
Feb |
Mar |
Apr |
May |
Jun |
Jul |
Aug |
Sep |
Oct |
Nov |
Dec |
Annual |
|
Total |
4.94 |
11.16 |
6.36 |
6.72 |
2.65 |
3.46 |
2.42 |
4.62 |
4.02 |
6.80 |
1.66 |
4.10 |
58.91 |
|
Normal |
4.82 |
4.87 |
4.95 |
4.05 |
4.18 |
4.10 |
4.32 |
4.13 |
3.41 |
3.86 |
4.85 |
4.38 |
51.92 |
|
DFN |
+0.12 |
+6.29 |
+1.41 |
+2.67 |
-1.53 |
-0.86 |
-1.71 |
+1.21 |
+0.16 |
+1.95 |
-2.72 |
-0.28 |
+6.99 |
Annual Precip. Extremes (in)
|
Site |
Highest Daily Amount |
|
Athens |
3.60 (9/17*) |
|
Atlanta |
4.55 (10/10*) |
|
Columbus |
5.92 (4/19*) |
|
Macon |
4.41 (4/19*) |
|
Cartersville |
2.62 (2/6*) |
|
DeKalb Peachtree Arpt |
3.77 (10/10*) |
|
Fulton Co. Arpt |
4.26 (10/24*) |
|
Gainesville |
5.51 (10/10) |
|
Peachtree City |
3.43 (2/18*) |
|
Rome |
3.12 (2/6) |
* Set record for a day; Bold = Highest daily amount for that month on record


Annual Snowfall Totals (inches) – (Jan to Dec)
|
Site |
Total |
Normal |
Dep. from Normal |
Records |
|
Athens |
0.5 |
2.9 |
-2.4 |
10.6 (1983) |
|
Atlanta |
T |
2.9 |
-2.9 |
10.5 (1936) |
|
Columbus |
0.0 |
0.4 |
-0.4 |
14.0 (1973) |
|
Macon |
0.0 |
0.7 |
-0.7 |
16.5 (1973) |
2020 Narrative Climate Summary For North and Central Georgia
If I had to only give one word to sum up the beginning of 2020, I would use the word WET. Above average rainfall and flooding concerns crippled many areas in the beginning months of 2020 across north and central Georgia.
January was categorized by above average temperatures and rainfall. Most of our climate sites recorded average temperatures of at least 4 to 7 degrees above average. Several daily records for highest minimum temperature were broken and Macon even broke two highest maximum temperature records when observations recorded a temperature of 81 degrees on the 3rd and 78 degrees on the 15th! For precipitation, most sites recorded 2 to 4 inches above normal. In addition, Columbus experienced its 8th wettest January on record accumulating 7.53 inches of rain. In the midst of the rainfall events, the area experienced severe storms on January 11th. Widespread wind damage occurred—downing numerous trees and power lines—in addition to three weak tornadoes in eastern Paulding/western Cobb, Fannin, and Upson counties. Plus, just three days later on the 14th, two more weak tornadoes occurred in Pike County and Spalding County with a line of storms that crossed the area.
 |
| This store in Bremen sustained major wall damage from the strong straight-line winds on the 11th. (Courtesy WSB-TV) |
 |
|
A tree fell on this home, knocking it off its stilts in Woodbury on the 11th. |
Once we moved into February, temperatures settled back to just above average while the increased rainfall and flooding issues continued. Our climate sites all recorded 5 to 7 inches above average, leading to several broken precipitation records. Athens recorded its 3rd wettest February on record with 11.05 inches of rain, Atlanta had its 2nd wettest February on record with 10.58 inches of rain, Columbus had its 7th wettest February on record with 9.90 inches of rain, and Macon had its 4th wettest February on record with 9.91 inches of rain. The other climate sites recorded fairly similar amounts in the 9- to 12-inch range.
In addition to heavy rain, February also brought severe storms. On the 6th, the Storm Prediction Center had an Enhanced Risk issued for the area. As these storms came through, numerous tornado and severe thunderstorm warnings were issued. A weak tornado was confirmed along the Bartow/Gordon county line, with multiple trees and power lines down elsewhere. Heavy rain was also an issue with this event and periods of moderate to heavy rain led to multiple climate sites breaking their all-time records for daily rainfall in February on the 6th. (Cartersville recorded 2.62 inches, DeKalb Peachtree Airport recorded 2.58 inches, Fulton County Airport recorded 2.49 inches, and Gainesville recorded 3.54 inches). All of the rain led to numerous flooding issues, leaving multiple counties’ schools closed due to issues with roadways.
Although temperatures in February were overall slightly above average, some sites recorded a snowstorm in early February with two more snow events across the northern mountains towards the end of February. In the early morning hours of the 8th, a quick moving upper-level disturbance produced precipitation across parts of northern Georgia, leaving anywhere from a dusting of snow across portions of the northern metro to 6 to 7 inches of snow across the north Georgia mountains.
 |
| Several inches of snow accumulated in the Maysville area. (courtesy Ken Cook) |
 |
| Snow accumulated across the northern Atlanta suburbs, including here at the Chattahoochee River in Roswell. (courtesy Dianne Boss) |
As we transitioned into spring, temperatures through the month of March were well above average—nearly 5 to 8 degrees above normal. With such high temperatures, many daily and monthly records were broken across the area. Athens and Atlanta both experienced their 3rd warmest March on record, with Macon experiencing its 5th warmest March on record, and Columbus experiencing its 6th warmest March on record. Throughout the month of March, 17 daily temperature records were broken at Atlanta, Athens, Columbus, and Macon with 5 of these being daily high temperature records and the other 12 being highest low temperature records. Most notably, Athens set an all-time March record for highest minimum temperature: 65 degrees on the 29th, which broke the previous record of 62 degrees last set in 1977. Otherwise, few notable weather events occurred in March and precipitation overall was only around 1 to 2 inches above normal.
The month of April brought temperatures just around normal with a few sites just a degree or so below average. Precipitation through the month was around 1 to 3 inches above normal with Macon recording its wettest April on record and Columbus recording its 5th wettest April on record. A powerful storm system led to an outbreak of severe storms Easter morning across the South, bringing tornadoes and strong thunderstorm winds to north and central Georgia that evening and the following day. A total of 21 tornadoes were confirmed across north and central Georgia from April 12th through 13th, including two EF-3 tornadoes. Strong winds and tornadoes damaged buildings and downed numerous trees and power lines. Then, on April 19th heavy precipitation moved through the area with rainfall totals around 3 to 7 inches across portions of north and central Georgia. This same day, both Macon and Columbus broke daily precipitation records. Macon recorded 4.41 inches of rain, breaking the old record of 1.73 inches last set in 1940. Columbus recorded 5.92 inches of rain, breaking the old record of 2.12 inches last set in 1944. This record also became the new all-time highest daily precipitation in the month of April for Columbus.
 |
 |
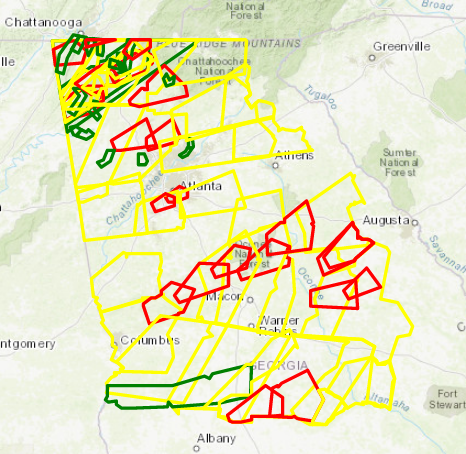
| These two maps show all of the warnings issued on April 12-13th, 2020 (1) and local storm reports (LSRs) issued from the event (2) across north and central Georgia. | |
May, June, and July were relatively quiet compared to the preceding months. Overall, no major weather events occurred and daily summertime convective activity was typical. As far as climate, May saw no clear trend in precipitation, but temperatures were overall about 0 to 3 degrees below normal. June was relatively similar to May as far as temperatures go, averaging around a degree or so below normal. Precipitation, on the other hand, was overall around 0 to 1.5 inches below normal. Over the month of July, temperatures trended back above average with all sites seeing temperatures around 0 to 2 degrees above average. Precipitation continued below normal with all of our climate sites receiving around 0 to 2.5 inches below normal rainfall.
The month of August was characterized by temperatures 0 to 2 degrees above average, precipitation totals around 1 to 4 inches above average, and daily typical summertime thunderstorms. While there were no large severe weather outbreaks, 13 warnings were issued on August 3rd during typical summertime afternoon and evening storms. These storms brought periods of heavy rainfall in addition to hail across the area. Several reports of tennis ball-sized hail were received and gusty winds within thunderstorms downed many trees and powerlines.
 |
| Numerous severe thunderstorm warnings were issued on August 3rd, with several reports of hail across the area. |
Temperatures through the month of September were just around seasonal norms, but precipitation totals were generally around 2 to 4 inches above normal. This was in part due to the passage of the remnants of Hurricane Sally, the most notable event to occur across north and central Georgia in the month of September. The remnants of Hurricane Sally crossed portions of north and central Georgia on September 16th and 17th, bringing wind gusts of 35 to 40 mph and widespread heavy rain. 3 to 6 inches of rainfall fell with some localized amounts of 7 to 8 inches, leading to plenty of flash flooding in addition to river flooding lasting well beyond the actual event. In addition, Atlanta (2.79 inches on the 17th), Athens (3.60 inches on the 17th), Columbus (3.72 inches on the 16th), and Macon (2.90 inches on the 16th and 4.25 inches on the 17th) all broke daily precipitation records. With saturated soils across the area due to heavy rainfall and heavy winds, trees and power lines were still downed with the remnants of Sally.
 |
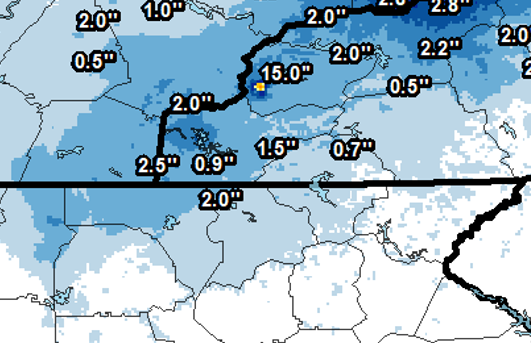
| This map shows the storm total rainfall from the remnants of Hurricane Sally across portions of north and central Georgia. |
The busy 2020 tropical season continued into October, with two tropical systems impacting portions of north and central Georgia. The remnants of Hurricane Delta impacted portions of north and central Georgia on October 10th through 11th. Multiple weak tornadoes were reported across the area, damaging several buildings and downing numerous trees and power lines. Delta also brought periods of heavy rain across metro Atlanta and northeast Georgia, leading to washed out roads, localized flooding issues, and plenty of river flooding. Atlanta even broke a daily precipitation record, measuring 4.55 inches of rain on the 10th, breaking the previous daily record of 3.42 inches last set in 2018. Towards the end of the month, on October 29th, Tropical Storm Zeta crossed portions of west central and northern Georgia bringing sustained winds of 20 to 35 mph with widespread gusts of 40 to 60 mph, and some isolated gusts over 60 mph. These winds downed additional trees and powerlines, leading to widespread power outages. In addition to strong winds, portions of northern Georgia received 1.5 to 4 inches of rainfall leading to issues with localized flooding. In regards to temperatures and precipitation, temperatures ran about 2 to 5 degrees above average with rainfall around 1 to 4 inches above normal as well. With a few high daily rainfall totals, Atlanta recorded its 3rd wettest October on record, and Athens and Atlanta experienced their 7th and 8th warmest October on record, respectively.
 |
| This map shows the storm total rainfall from the remnants of Hurricane Delta across portions of north and central Georgia. |
 |
| This map shows the wind gusts brought to the area by Tropical Storm Zeta. |
Overall, November was a record-breaking month for temperatures! Our climate sites were around 3 to 5 degrees warmer than normal and about 0 to 2 inches below normal in terms of precipitation. These warm and mostly dry conditions led to Athens and Macon experiencing their 3rd warmest November on record. Atlanta experienced its 4th warmest November on record, and Columbus experienced its 6th warmest November on record. In addition, 16 temperature records were broken or tied in November with 13 highest minimum temperature records set! Athens, Atlanta, Columbus, and Macon all established new records for the highest minimum temperature in the month of November on record (70 degrees for Atlanta, Athens, and Columbus; 71 degrees for Macon). While the month was mostly quiet overall in terms of precipitation and inclement weather, we did have the first season snow across portions of northern Georgia on November 30th. Snowfall up to 2 inches was reported across the higher elevations of the mountains in northeast Georgia with flurries reported across portions of northern Georgia, including Atlanta-Hartsfield Jackson International Airport.
 |
| Flurries up to 2 inches of snow accumulated across the higher elevations of north Georgia. (map courtesy of NWS GSP) |
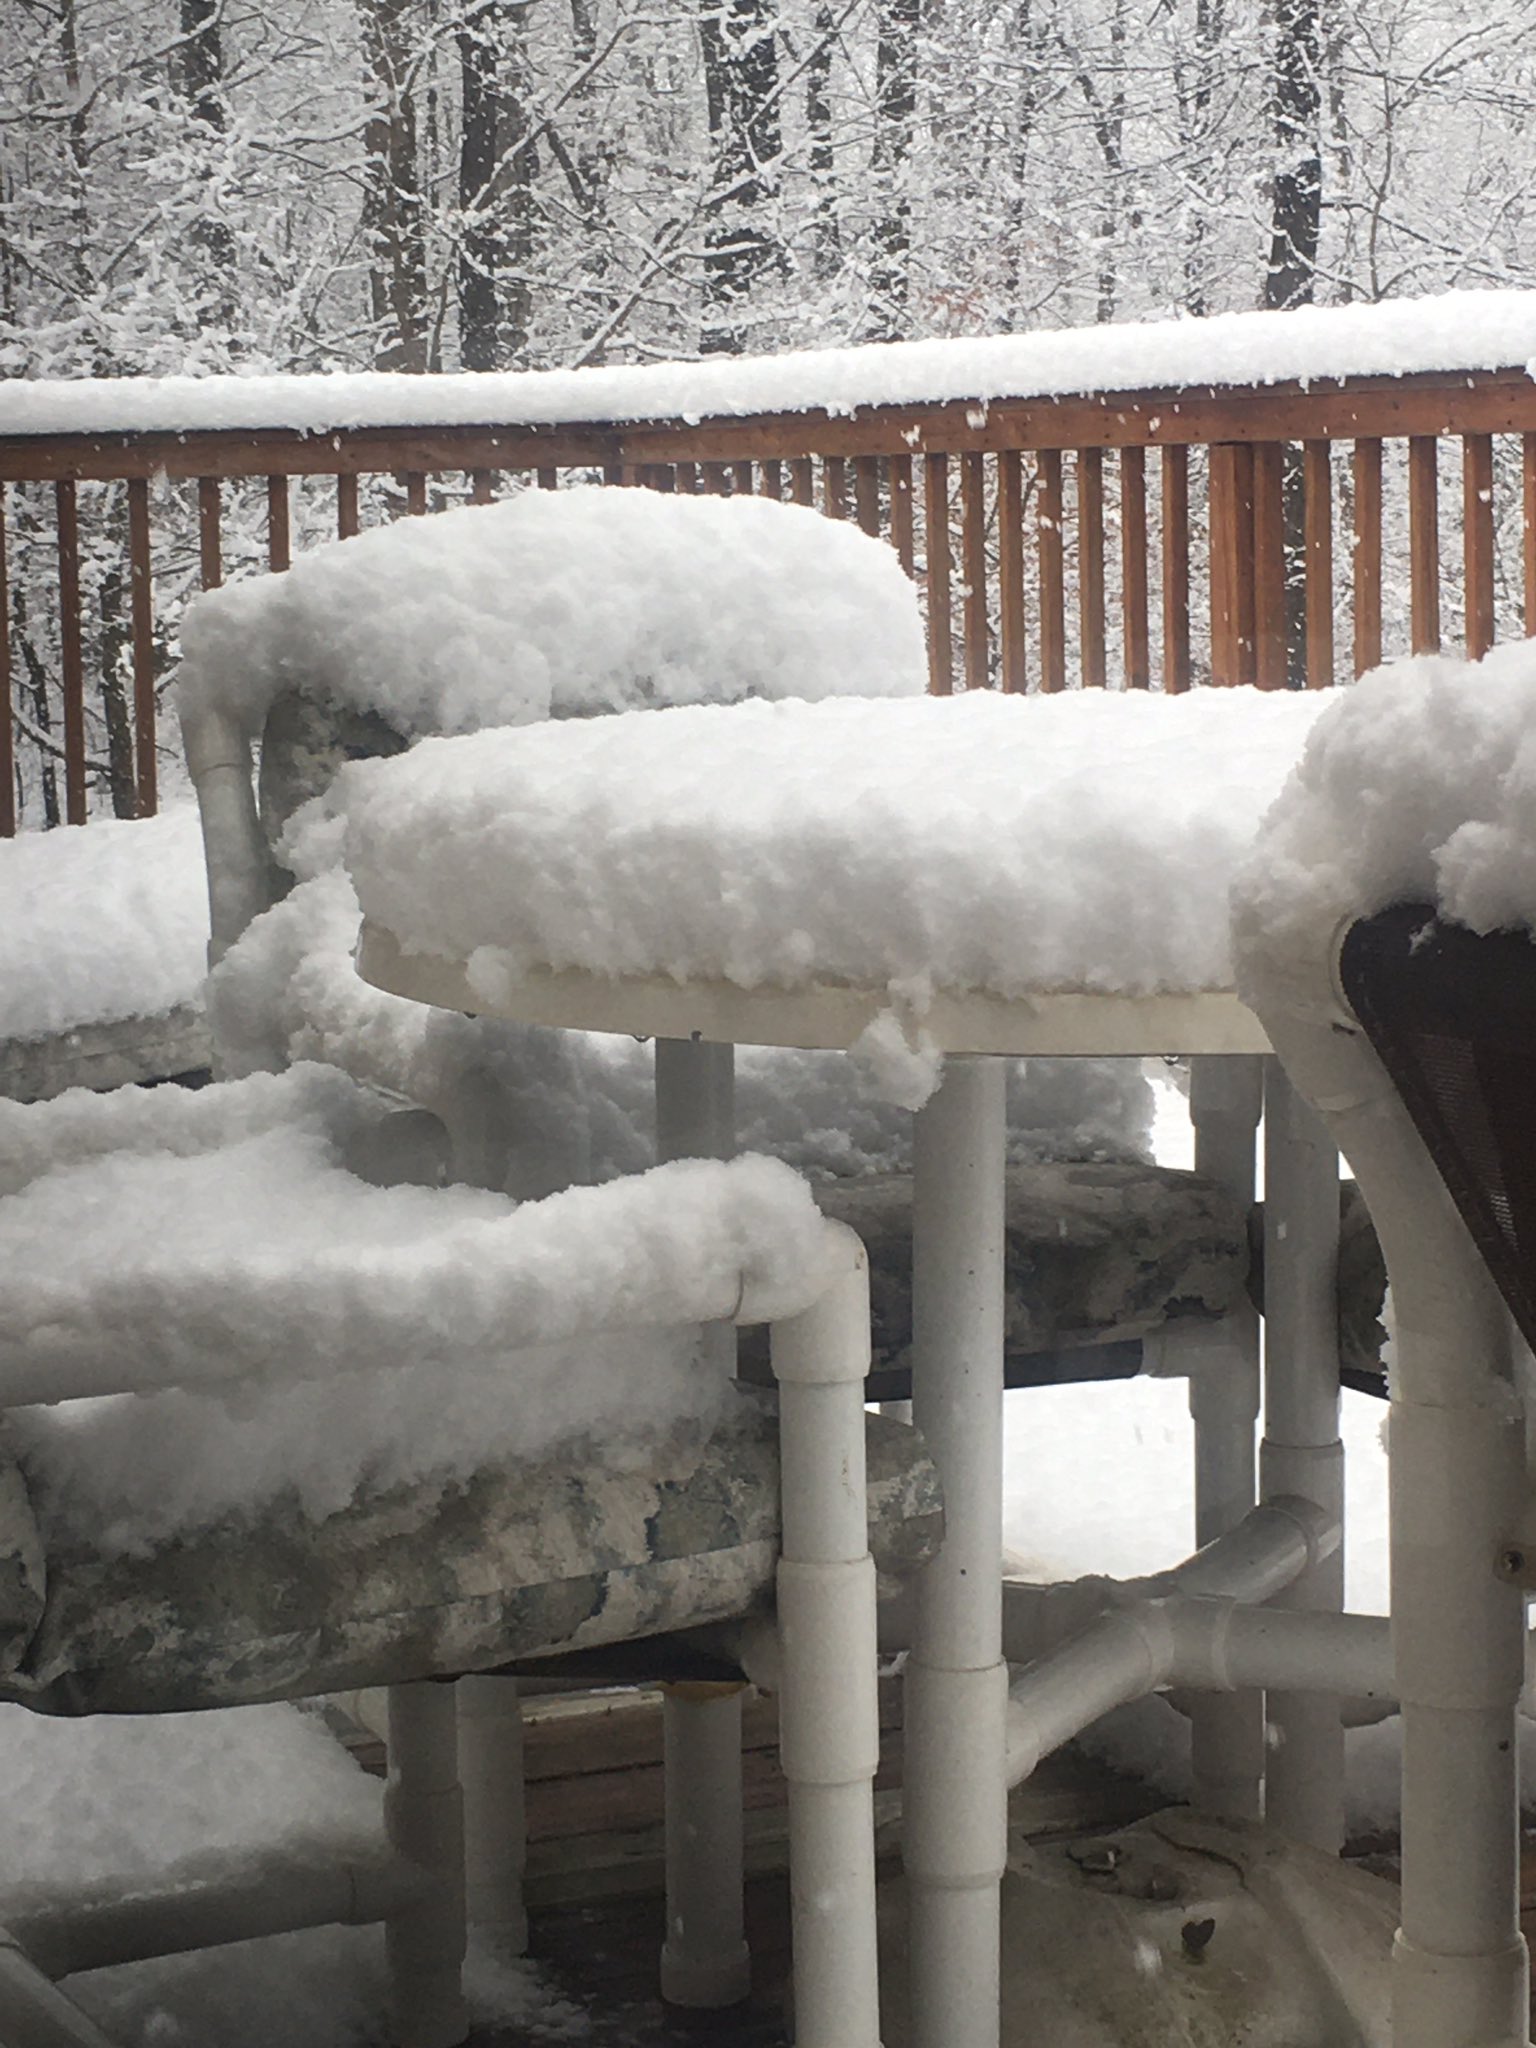
December was an overall quiet month with temperatures just around seasonal norms and slightly below normal precipitation. Most sites across the area were around 0 to 2 degrees below average. The most notable event through the month of December was on Christmas Eve when a system brought rain and wintry precipitation to north and central Georgia. Most sites recorded their highest daily precipitation for the month on Christmas Eve as well. For snowfall, flurries were reported as far south as Atlanta-Hartsfield Jackson International Airport with locations across northern Georgia seeing a dusting up to 3 inches across Union County. Temperatures continued to drop after this system passed, resulting in some of the coldest temperatures of the month on the 26th, with lows across the area in the upper teens and lower 20s.
 |
| Hiawassee reported several inches of snow on Christmas Eve. |
Overall, 2020 was definitely a year for the books! For temperatures, Athens, Atlanta, and Macon all experienced top 10 warmest years on record: 3rd warmest on record at Athens, 6th warmest on record at Atlanta, and 3rd warmest [tied] at Macon. For precipitation, Athens, Atlanta, Columbus, and Macon all experienced top 10 wettest years on record: 9th wettest on record at Athens, 6th wettest on record at Atlanta, 5th wettest on record at Columbus, and 8th wettest on record at Macon.
Data prepared by the Atlanta Forecast Office. Normals values provided are from the 1981-2010 period. Maps from the NOAA RCCs and the MRCC.

