National Weather Service United States Department of Commerce
     RRS FIELD SUPPORT    |  RRS                |  EHB #9 Part 1-7       |  MIRS
   MON-FRI:   10Z - 02Z   |  RRS User Guide     |  Archive Verification  |  E-FORMS 
   MAIN:   703-661-1268   |  Directive 10-1401  |  Network Data Quality  |  B29  B85  H6
   BACKUP: 703-661-1293   |  (Rawinsonde Obs)   |                        | 
For the old UA page, See:  https://www.weather.gov/dvn/UA_OLD
 
DVN SKEWT WUNDERGROUND DVN VAD WINDS
COD DVN SKEWT  
 
 
    National Maps    
  (SPC National Mesoscale Analysis Page)  
         
300mb 500mb 700mb 850mb 925mb
300mb Height - Divergence - Wind 500mb Height - Temperature - Wind 700mb Height - Wind - Temperature 850mb Height - Temperature - Dew point - Wind 925mb Height - Temperature - Dew point - Wind
         
    Midwest Sector    
  (SPC Midwest Mesoscale Analysis Page)  
         
300mb 500mb 700mb 850mb 925mb


 OB       RELEASE         OB        RELEASE 
TIME    TIME WINDOW      TIME    TIME WINDOW

 00Z    2300Z-0029Z       12Z    1100Z-1229Z
 01Z    0030Z-0129Z       13Z    1230Z-1329Z
 02Z    0130Z-0229Z       14Z    1330Z-1429Z
 03Z    0230Z-0329Z       15Z    1430Z-1529Z
 04Z    0330Z-0429Z       16Z    1530Z-1629Z
 05Z    0430Z-0459Z       17Z    1630Z-1659Z
 06Z    0500Z-0629Z       18Z    1700Z-1829Z
 07Z    0630Z-0729Z       19Z    1830Z-1929Z
 08Z    0730Z-0829Z       20Z    1930Z-2029Z
 09Z    0830Z-0929Z       21Z    2030Z-2129Z
 10Z    0930Z-1029Z       22Z    2130Z-2229Z
 11Z    1030Z-1059Z       23Z    2230Z-2259Z


          Frequency Selection Chart        

___________________________________________
|        ||       |       |       |       |
|        ||  1676 |  1678 |  1680 |  1682 |
|--------||=======|=======|=======|=======|
| White  || UNCUT | UNCUT |  CUT  |  CUT  |
|--------||-------|-------|-------|-------|
| Black  || UNCUT |  CUT  | UNCUT |  CUT  |
|--------||-------|-------|-------|-------|
| Dip    ||  OOOO |  OO O |  OOO  |  OO   |
| Switch ||       |    O  |     O |    OO |
|--------||-------|-------|-------|-------|


Radiosonde CDU & RWS Signal Strength
                             
BASELINE:           0 to  -48
                             
AFTER RELEASE:    -49 to  -69
                             
FLIGHT:           -70 to -111
                             
SUSPEND:         -112 to -130


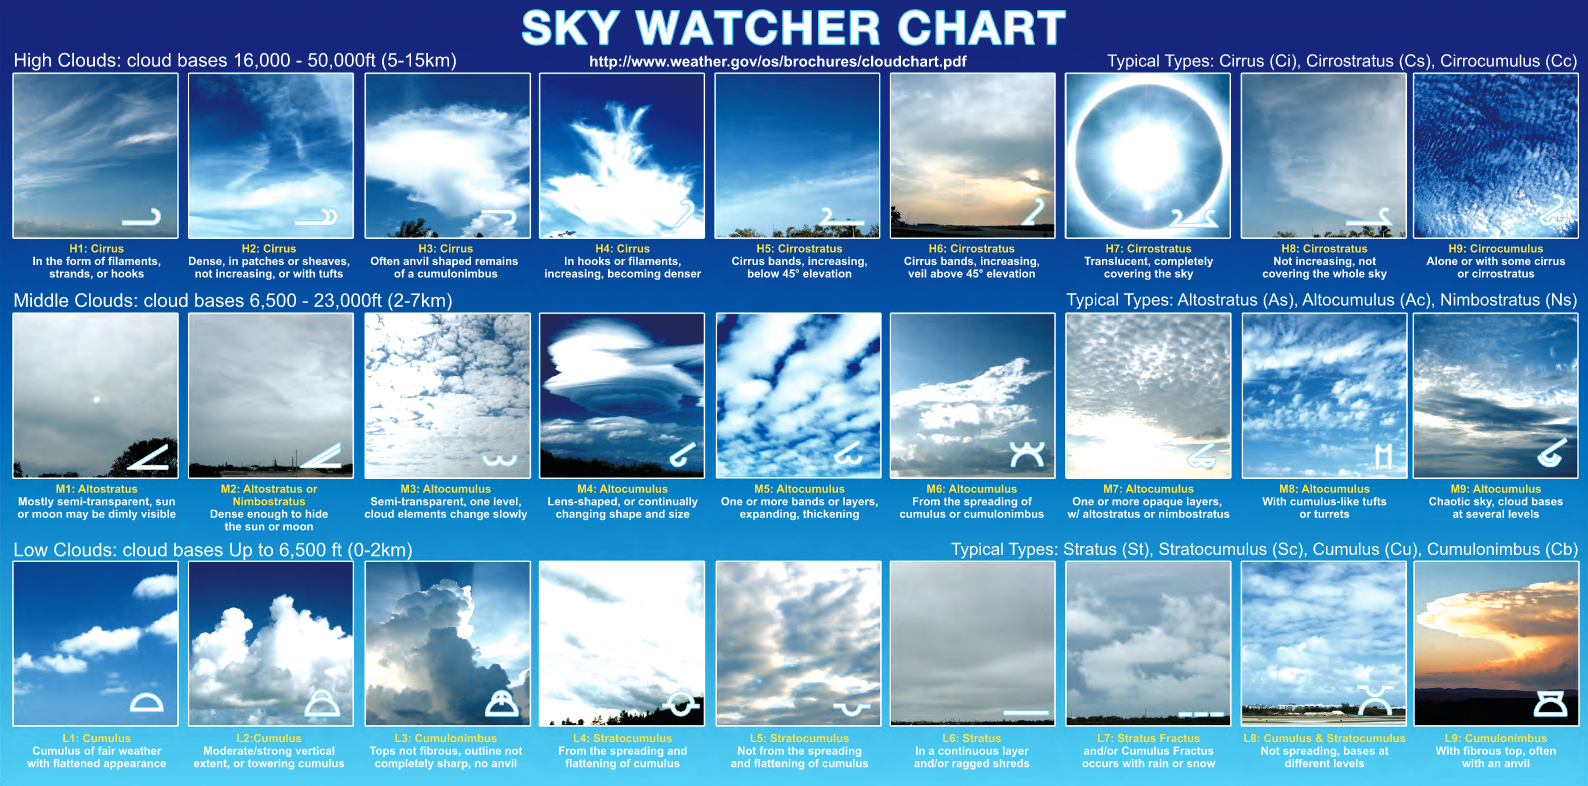
CLOUDS AND WEATHER CODES TABLE
(Click on the code number for more cloud type examples.  Click on the underlined text for an image.)
 
Nh
CL
H
CM
CH
 Code   Clouds (x/10)

   0    0 
   1    <=1/10 (1/8) 
   2    2/10-3/10 (2/8) 
   3    4/10 (3/8) 
   4    5/10 (4/8) 
   5    6/10 (5/8) 
   6    7/10-8/10 (6/8) 
   7    >= 9/10 (7/8) 
   8    10/10 (8/8) 
   9    Sky obscrd by 
         fog/wx 
   /    Clouds can't be 
        seen, NOT due
        to fog / wx 
 Code   Coding Criteria

   9    CB / CB w/ anvil is present
   3    CB not fibrous / w/out anvil
   4    SC formed by spreading of CU 
   8    CU & SC w/ diff. bases
   2    TCU / mod. CU present
   1    CU w/ little vert. extent
   5    SC
   6    ST
   7    STFRA / CUFRA
   0    No clouds
   /    Low clouds obscured
        by fog/other phenom   
 Code  Height (ft)  

   0   0-100 
   1   200-300 
   2   400-600 
   3   700-900 
   4   1000-1900 
   5   2000-3200 
   6   3300-4900 
   7   5000-6500 
   8   7000-8000   
   9   >=8500 or
       no clouds 
   /   Unknown 
 Code   Coding Criteria

   9    AC w/ chaotic sky
   8    ACCAS
   7    AC w/ NS/AS OR AC
         opaque / 1/more levels
   6    AC from spreading CU/CB
   5    AC progressively
         invading sky
   4    AC changing in appearance
   3    AC semi-trans. @ 1 level
   2    No AC but opaque NS / AS
   1    No AC but semi-trans. NS/AS
   0    No mid clouds
   /    Mid clouds not visible 
 Code   Coding Criteria

   9    CC alone / w/ CI / CS
   7    CS covers whole sky
   8    CS not covering the whole sky 
   6    CS invading sky >=45°
          above horizon
   5    CS invading sky <45°
          above horizon
   4    CI invading sky
   3    Dense CI from a CB
   2    Dense CI
   1    CI
   0    No high clouds
   /    High clouds not visible 
 
 
SELECT CODES IN ORDER OF PRIORITY (TOP TO BOTTOM) STARTING IN THE LEFT COLUMN.
 
Code Associated Weather                               

 99  Severe thunderstorm with hail
 98  Thunderstorm with duststorm
 97  Severe thunderstorm with no hail
 96  Thunderstorm with hail
 95  Thunderstorm, no hail but rain and/or snow
 94  Thunderstorm previous hour; S, S+, RS, R+S+ @ ob
 93  Thunderstorm previous hour; S-, R-S-, @ ob
 92  Thunderstorm previous hour; R or R+ @ ob
 91  Thunderstorm previous hour; R- @ ob
 90  Moderate / heavy shower of hail, not with thunder
 89  NOT USED
 88  SPW or SPW+
 87  SPW-
 86  SW or SW+
 85  SW-
 84  Moderate / heavy shower of mixed rain & snow
 83  RW-SW-
 82  Violent RW (rainfall rates of 1 inch/hour)
 81  RW or RW+
 80  RW-
 79  Ice Pellets (any intensity)
 78  Snow crystals
 77  Snow grains
 76  Ice crystals
 75  Continuous S+
 74  Intermittent S+
 73  Continuous S
 72  Intermittent S
 71  Continuous S-
 70  Intermittent S-
 69  R or L mixed with S moderate / heavy
 68  R or L mixed with S light
 67  ZR or ZR+
 66  ZR-
 65  Continuous R+
 64  Intermittent R+
 63  Continuous R
 62  Intermittent R
 61  Continuous R-
 60  Intermittent R-
 59  Drizzle and rain, moderate / heavy
 58  Drizzle and rain, light
 57  ZL or ZL+
 56  ZL-
 55  Continuous L+
 54  Intermittent L+
 53  Continuous L
 52  Intermittent L
 51  Continuous L-
 50  Intermittent L-
          
Code Associated Weather                                    

*17* Thunderstorm, but no precipitation at ob time
 49  Fog depositing rime, sky invisible
 48  Fog depositing rime, sky visible
 47  F or IF, sky invisible, thicker in past hour
 46  F or IF, sky visible, thicker in past hour
 45  F or IF, sky invisible, no change in past hour
 44  F or IF, sky visible, no change in past hour
 43  F or IF, sky invisible, thinner in past hour
 42  F or IF, sky visible, thinner in past hour
 41  F or IF in patches, thicker in past hour
 40  F or IF at a distance, not at station
 39  Blowing Snow with visibility less than 5/16 mile
 38  Blowing Snow with visibility 5/16 to 6 miles
 37  NOT USED
 36  Drifting snow, below eye level
 35  Severe dust or sandstorm begun or increasing
 34  Severe dust or sandstorm no change past hour
 33  Severe dust or sandstorm decreased past hour
 32  Light / moderate dust or sandstorm begun or increasing
 31  Light / moderate dust or sandstorm no change past hour
 30  Light / moderate dust or sandstorm decreased past hour
 29  Thunderstorm not at ob, but in previous hour
 28  Fog or Ice Fog not at ob, but in previous hour
 27  IPW, A, or mixed with RW in previous hour
 26  Showers of S or RS in previous hour
 25  Showers or R not at ob, but in previous hour
 24  ZL or ZR not at ob, but in previous hour
 23  RS or IP (not showers) in previous hour
 22  Snow (not SW) not at ob, but in previous hour
 21  Rain (not RW) not at ob, but in previous hour
 20  L or SG (not showers) in previous hour
 19  Funnel cloud or Tornado near site in past hour
 18  Wind squalls near site in past hour
 17  (SEE TOP OF THIS COLUMN)
 16  Virga, not at site, but within 3 miles
 15  Virga, not at site, but greater than 3 miles
 14  Virga over the ob site
 13  Lightning visible, but no thunder heard
 12  Continuous area of GF, visibility < 5/8 mile
 11  Patches of ground fog, visibility < 5/8 mile
 10  Mist (Fog with visibility greater than 5/8 mile)
 09  Dust or sandstorm at ob or in previous hour
 08  Dust Devil
 07  Loose dust or sand raised by wind
 06  Dust suspended in air, not windblown
 05  Haze (any visibility)
 04  Visibility 6 miles or less due to smoke
 03  Clouds forming or developing
 02  State of sky unchanged
 01  Clouds dissolving or less developed
 00  Clouds not observed or observable


                    CELSIUS TO FAHRENHEIT CONVERSION TABLE

  F   C   F  ||  F    C    F ||  F    C    F  ||   F    C    F  ||   C    F
-------------||--------------||---------------||----------------||-----------
 32 -0.0+ 32 || 14 -10.0+ 50 ||  -4 -20.0+ 68 || -22 -30.0+  86 || 40.0+ 104
 30 -1.0+ 34 || 12 -11.0+ 52 ||  -6 -21.0+ 70 || -24 -31.0+  88 || 41.0+ 106
 28 -2.0+ 36 || 10 -12.0+ 54 ||  -8 -22.0+ 72 || -26 -32.0+  90 || 42.0+ 108
 27 -3.0+ 37 ||  9 -13.0+ 55 ||  -9 -23.0+ 73 || -27 -33.0+  91 || 43.0+ 109
 25 -4.0+ 39 ||  7 -14.0+ 57 || -11 -24.0+ 75 || -29 -34.0+  93 || 44.0+ 111
 23 -5.0+ 41 ||  5 -15.0+ 59 || -13 -25.0+ 77 || -31 -35.0+  95 || 45.0+ 113 
 21 -6.0+ 43 ||  3 -16.0+ 61 || -15 -26.0+ 79 || -33 -36.0+  97 ||          
 19 -7.0+ 45 ||  1 -17.0+ 63 || -17 -27.0+ 81 || -35 -37.0+  99 ||          
 18 -8.0+ 46 ||  0 -18.0+ 64 || -18 -28.0+ 82 || -36 -38.0+ 100 ||          
 16 -9.0+ 48 || -2 -19.0+ 66 || -20 -29.0+ 84 || -38 -39.0+ 102 ||          


                    FAHRENHEIT TO CELSIUS CONVERSION TABLE

  F   C   F  ||  F    C    F ||  F    C    F  ||   F    C    F  ||   C    F  
-------------||--------------||---------------||----------------||-----------
 32 -0.0+ 32 || 14 -10.0+ 50 ||  -4 -20.0+ 68 || -22 -30.0+  86 || 40.0+ 104 
 31 -0.6+ 33 || 13 -10.6+ 51 ||  -5 -20.6+ 69 || -23 -30.6+  87 || 40.6+ 105 
 30 -1.1+ 34 || 12 -11.1+ 52 ||  -6 -21.1+ 70 || -24 -31.1+  88 || 41.1+ 106 
 29 -1.7+ 35 || 11 -11.7+ 53 ||  -7 -21.7+ 71 || -25 -31.7+  89 || 41.7+ 107 
 28 -2.2+ 36 || 10 -12.2+ 54 ||  -8 -22.2+ 72 || -26 -32.2+  90 || 42.2+ 108 
 27 -2.8+ 37 ||  9 -12.8+ 55 ||  -9 -22.8+ 73 || -27 -32.8+  91 || 42.8+ 109 
 26 -3.3+ 38 ||  8 -13.3+ 56 || -10 -23.3+ 74 || -28 -33.3+  92 || 43.3+ 110 
 25 -3.9+ 39 ||  7 -13.9+ 57 || -11 -23.9+ 75 || -29 -33.9+  93 || 43.9+ 111 
 24 -4.4+ 40 ||  6 -14.4+ 58 || -12 -24.4+ 76 || -30 -34.4+  94 || 44.4+ 112 
 23 -5.0+ 41 ||  5 -15.0+ 59 || -13 -25.0+ 77 || -31 -35.0+  95 || 45.0+ 113 
 22 -5.6+ 42 ||  4 -15.6+ 60 || -14 -25.6+ 78 || -32 -35.6+  96 ||           
 21 -6.1+ 43 ||  3 -16.1+ 61 || -15 -26.1+ 79 || -33 -36.1+  97 ||           
 20 -6.7+ 44 ||  2 -16.7+ 62 || -16 -26.7+ 80 || -34 -36.7+  98 ||           
 19 -7.2+ 45 ||  1 -17.2+ 63 || -17 -27.2+ 81 || -35 -37.2+  99 ||           
 18 -7.8+ 46 ||  0 -17.8+ 64 || -18 -27.8+ 82 || -36 -37.8+ 100 ||           
 17 -8.3+ 47 || -1 -18.3+ 65 || -19 -28.3+ 83 || -37 -38.3+ 101 ||           
 16 -8.9+ 48 || -2 -18.9+ 66 || -20 -28.9+ 84 || -38 -38.9+ 102 ||           
 15 -9.4+ 49 || -3 -19.4+ 67 || -21 -29.4+ 85 || -39 -39.4+ 103 ||           


METERS     FEET   MILES       METERS     FEET   MILES
   100      328     0.1        12000    39370     7.5
   200      656     0.1        12500    41010     7.8
   300      984     0.2        13000    42651     8.1
   400     1312     0.2        13500    44291     8.4
   500     1640     0.3        14000    45932     8.7
  1000     3281     0.6        14500    47572     9.0
  1500     4921     0.9        15000    49213     9.3
  2000     6562     1.2        16000    52493     9.9
  2500     8202     1.6        17000    55774    10.6
  3000     9843     1.9        18000    59055    11.2
  3500    11483     2.2        19000    62336    11.8
  4000    13123     2.5        20000    65617    12.4
  4500    14764     2.8        21000    68898    13.0
  5000    16404     3.1        22000    72178    13.7
  5500    18045     3.4        23000    75459    14.3
  6000    19685     3.7        24000    78740    14.9
  6500    21325     4.0        25000    82021    15.5
  7000    22966     4.3        26000    85302    16.2
  7500    24606     4.7        27000    88583    16.8
  8000    26247     5.0        28000    91864    17.4
  8500    27887     5.3        29000    95144    18.0
  9000    29528     5.6        30000    98425    18.6
  9500    31168     5.9        31000   101706    19.3
 10000    32808     6.2        32000   104987    19.9
 10500    34449     6.5        33000   108268    20.5
 11000    36089     6.8        34000   111549    21.1
 11500    37730     7.1        35000   114829    21.7


Code Table 0421 (WMO-No. 306, Vol II)

101AdAdf - Form of Additional Regional Datat Reported
 
  Code   
 Figure   Definition
---------------------------------------------------------    
   
       00    Not allocated.
   
 01-31:   XX day of month (UTC)
   
 32-39:   Not allocated.
   
 40-59:   Reason for No Report / Incomplete Report
   
       40    Report not filed
       41    Incomplete report; full report to follow
       42    Ground equipment failure
       43    Observation delayed
       44    Power failure
       45    Unfavorable weather conditions
       46    Low maximum altitude (< 600m/1500ft abv ground)
       47    Leaking balloon
       48    Ascent not authorized for this period
       49    Alert
       50    Ascent did not extend above the 400hPa level
       51    Balloon forced down by icing condition
       52    Balloon forced down by precipitation
       53    Atmospheric interference
       54    Local interference
       55    Fading signal*
       56    Weak signal*
       57    Preventive maintenance
       58    Flight equipment failure (transmitter,
                balloon, attachments, etc.)
       59    Any reason not listed above
   
        * Fading signals differ from weak signals in that they 
          are first received satisfactorily, then become 
          increasingly weaker, and finally become too weak for 
          reception, while "weak signals" are weak from the 
          beginning of the ascent.
   
 60-64:   Miscellaneous
   
       60    Unassigned
       61    Unassigned (Aerometeorograph report precedes)
       62    Radiosonde report precedes
       63    Unassigned
       64    Unassigned (Stability Index follows...000isis)
   
 65-69:   Doubtful (and Missing) Data
   
       65    Geopotential(Altitude) and temperature data are
                doubtful between following levels: 0PnPnP'nP'n
       66    Geopotential(Altitude) data are doubtful between
                the following levels: 0PnPnP'nP'n
       67    Temperature data are doubtful between the
                following levels: 0PnPnP'nP'n
       68    Dew point depression is missing for reasons
                other than "motor-boating" between the 
                following levels: 0PnPnP'nP'n (Not used when 
               TnTn is also missing)
       69    Unassigned
   
 70-74:   Not allocated.          
   
  Code   
 Figure   Definition
---------------------------------------------------------    

 75-89:   Corrected Data
   
       75    Unassigned
       76    Unassigned
       77    Unassigned
       78    Corrected tropopause data section follows
       79    Corrected maximum wind section follows
       80    Corrected report for the entire report
                (first* and second* transmissions) precedes
       81    Corrected report of the entire first transmission
                precedes
       82    Corrected report of the entire second transmission
                precedes
       83    Corrected data for mandatory levels** follow
       84    Corrected data for significant levels** follow
       85    Minor error(s) in this report; correction follows
       86    Significant level(s) not included in original report
                follow: //PnPnPn TnTnTanDnDn or PnPnPnTnTn
       87    Corrected data for surface follow
       88    Corrected additional data groups follow:
               101AdfAdf .... etc.
       89    Unassigned
   
 90-99:
   
       90    Extrapolated geopotential data follow: PnPnhnhnhn
               (dndndnfnfn)
       91    Extrapolated data precede *
       92    Unassigned
       93    Unassigned
       94    Average wind for the surface to 5000 ft MSL layer
                and the 5000 to 10000 ft MSL layer follow: ddfff
                ddfff (can be used in the Part A message)
       95    Early transmission of 850 and 500 hPa data and
                stability index follows: 85hhh TTTaDD ddfff 50hhh
                TTTaDD ddfff isis
       96    Early transmission of 850, 700, and 500 hPa data
                and stability index follows: 85hhh TTTaDD ddfff
                70hhh TTTaDD ddfff  50hhh TTTaDD ddfff isis
       97    Early transmission of 500 hPa data and stability
                index follows: 50hhh TTTaDD ddfff isis
       98    Early transmission of 700 hPa data and stability
                index follows: 70hhh TTTaDD ddfff isis
       99    Not to be allocated
   
       Code figure 91 is used only in reports of dropsonde
       observations.
   
       Unless both the stability index and the mean winds are
       missing, the Part A message always contains two special
       101 groups as follows:
   
       10164    Group that identifies stability index.
       10194    Group that identifies the mean winds.
   
       A 5-character group follows the 10164 which contains the
       encoded stability index.  The value that appears in the
       coded message for stability index is interpreted as follows:
   
       Coding Stability Index
   
    Code    Meaning
    Value
   
    00-40    Stability index is 0 to 40
    51-90    Stability index is -1 to -40
       91       RH < 20% at either base or 500 hPa level or
                   calculation failed.
       92       RH is missing at the base level.


Coming Soon


Freezing Level / RADAT Mandatory Levels
   
Significant Levels Above 100 Millibars


THKS Alert Admin Message


Coming Soon