Quad Cities, IA/IL
Weather Forecast Office
| Climate/Almanac Data - Sep Normals - Sep Records | ||||||||||||||||||||||||||||||||||||||||||||||||||||||
| SEPTEMBER | ||||||||||||||||||||||||||||||||||||||||||||||||||||||
|
||||||||||||||||||||||||||||||||||||||||||||||||||||||
| The ranking is listed in parentheses (__) when within the "Top 10". | ||||||||||||||||||||||||||||||||||||||||||||||||||||||
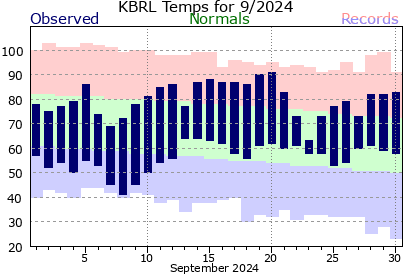
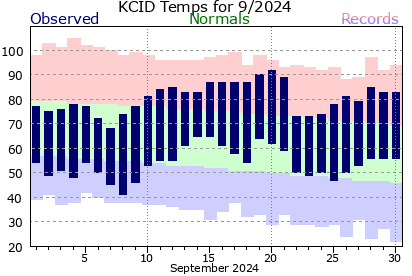
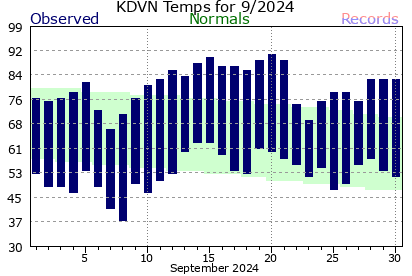
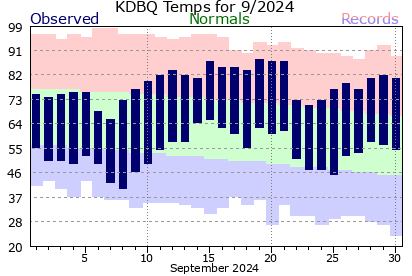
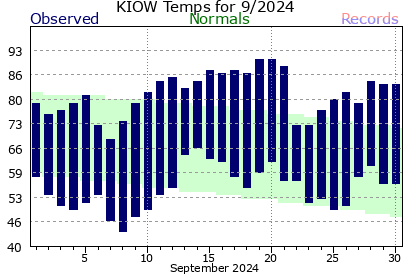
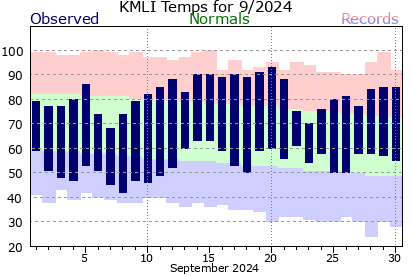
| September 2024 was about 1.5 to 4.5 degrees above normal. | ||||||||||||||||||||||||||||||||||||||||||||||||||||||
| Precipitation totals were about 3 to 3.75" below normal! | ||||||||||||||||||||||||||||||||||||||||||||||||||||||
| Cedar Rapids only saw rain 3 days, with each time only amounting to a trace (not measurable)! It was the driest September ever! | ||||||||||||||||||||||||||||||||||||||||||||||||||||||
| Please see Sep Records for monthly record information. | ||||||||||||||||||||||||||||||||||||||||||||||||||||||
|
||||||||||||||||||||||||||||||||||||||||||||||||||||||
| The climate maps below are courtesy of the Northeast Regional Climate Center | ||||||||||||||||||||||||||||||||||||||||||||||||||||||
| These maps should update to the most recent "last month" on the first of the month. | ||||||||||||||||||||||||||||||||||||||||||||||||||||||
|
|
||||||||||||||||||||||||||||||||||||||||||||||||||||||
|
||||||||||||||||||||||||||||||||||||||||||||||||||||||
| A LOOK AHEAD | ||||||||||||||||||||||||||||||||||||||||||||||||||||||
| Climate Prediction Center | ||||||||||||||||||||||||||||||||||||||||||||||||||||||
|
||||||||||||||||||||||||||||||||||||||||||||||||||||||
Hazardous Weather
Watches, Warnings, & Advisories
Briefing
Hazards Page
View Local Storm Reports
Submit Report
Road Reports
Text Products
Forecasts
Fire Weather
Briefing
Hourly Forecast Graphs
Forecast Discussion
User-Defined Area
Activity Planner
Local Forecasts
Space Weather
Text Products
River Graphs
Airport Forecasts
Snow and Ice Probabilities
Winter Storm Severity Index (WSSI)
Current Conditions
Observations
Radar
Satellite
Rivers and Lakes
River Graphs
Road Reports
Drought Monitor
Text Products
Sunrise/Sunset Tables
Seasons (Equinoxes/Solstices)
Past Weather
Climate Maps
Climate Normals/Averages
Climate Records
Climate/Almanac Data
Recent Observation History
Climate Graphs
Climate Summaries
Observation Site History
Past Events
Text Products
Sunrise/Sunset Tables
US Dept of Commerce
National Oceanic and Atmospheric Administration
National Weather Service
Quad Cities, IA/IL
9040 N Harrison Street
Davenport Municipal Airport
Davenport, IA 52806-7326
563-386-3976
Comments? Questions? Please Contact Us.