| Climate/Almanac Data - August Normals - August Records |
| |
| August |
| |
|
Site
(Click site name for report)
|
Avg
Temp |
Normal
1991-2020 |
Dept
From
Norm |
Precip
Total |
Normal
1991-2020 |
Dept
From
Norm |
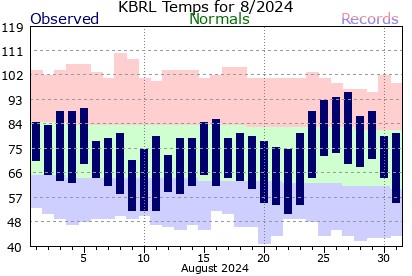
| Burlington |
72.6° |
73.8° |
-1.2° |
2.56" |
3.77" |
-1.21" |
| Cedar Rapids |
71.6° |
70.8° |
+0.8° |
3.27" |
4.07" |
-0.80" |
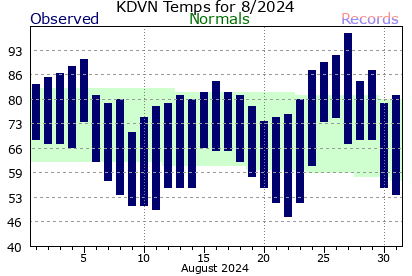
| Davenport |
71.8° |
71.7° |
+0.1° |
4.64" |
3.96" |
+0.68" |
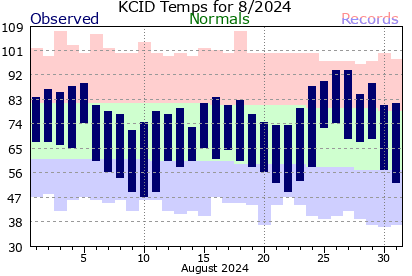
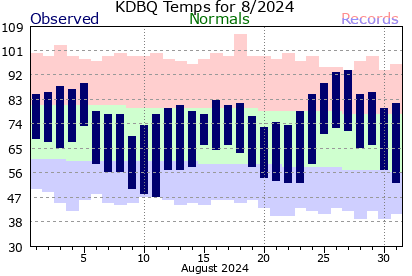
| Dubuque |
71.4° |
69.8° |
+1.6° |
2.73" |
3.95" |
-1.22" |
| Iowa City |
73.5° |
73.5° |
0.0° |
4.29" |
3.94" |
+0.35" |
| Moline |
73.2° |
73.4° |
-0.2° |
4.26" |
3.97" |
+0.29" |
The ranking is listed in parentheses (__) when within the "Top 10".
|
| |
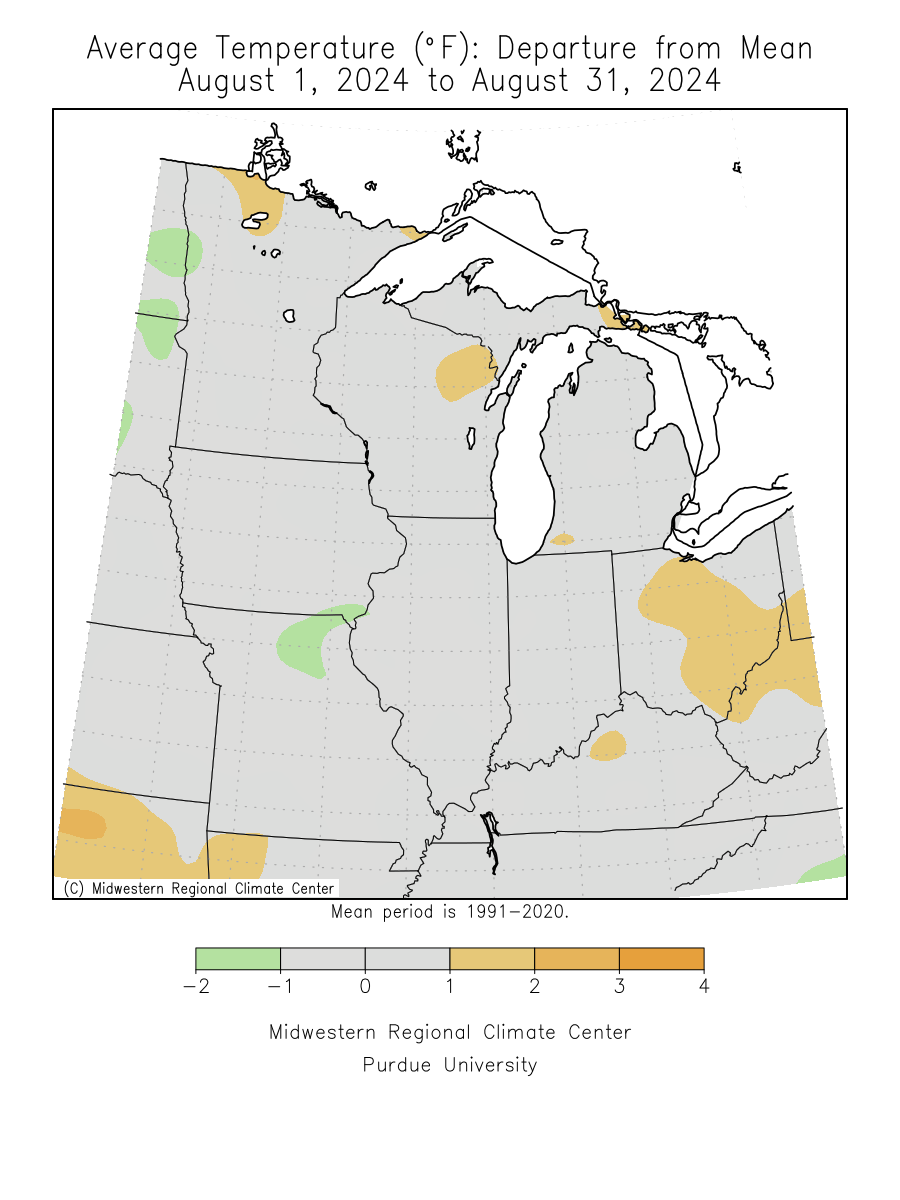
| August 2024 was about 1 degree below normal at Burlington to 1.5 degrees above normal at Dubuque. |
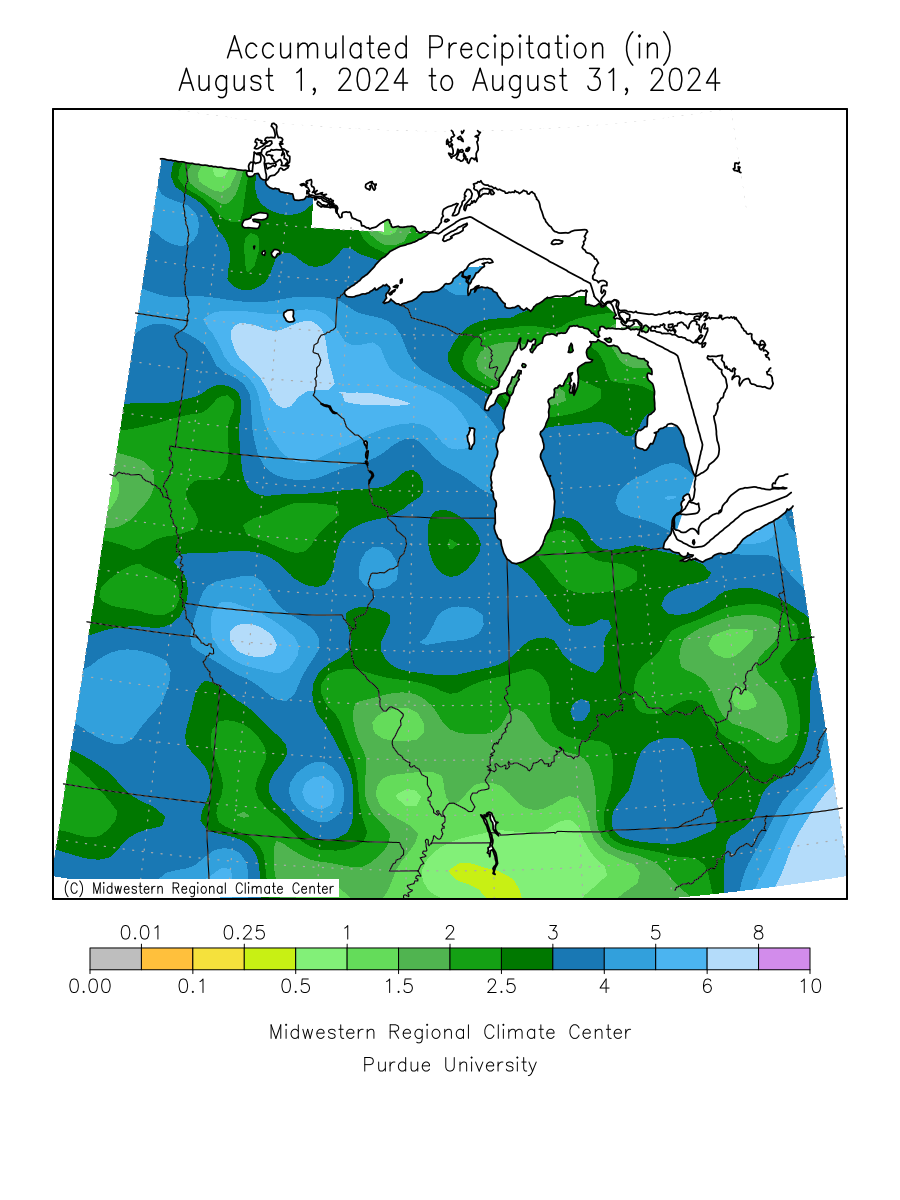
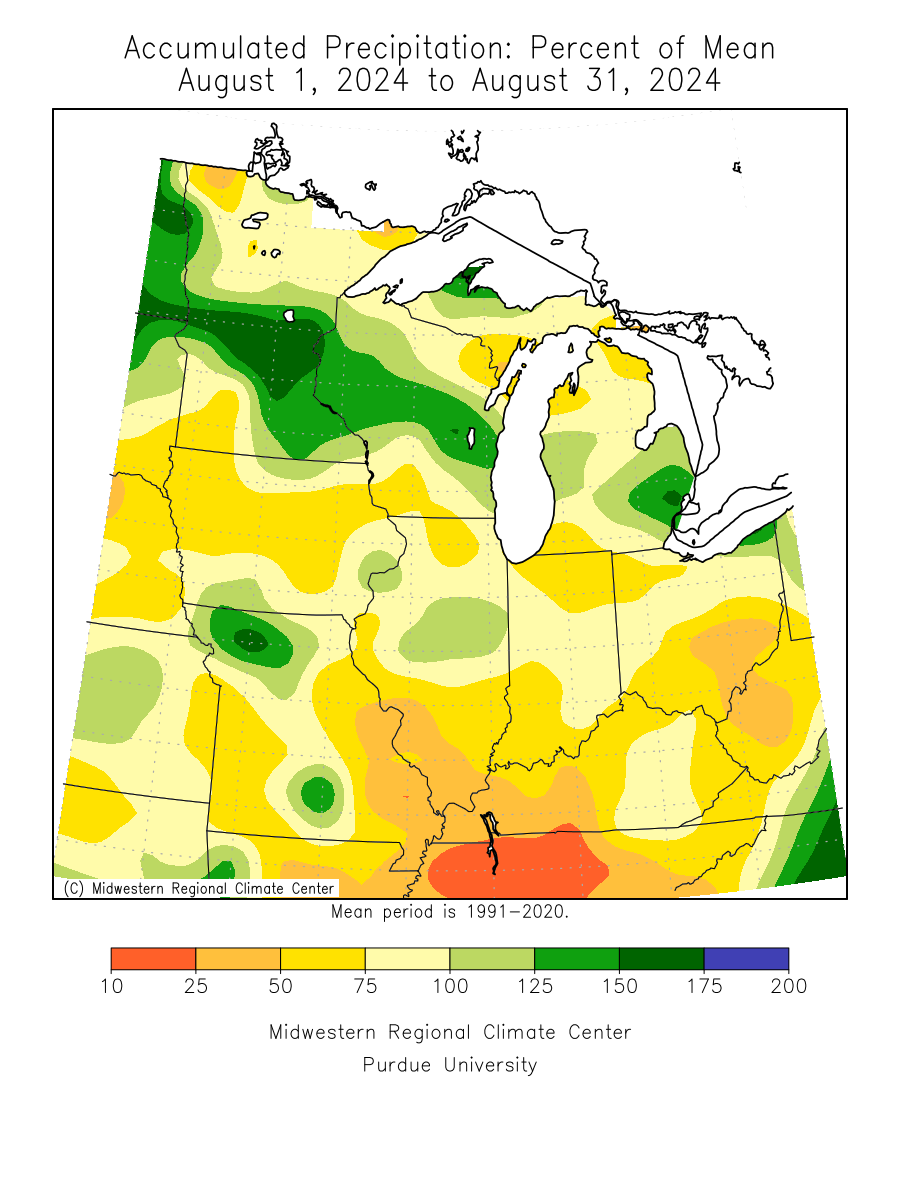
| Precipitation totals varied from near 1.25" below normal at Burlington and Dubuque, to almost 0.75" above normal at Davenport. |
| Please see August Records for monthly record information. |
| |
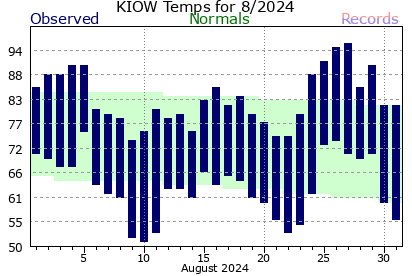
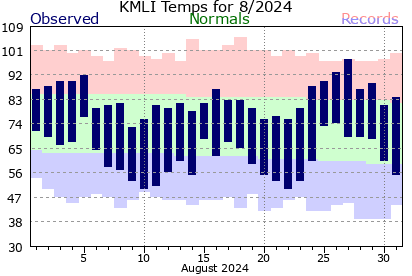
| Burlington |
Cedar Rapids |
Davenport |
Dubuque |
Iowa City |
Moline |
 |
 |
 |
 |
 |
 |
|
| |
| |
| The climate maps below are courtesy of the Midwest Regional Climate Center. |
| These maps become available around 10am on the first of the month. |
| |
Average
Temperature |
Average
Temperature
Departure from Mean |
Accumulated
Precipitation |
Accumulated
Precipitation
Percent of Mean |
 |
 |
 |
 |
|
| |
| |
| |
| |
| Climate/Almanac Data - Summer Normals - Summer Records |
| |
Summer
(Jun-Aug) |
| |
|
Site
(Click site name for report courtesy of the
Iowa Environmental Mesonet.)
|
Average
Temperature |
Normal
1991-2020 |
Departure
From
Normal |
Precipitation
Total |
Normal
1991-2020 |
Departure
From
Normal |
| Burlington |
73.5° |
73.9° |
-0.4° |
13.85" |
12.66" |
+1.19" |
| Cedar Rapids |
72.2° |
71.1° |
+1.1° |
16.22" |
14.04" |
+2.18" |
| Davenport |
72.4° |
72.2° |
+0.2° |
14.70" |
12.76" |
+1.94" |
| Dubuque |
71.3° |
70.0° |
+1.3° |
14.54" |
13.94" |
+0.60" |
| Iowa City |
73.9° |
73.9° |
0.0° |
16.46" |
13.14" |
+3.32" |
| Moline |
73.8° |
73.7° |
+0.1° |
13.15" |
13.21" |
-0.06" |
|
|
The ranking is listed in parentheses (__) when within the "Top 10".
|
| |
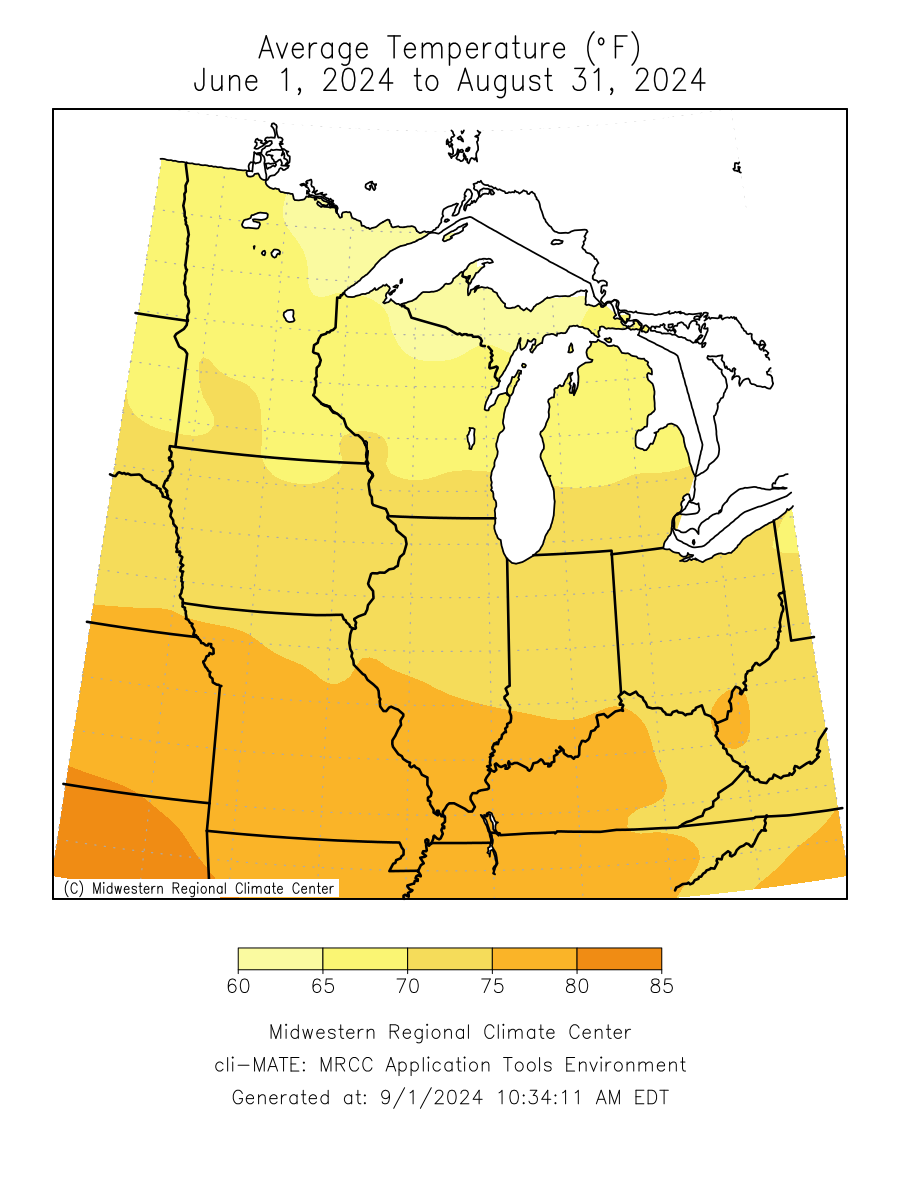
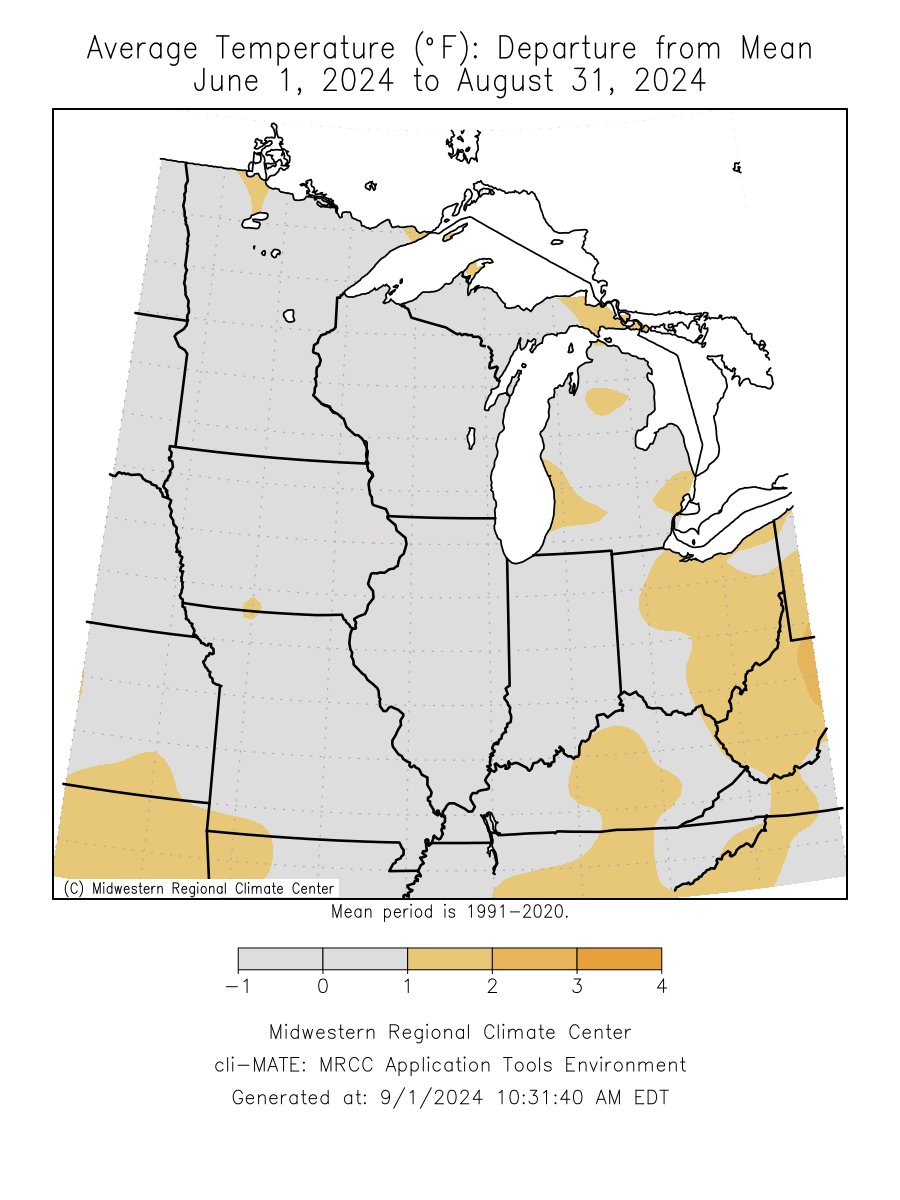
| Summer 2024 was near normal to about 1.5 degrees above normal at Dubuque. |
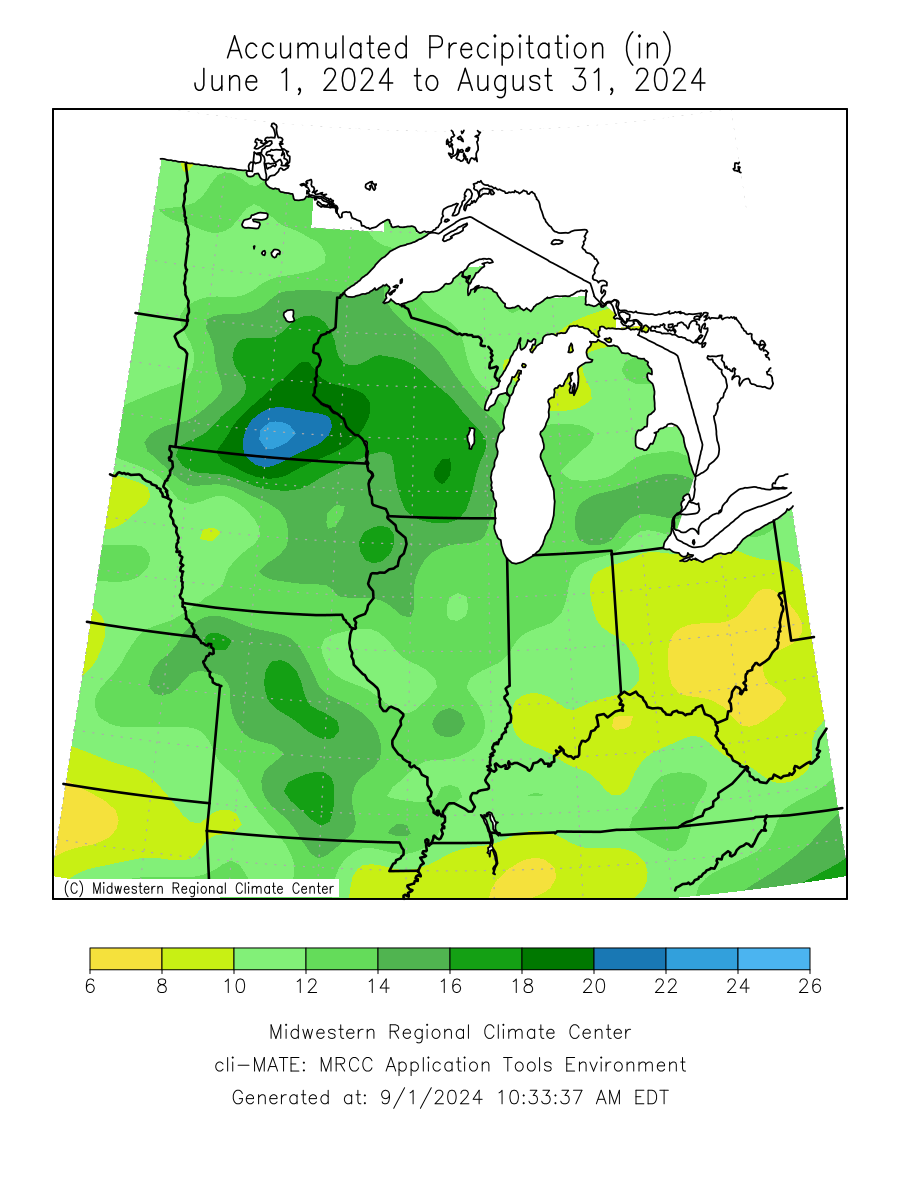
Precipitation totals were near normal to about 2 inches above normal, with the exception of Iowa City which was about 3.3" above
normal. |
| Please see Summer Records for seasonal record information. |
| |
| |
| The climate maps below are courtesy of the Midwest Regional Climate Center. |
| The maps below will be updated by late morning on the first of the month. |
| |
Average
Temperature |
Average
Temperature
Departure from Mean |
Accumulated
Precipitation |
Accumulated
Precipitation
Percent of Mean |
|
|
 |
 |
 |
 |
|
|
|
| |
| |
| A LOOK AHEAD |
| |
| Climate Prediction Center |
| |
September
Temperature Outlook |
September
Precipitation Outlook |
September - November
Temperature Outlook |
September - November
Precipitation Outlook |
 |
 |
 |
 |
|
| |
| |
| |
| |
| |
|
|

