| Climate/Almanac Data - Mar Normals - Mar Records |
| |
| MARCH |
| |
|
Site (Click site name for report)
|
Avg
Temp |
Normal
1991-2020 |
Dept
From
Normal |
Precip
Total |
Normal
​1991-2020 |
Dept
From
Normal |
Snow
Total |
Normal
​1991-2020 |
Dept
From
Normal |
| Burlington |
40.5° |
40.7° |
-0.2° |
2.51" |
2.43" |
+0.08" |
NA |
NA |
NA |
| Cedar Rapids |
36.0° |
36.5° |
-0.5° |
2.74" |
1.99" |
+0.75" |
NA |
NA |
NA |
| Davenport |
39.1° |
38.6° |
+0.5° |
3.23" |
2.34" |
+0.89" |
3.9" |
NA |
NA |
| Dubuque |
36.0° |
35.2° |
+0.8° |
2.87" |
2.25" |
+0.62" |
5.6" |
5.7" |
-0.1" |
| Iowa City |
38.9° |
39.5° |
-0.6° |
2.45" |
2.21" |
+0.24" |
NA |
NA |
NA |
| Moline |
40.4° |
39.7° |
+0.7° |
3.45" |
2.62" |
+0.83" |
3.7" |
4.4" |
-0.7" |
|
| The ranking is listed in parentheses (__) when within the "Top 10". |
| |
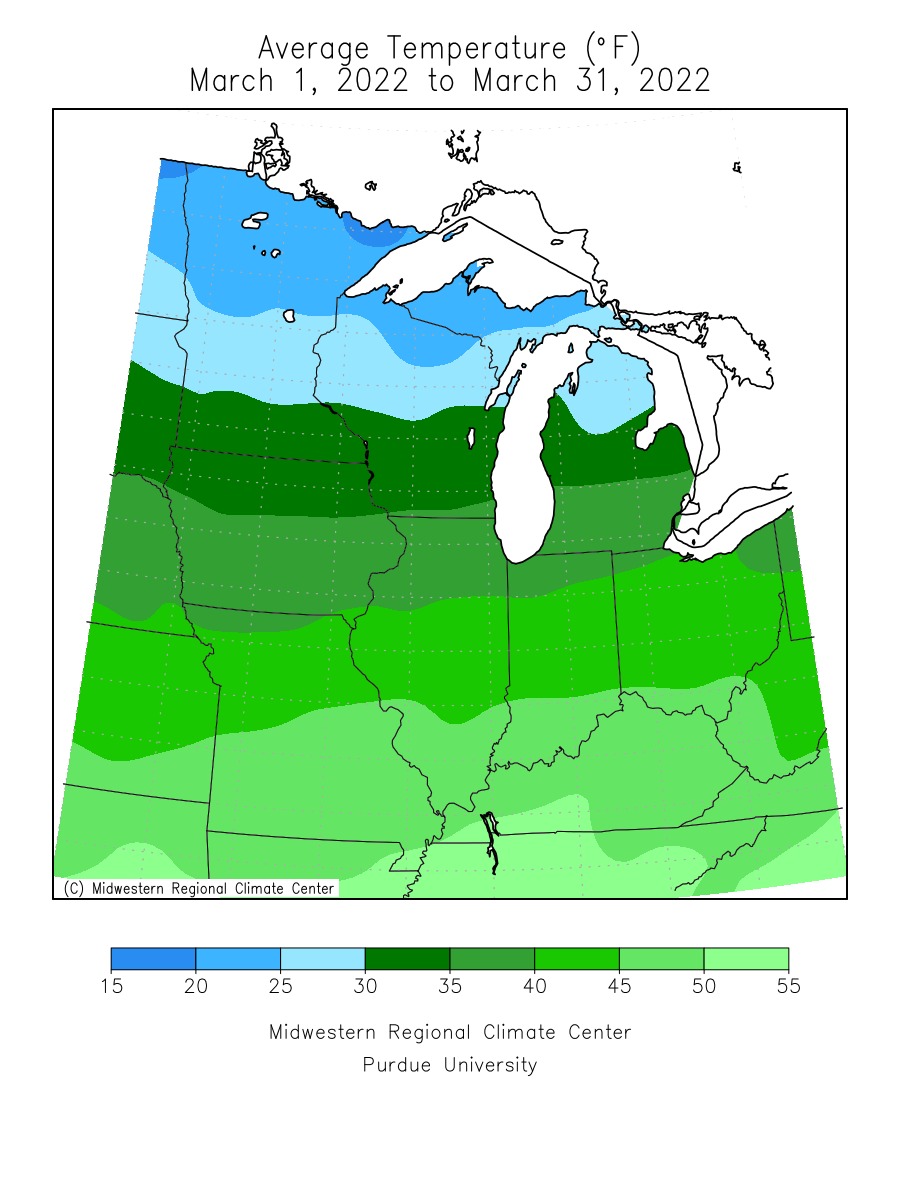
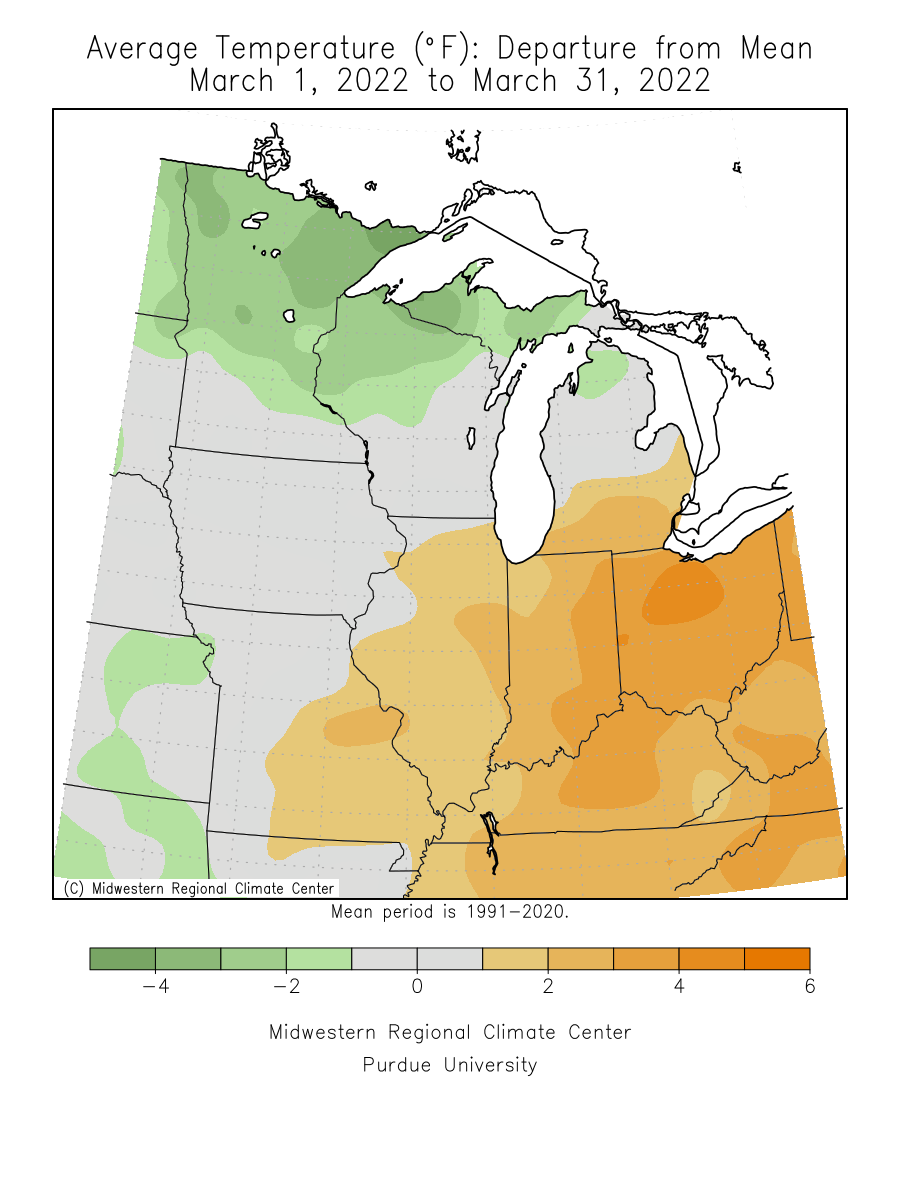
| March 2022 was just about normal in regards to the average temperature. |
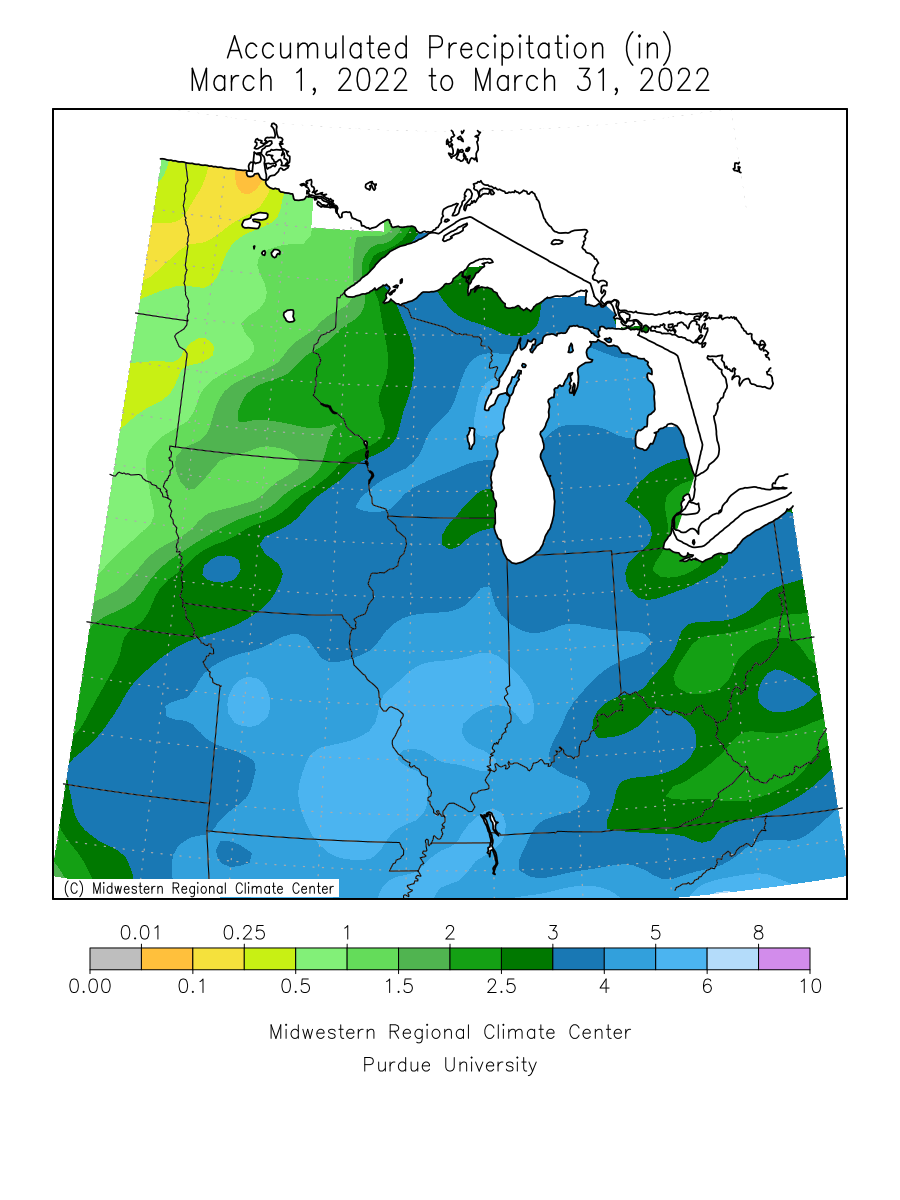
| Precipitation totals for March 2022 were about normal to around three quarters of an inch above normal. |
| Snowfall totals for March 2022 were about normal to 1 inch below normal. |
| Please see Mar Records for monthly record information. |
| |
| |
| The climate maps below are courtesy of the Midwest Regional Climate Center. |
| These maps become available around 10am on the first of the month. |
| |
|
|
|
|
|
Average
Temperature |
Average
Temperature
Departure from Mean |
Accumulated
Precipitation |
Accumulated
Precipitation
Percent of Mean |
Accumulated
Snowfall |
Accumulated
Snowfall
Percent of Mean |
 |
 |
 |
 |
 |
 |
|
| |
| |
| |
| A LOOK AHEAD |
| |
| |
April
Temperature Outlook |
April
Precipitation Outlook |
April - June
Temperature Outlook |
April - June
Precipitation Outlook |
 |
 |
 |
 |
|
| |
| |
| |
| |
| |
| |
| |

