| Climate/Almanac Data - Feb Normals - Feb Records |
| |
| FEBRUARY |
| |
|
Site
(Click site name for report)
|
Avg
Temp |
Normal
1991-2020 |
Dept
From
Norm |
Precip
Total |
Normal
1991-2020 |
Dept
From
Norm |
Snowfall
Total |
Normal
1991-2020 |
Dept
From
Norm |
| Burlington |
40.1°(3rd) |
28.8° |
+11.3° |
0.11" (1st) |
1.69" |
-1.58" |
NA |
NA |
NA |
| Cedar Rapids |
37.0°(1st) |
24.1° |
+12.9° |
0.10" (5th) |
1.22" |
-1.12" |
NA |
NA |
NA |
| Davenport |
38.2° |
26.3° |
+11.9° |
0.17" |
1.44" |
-1.27" |
0.5" |
NA |
NA |
| Dubuque |
36.2°(1st) |
22.9° |
+13.3° |
0.42" |
1.57" |
-1.15" |
T (1st) |
10.6" |
-10.6" |
| Iowa City |
38.5° |
27.0° |
+11.5° |
0.15" |
1.21" |
-1.06" |
NA |
NA |
NA |
| Moline |
39.5°(1st) |
27.7° |
+11.8° |
0.26"(10th) |
1.83" |
-1.57" |
0.6"(7th) |
8.6" |
-8.0" |
The ranking is listed in parentheses (__) when within the "Top 10".
|
| |
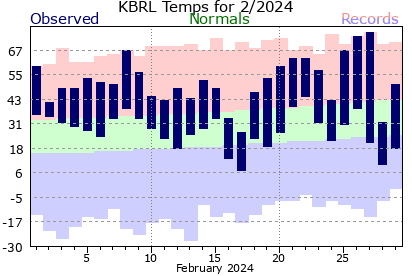
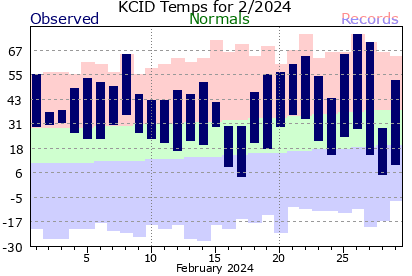
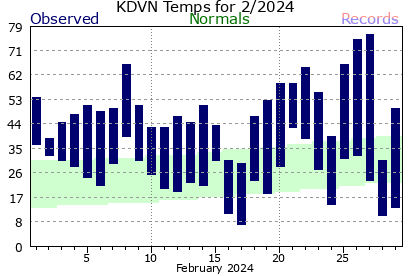
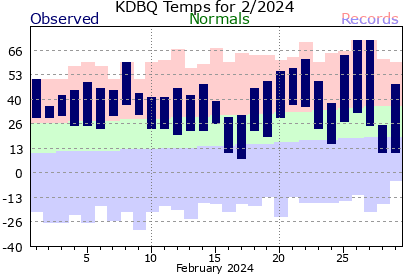
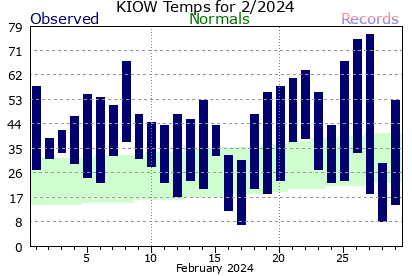
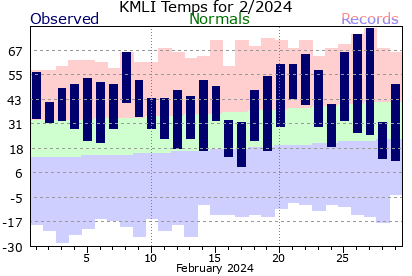
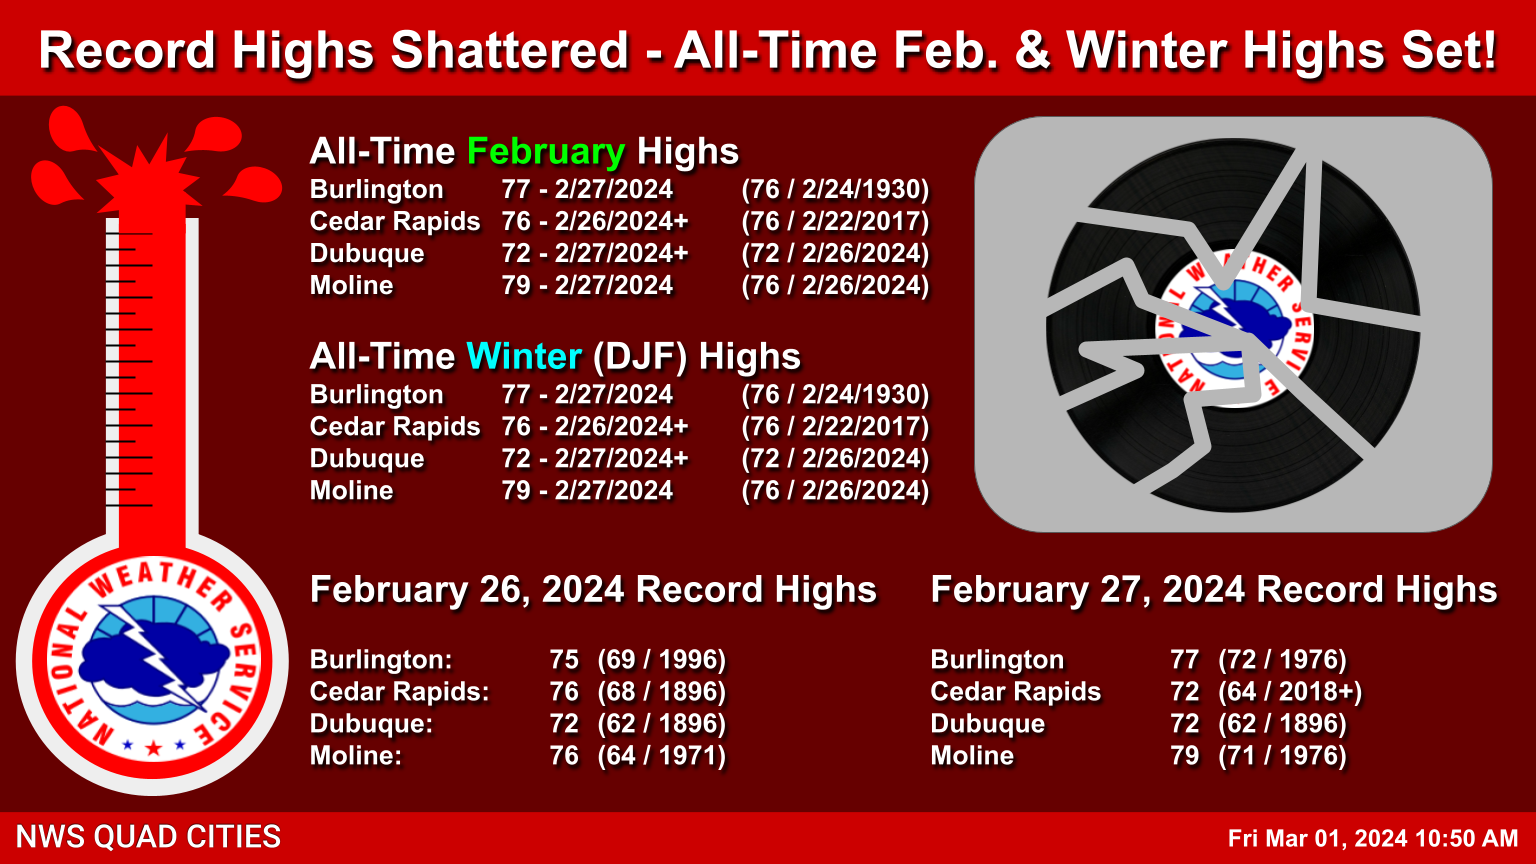
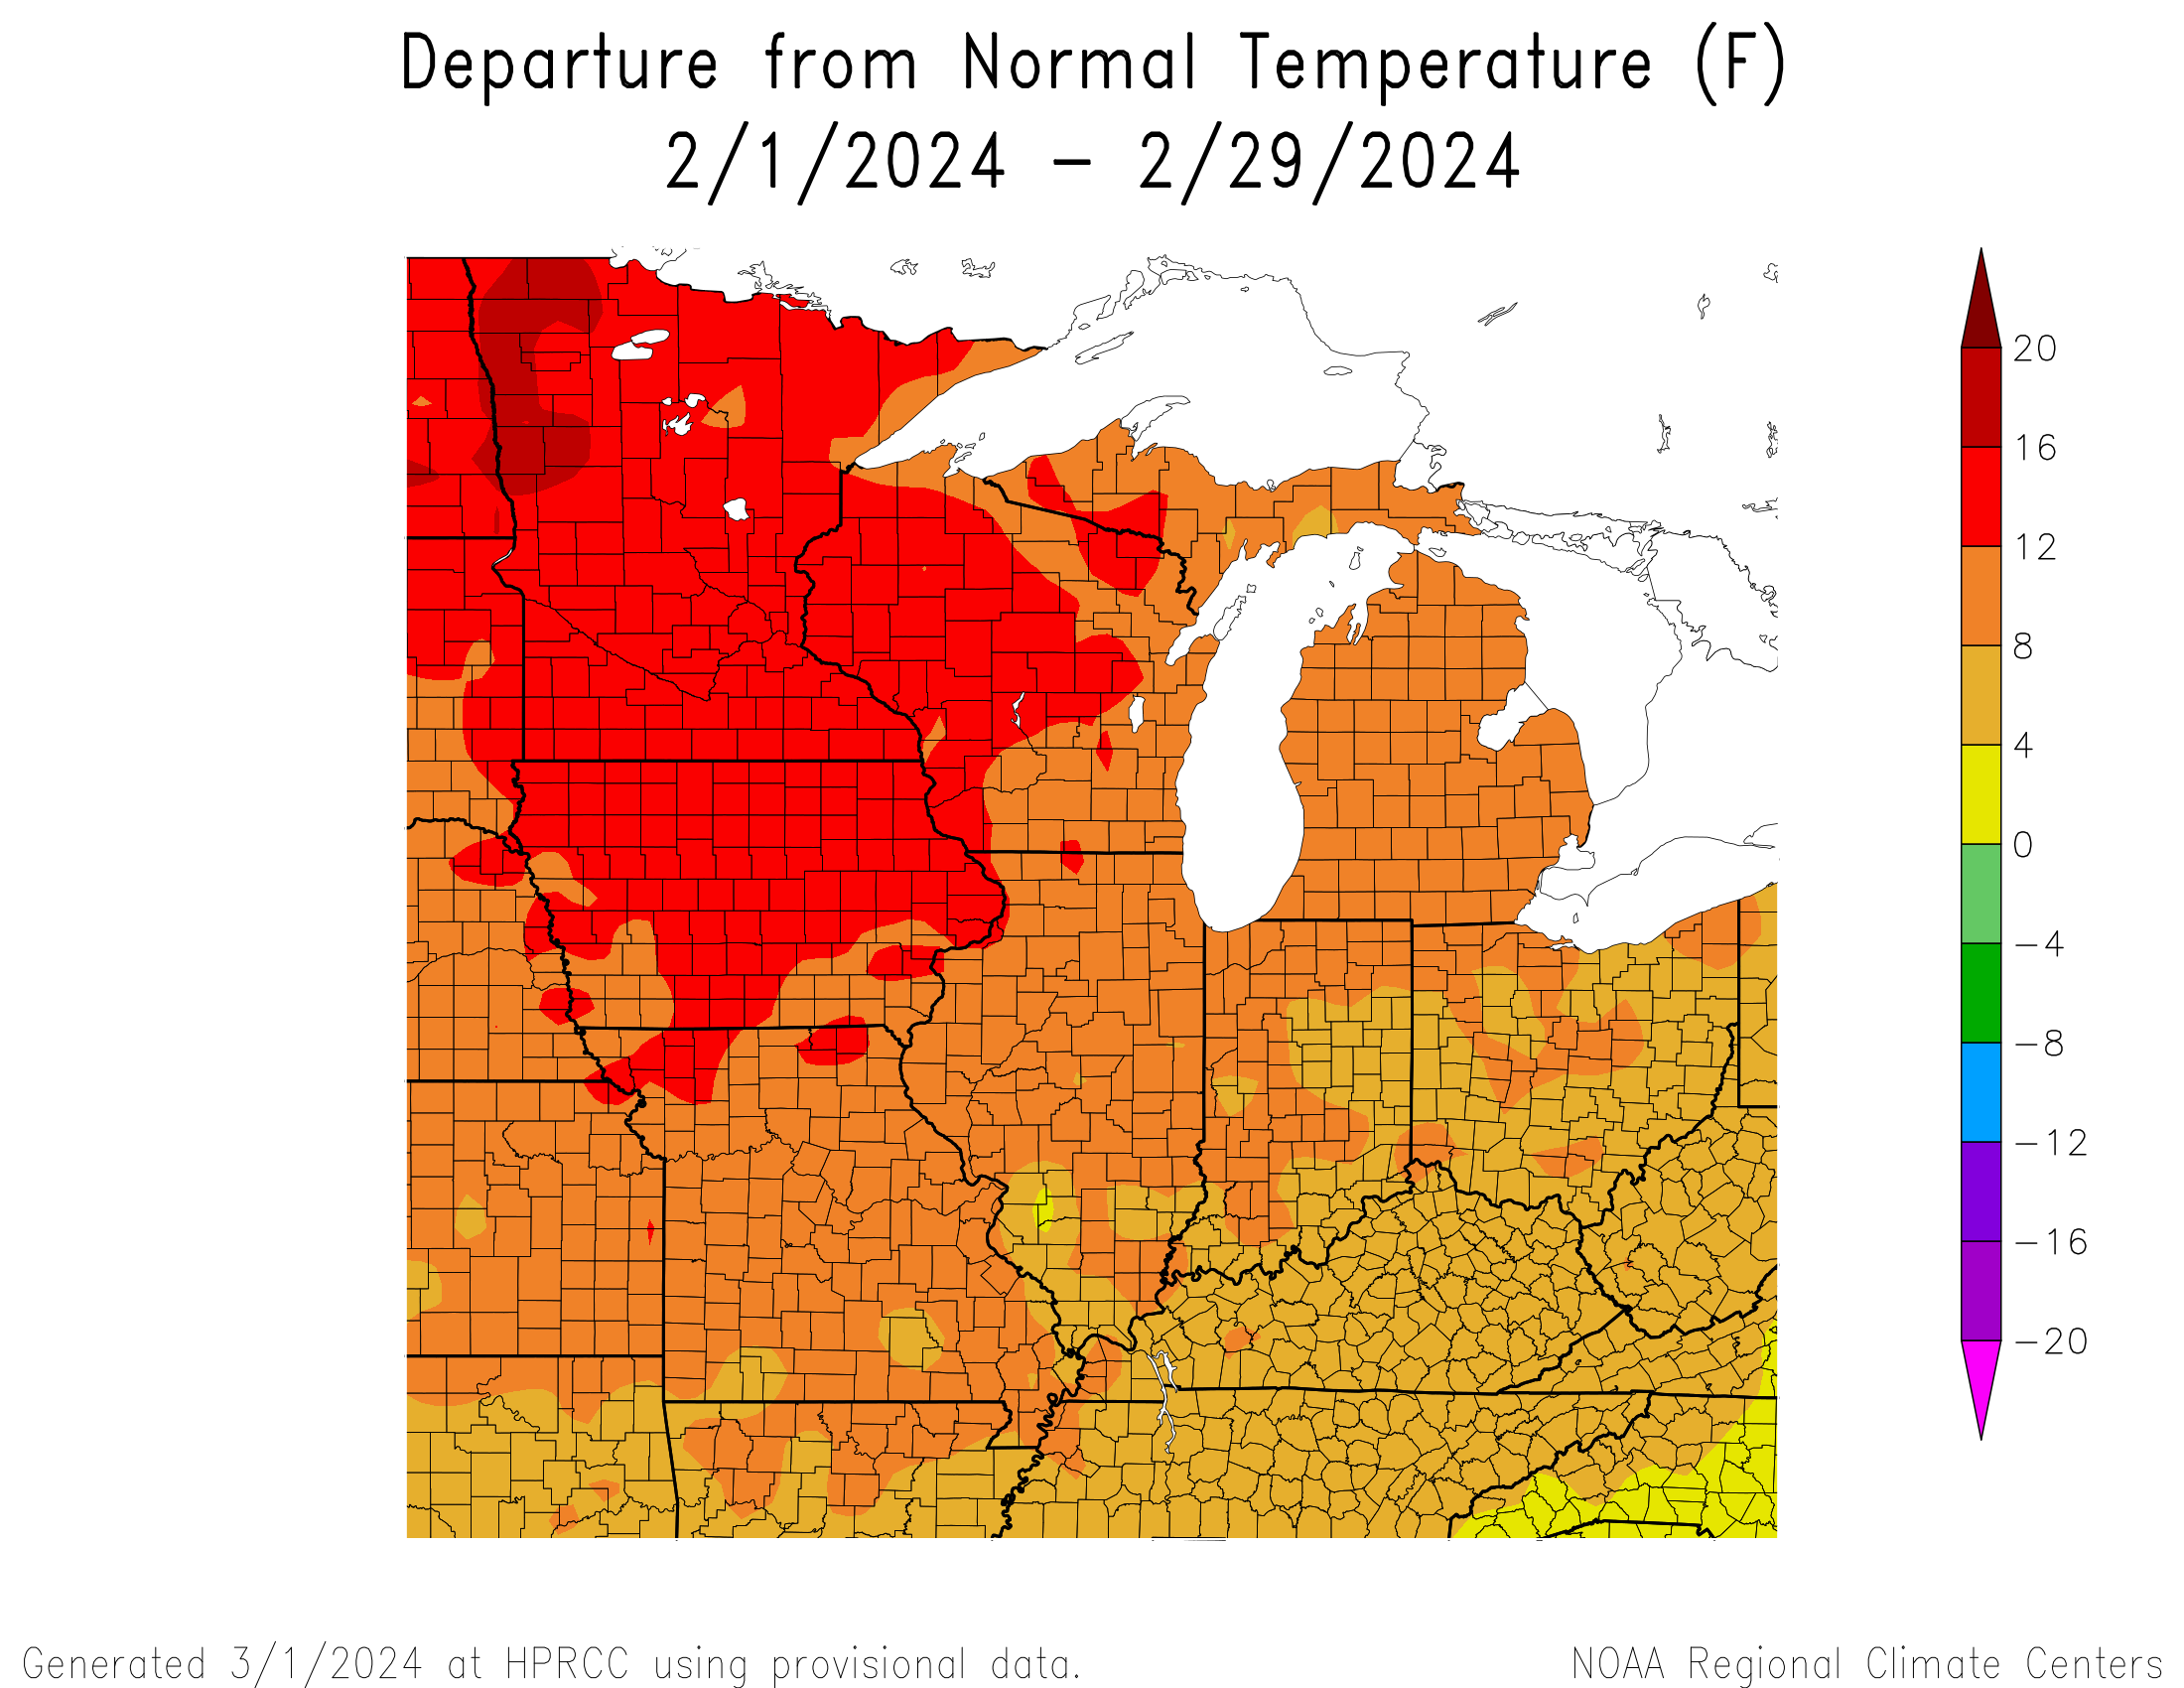
| February 2024 was about 11.5 to 13 degrees above normal! |
| It was THE warmest February for Moline, Dubuque, and Cedar Rapids! Burlington came in 3rd |
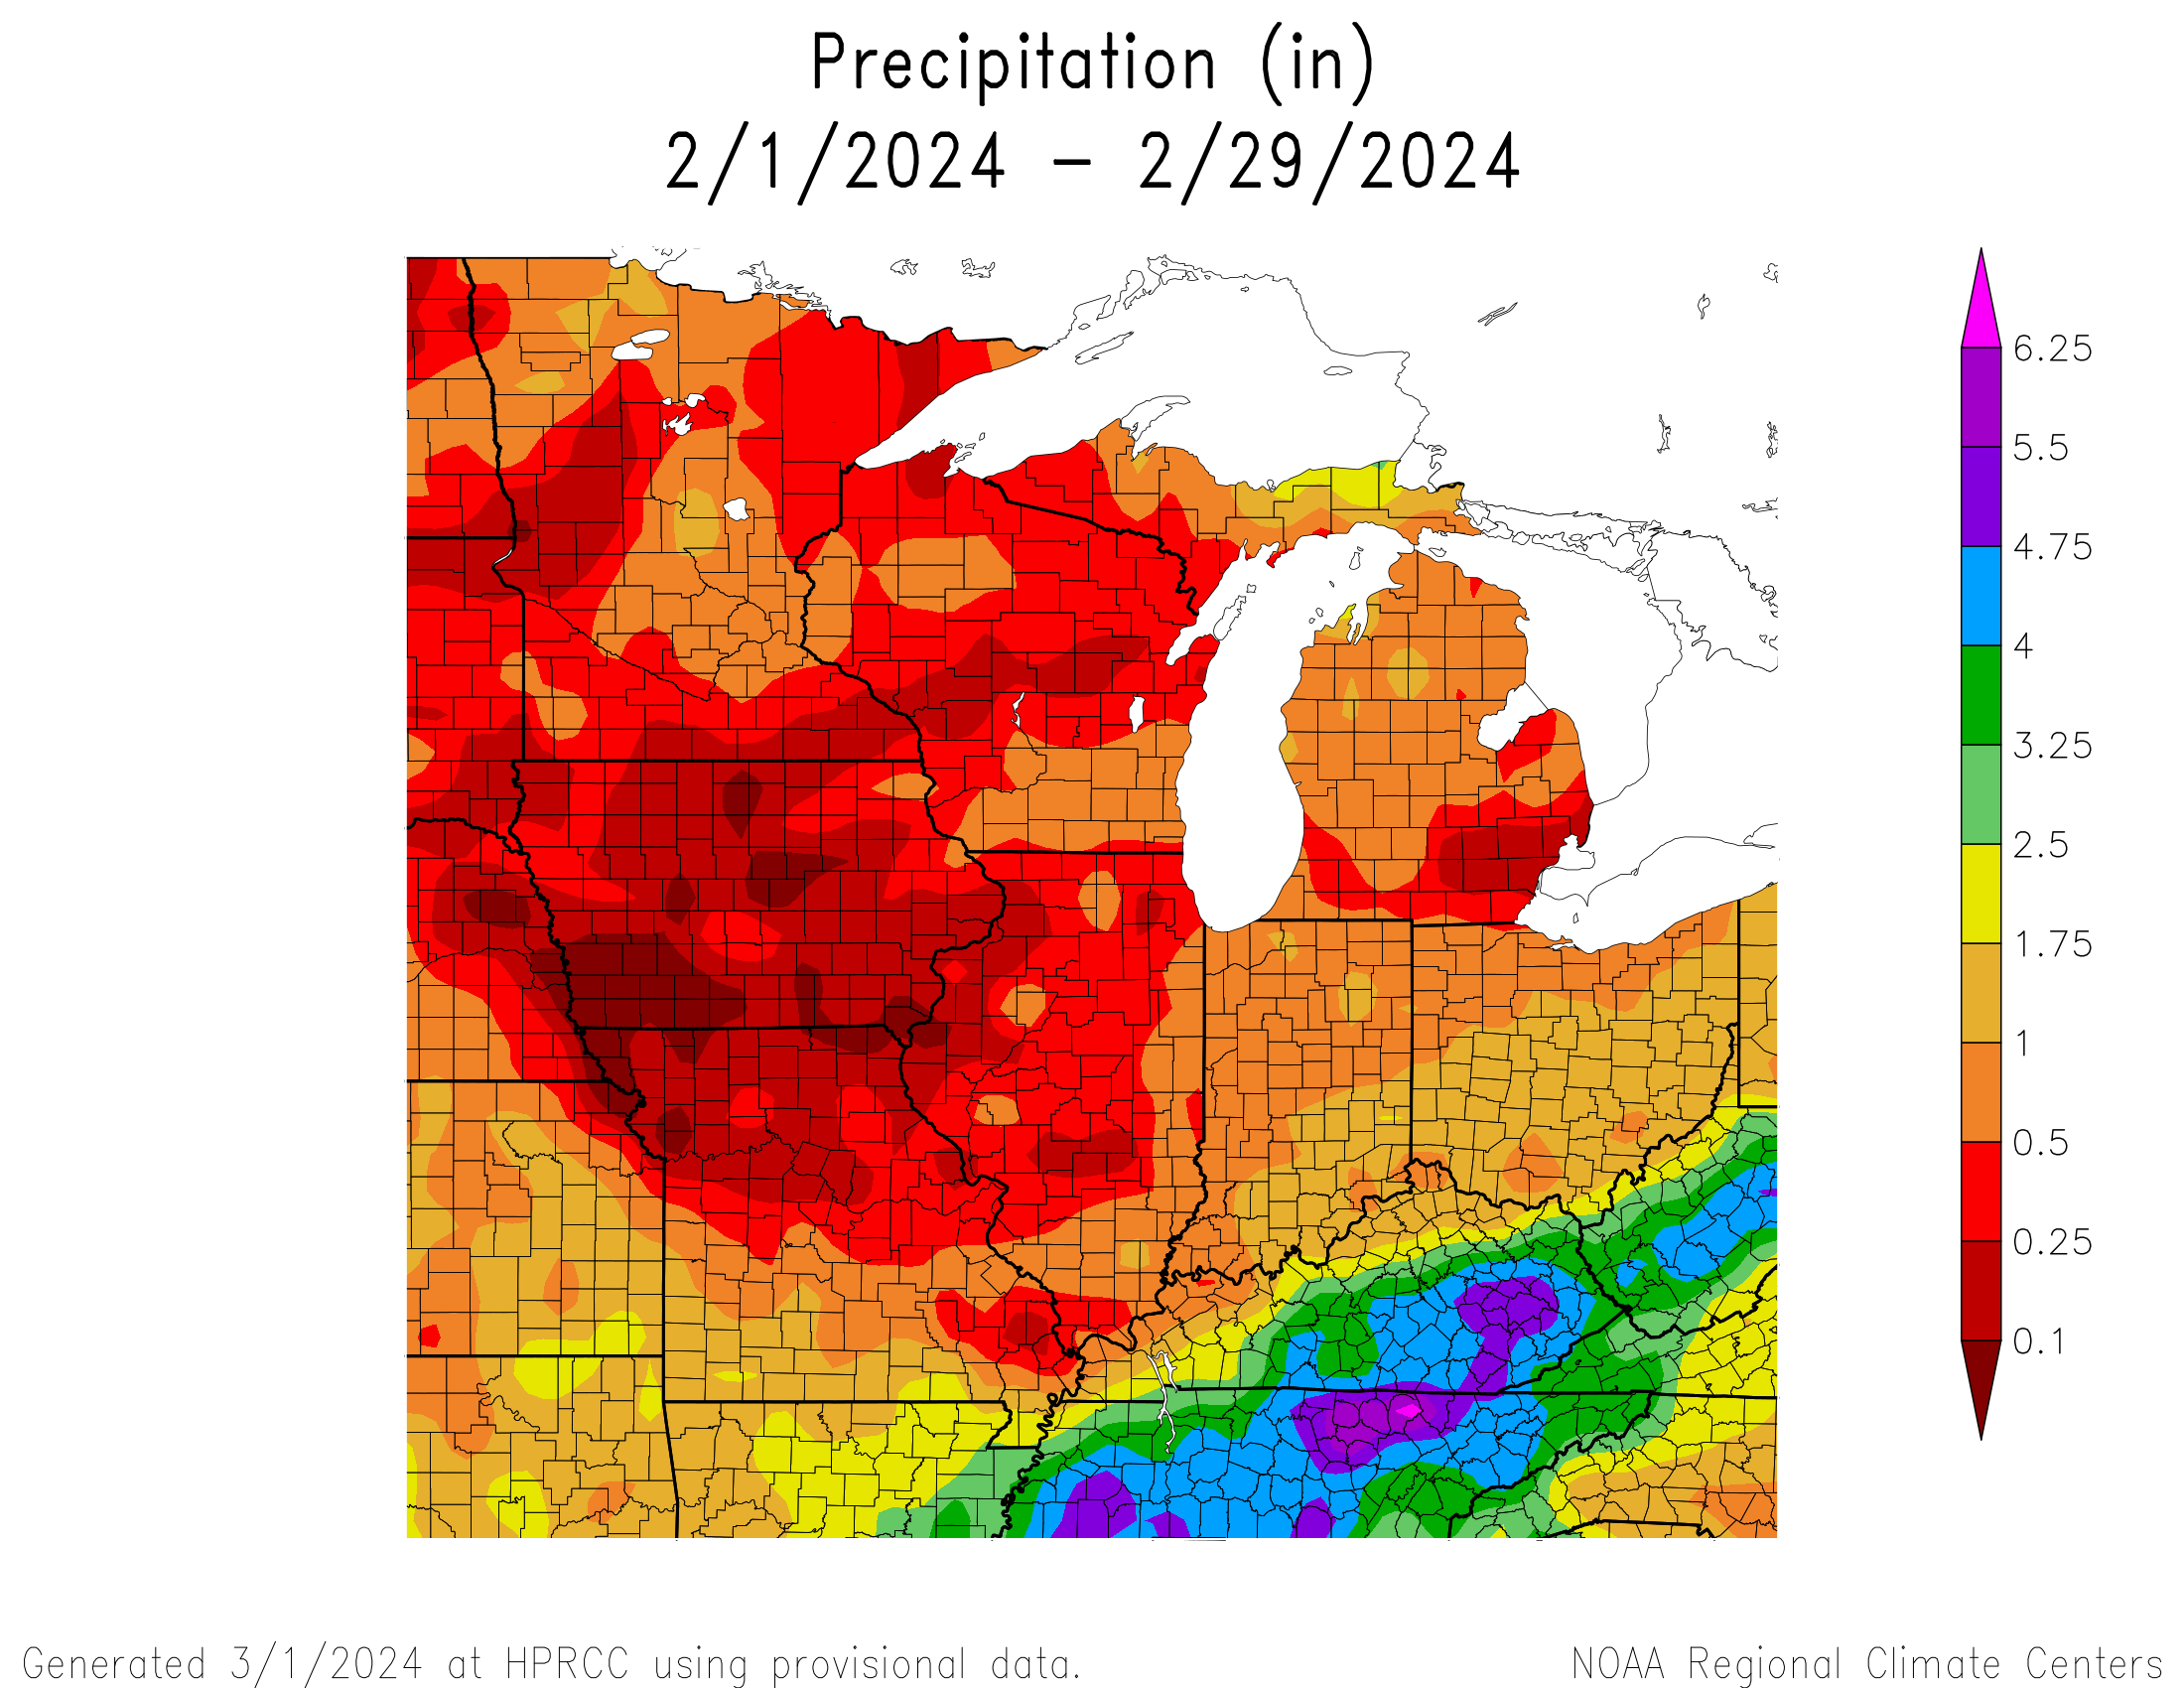
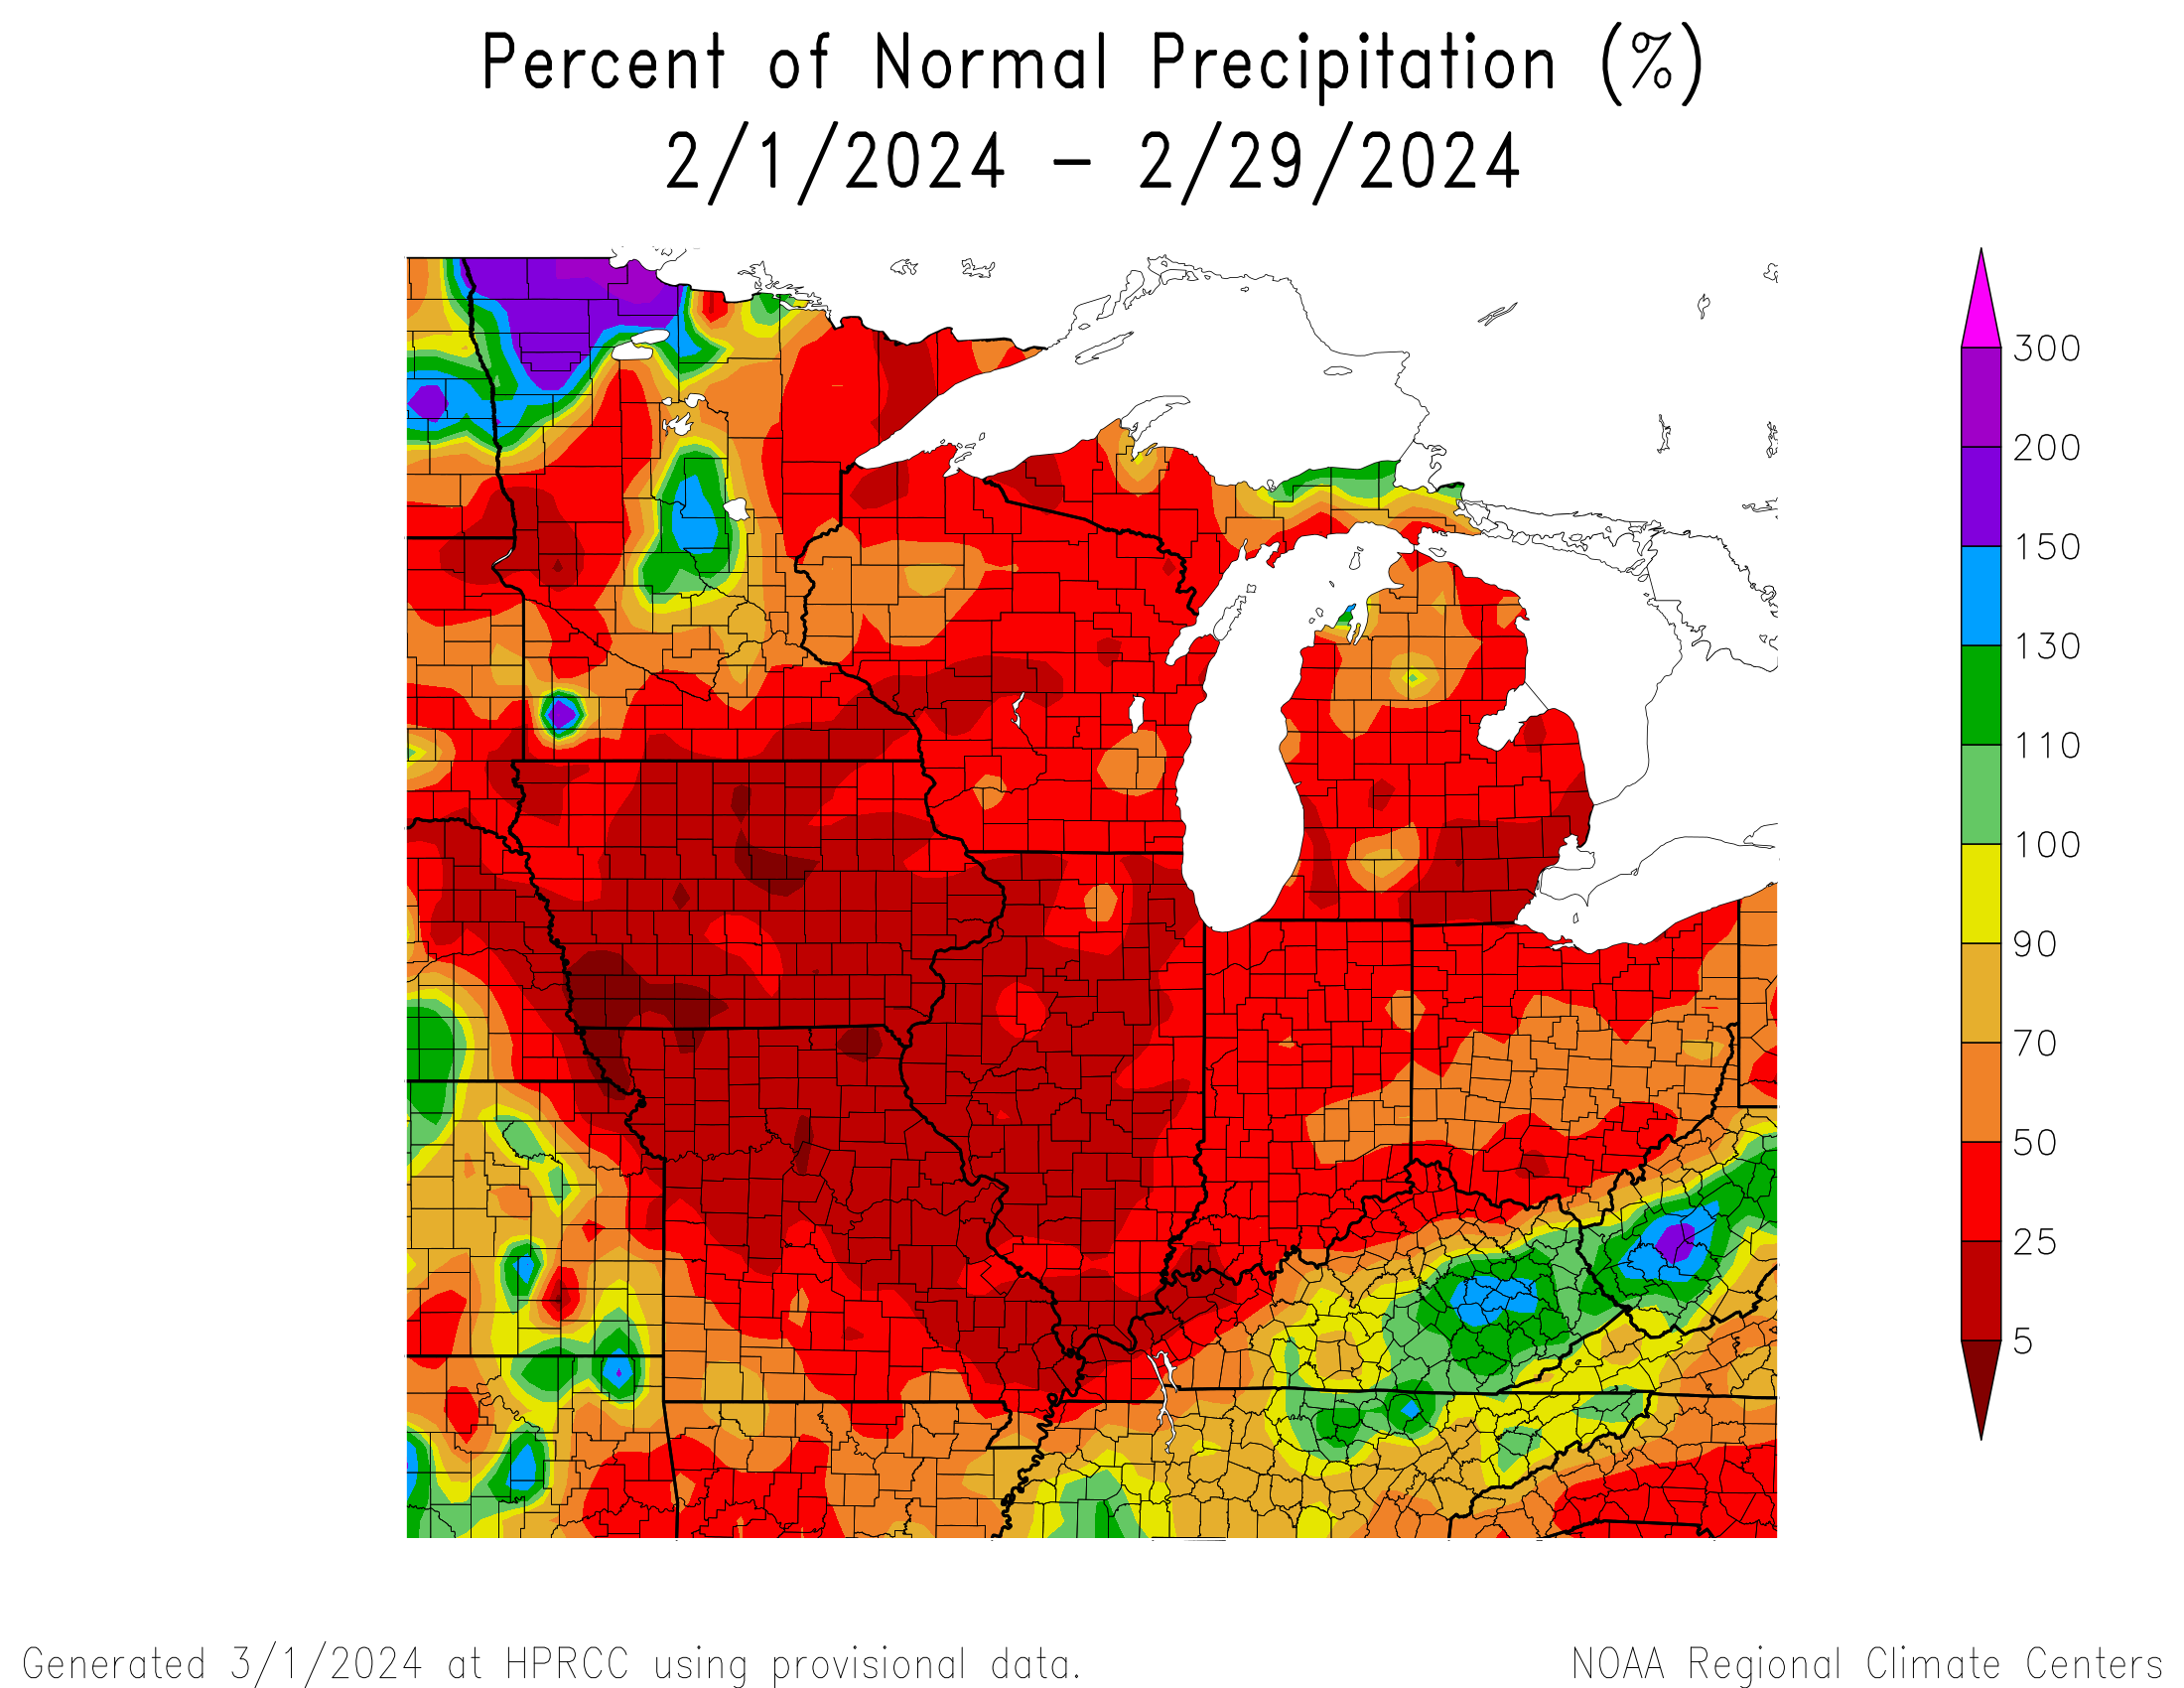
| Precipitation totals were 1 to 1.6 inches below normal. |
| It was the driest February for Burlington, 4th driest in Cedar Rapids, and 10th driest in Moline! |
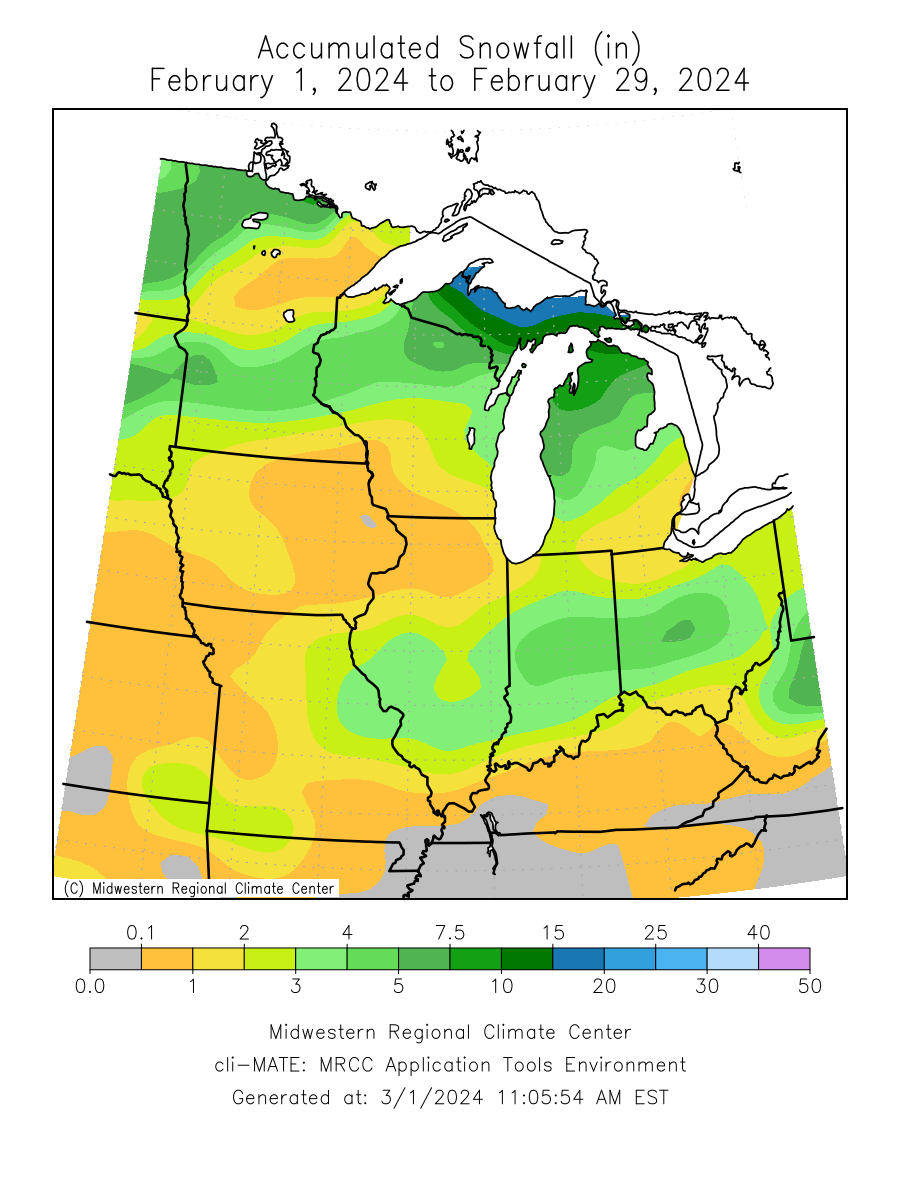
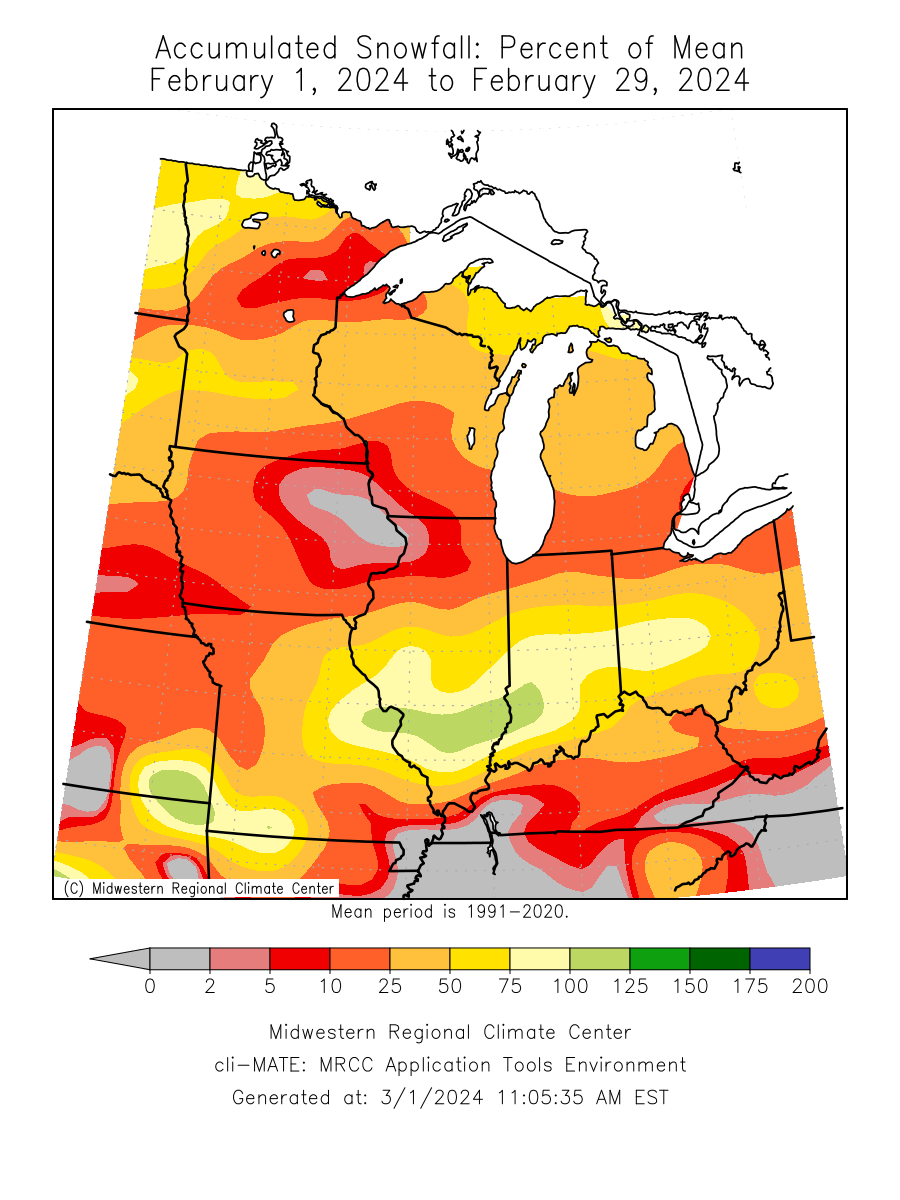
| Snowfall totals were about 8 to 10.5 inches below normal. |
| Dubuque tied it's Least Snowiest February on record with only a Trace recorded! |
| Moline tied it's 7th Least Snowiest February on record with only a 0.6" recorded! |
| |
| Please see Feb Records for monthly record information. |
| |
 |
| |
|
|
| |
| The climate maps below are courtesy of the High Plains and Midwest Regional Climate Centers. |
| Some of these maps become available during the afternoon on the first of the month. |
| |
Average
Temperature |
Average
Temperature
Departure from Mean |
Accumulated
Precipitation |
Accumulated
Precipitation
Percent of Mean |
Accumulated
Snowfall |
Accumulated
Snowfall
Percent of Mean |
.png) |
 |
 |
 |
 |
 |
|
| |
| |
| |
| |
| |
| Climate/Almanac Data - Winter Normals - Winter Records |
| |
WINTER
(DEC-FEB) |
| |
|
Site
(Click site name for report courtesy of the
Iowa Environmental Mesonet.)
|
Avg
Temp |
Normal
1991-2020 |
Dept
From
Norm |
Precip
Total |
Normal
1991-2020 |
Dept
From
Norm |
Snowfall
Total |
Normal
1991-2020 |
Dept
From
Norm |
| Burlington |
33.9° (2nd) |
27.7° |
+6.2° |
4.84" |
5.01" |
-0.17" |
NA |
NA |
NA |
| Cedar Rapids |
31.1° (1st) |
23.0° |
+8.1° |
4.35" |
3.76" |
+0.59" |
NA |
NA |
NA |
| Davenport |
33.1° |
25.3° |
+7.8° |
6.02" |
4.22" |
+1.80" |
33.6" |
NA |
NA |
| Dubuque |
30.6° (4th) |
22.1° |
+8.5° |
5.83" |
4.69" |
+1.14" |
33.7" |
31.6" |
+2.1" |
| Iowa City |
32.5° |
26.0° |
+6.5° |
3.99" |
3.70" |
+0.29" |
NA |
NA |
NA |
| Moline |
33.6° (3rd) |
26.6° |
+7.0° |
6.37" |
5.53" |
+0.84" |
30.7" |
28.2" |
+2.5" |
|
|
The ranking is listed in parentheses (__) when within the "Top 10"..
|
| |
| Winter 2023-2024 was about 6 to 8.5 degrees above normal. |
| It was the warmest Winter for Cedar Rapids, 2nd warmest in Burlington, 3rd warmest in Moline, and 4th warmest in Dubuque! |
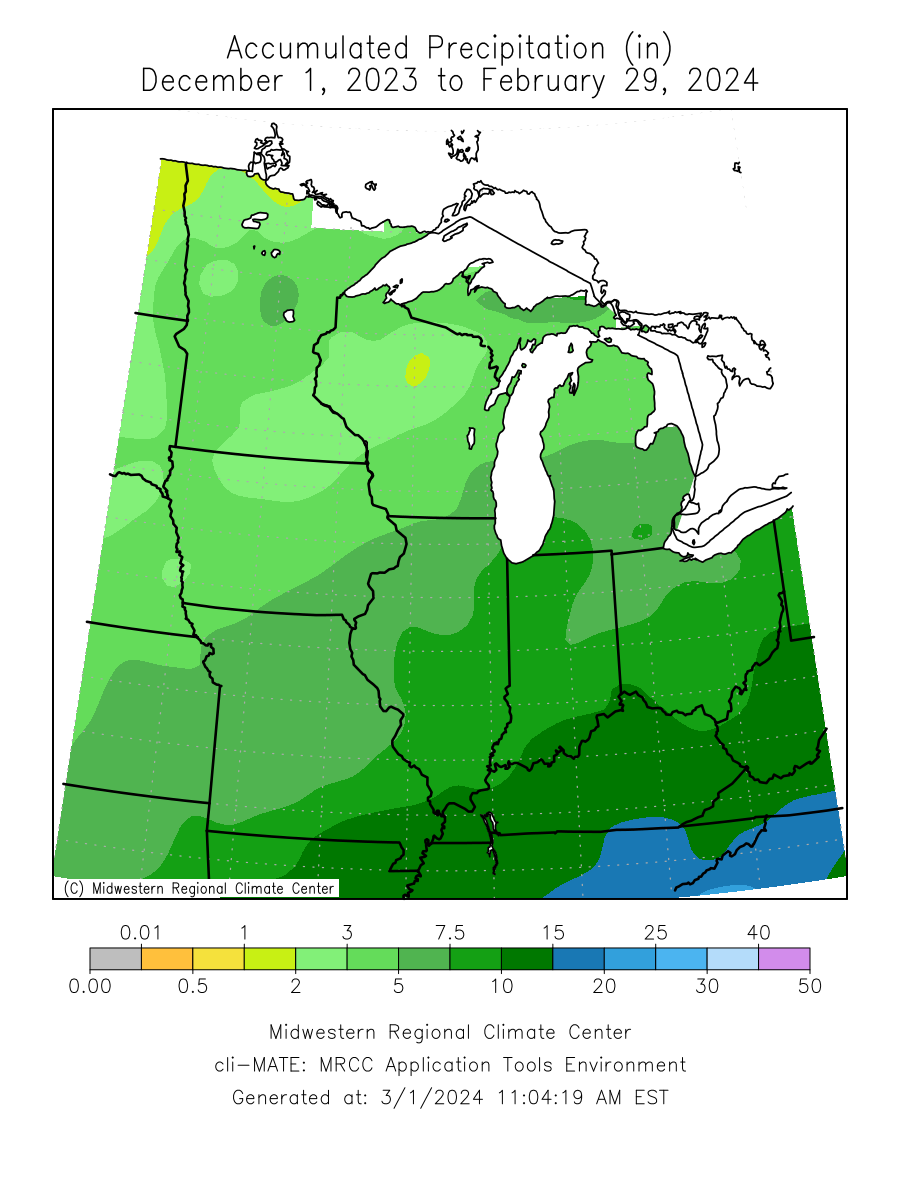
| Precipitation totals were about normal to 1.8 inches above normal at Davenport. |
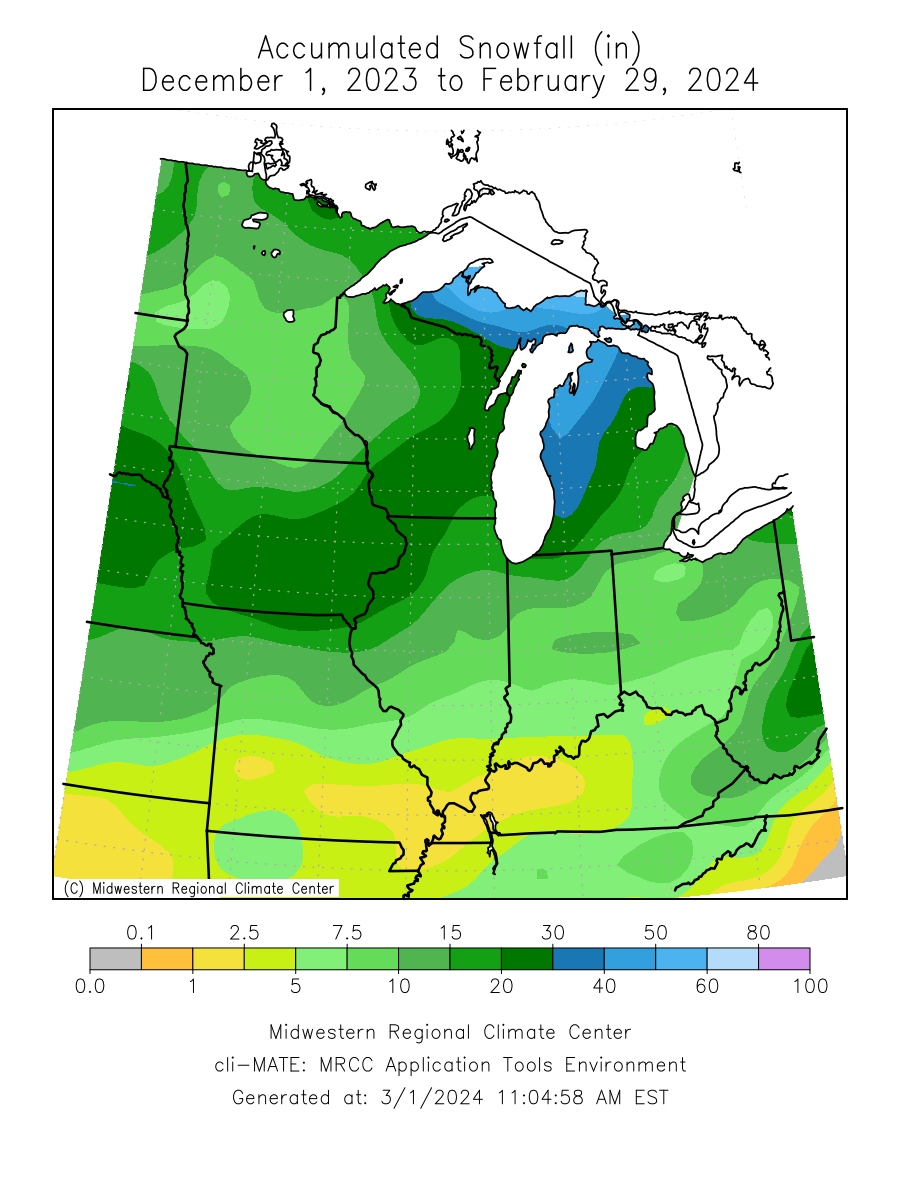
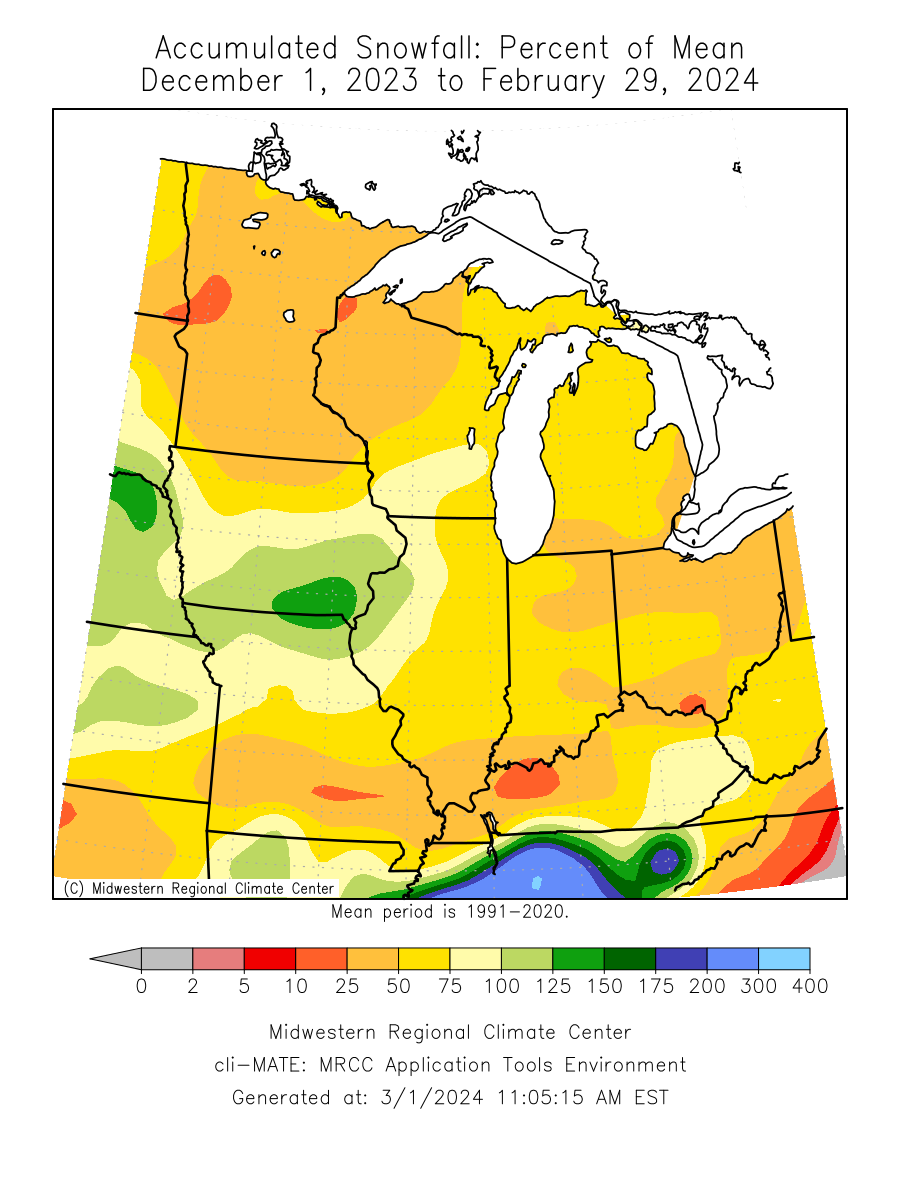
| Snowfall totals were about 2 inches above normal. |
| Please see Winter Records for seasonal record information. |
| |
| |
| The climate maps below are courtesy of the High Plains and Midwest Regional Climate Centers. |
| Some of these maps become available during the afternoon on the first of the month. |
| |
Average
Temperature |
Average
Temperature
Departure from Mean |
Accumulated
Precipitation |
Accumulated
Precipitation
Percent of Mean |
Accumulated
Snowfall |
Accumulated
Snowfall
Percent of Mean |
 |
 |
 |
 |
 |
 |
|
| |
| |
| |
| A LOOK AHEAD |
| |
| |
March
Temperature Outlook |
March
Precipitation Outlook |
March - May
Temperature Outlook |
March - May
Precipitation Outlook |
 |
 |
 |
 |
|
| |
| |
| |
| |
|
|