| Climate/Almanac Data - Mar Normals - Mar Records |
| |
| March |
| |
|
Site (Click site name for report)
|
Avg
Temp |
Norm
1991-2020 |
Dept
From
Norm |
Precip
Total |
Norm
1991-2020 |
Dept
From
Norm |
Snow
Total |
Norm
1991-2020 |
Dept
From
Norm |
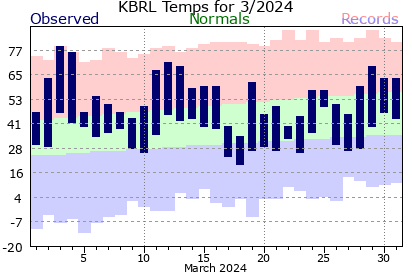
| Burlington |
45.9° |
40.7° |
+5.2° |
5.56" |
2.43" |
+3.13" |
NA |
NA |
NA |
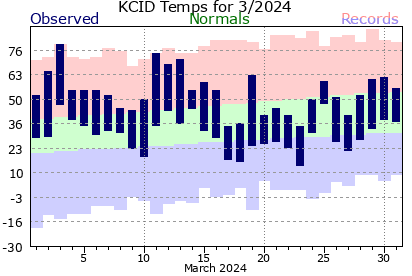
| Cedar Rapids |
42.4° |
36.5° |
+5.9° |
2.31" |
1.99" |
+0.32" |
NA |
NA |
NA |
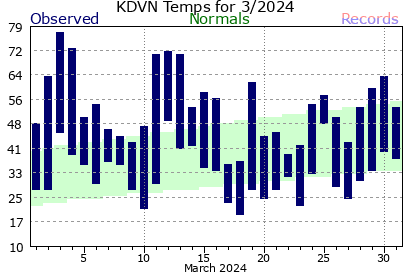
| Davenport |
43.6° |
38.6° |
+5.0° |
2.59" |
2.34" |
+0.25" |
0.5" |
NA |
NA |
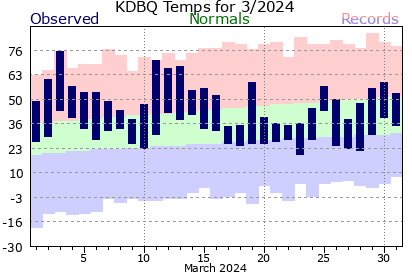
| Dubuque |
41.2° |
35.2° |
+6.0° |
2.74" |
2.25" |
+0.49" |
3.5" |
5.7" |
-2.2" |
| Iowa City |
44.4° |
39.5° |
+4.9° |
2.48" |
2.21" |
+0.27" |
NA |
NA |
NA |
| Moline |
45.3°(7) |
39.7° |
+5.6° |
3.36" |
2.62" |
+0.74" |
0.1"(9T) |
4.4" |
-4.3" |
|
| The ranking is listed in parentheses (__) when within the "Top 10". |
| |
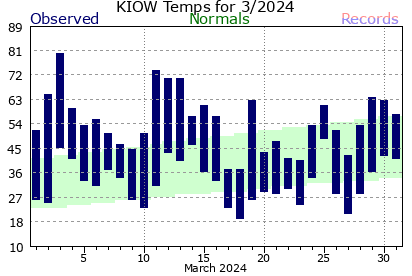
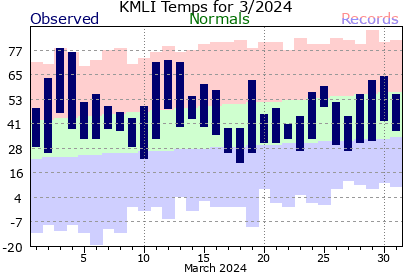
- March 2024 was about 5 to 6 degrees above normal. Moline had it's 7th warmest March on Record.
- Precipitation totals were about normal to about 3 inches above normal at Burlington.
- Snowfall totals were about 2 to 4 inches below normal. Moline tied for it's 9th least snowy March on record.
|
| Please see Mar Records for monthly record information. |
| |
|
|
|
|
| |
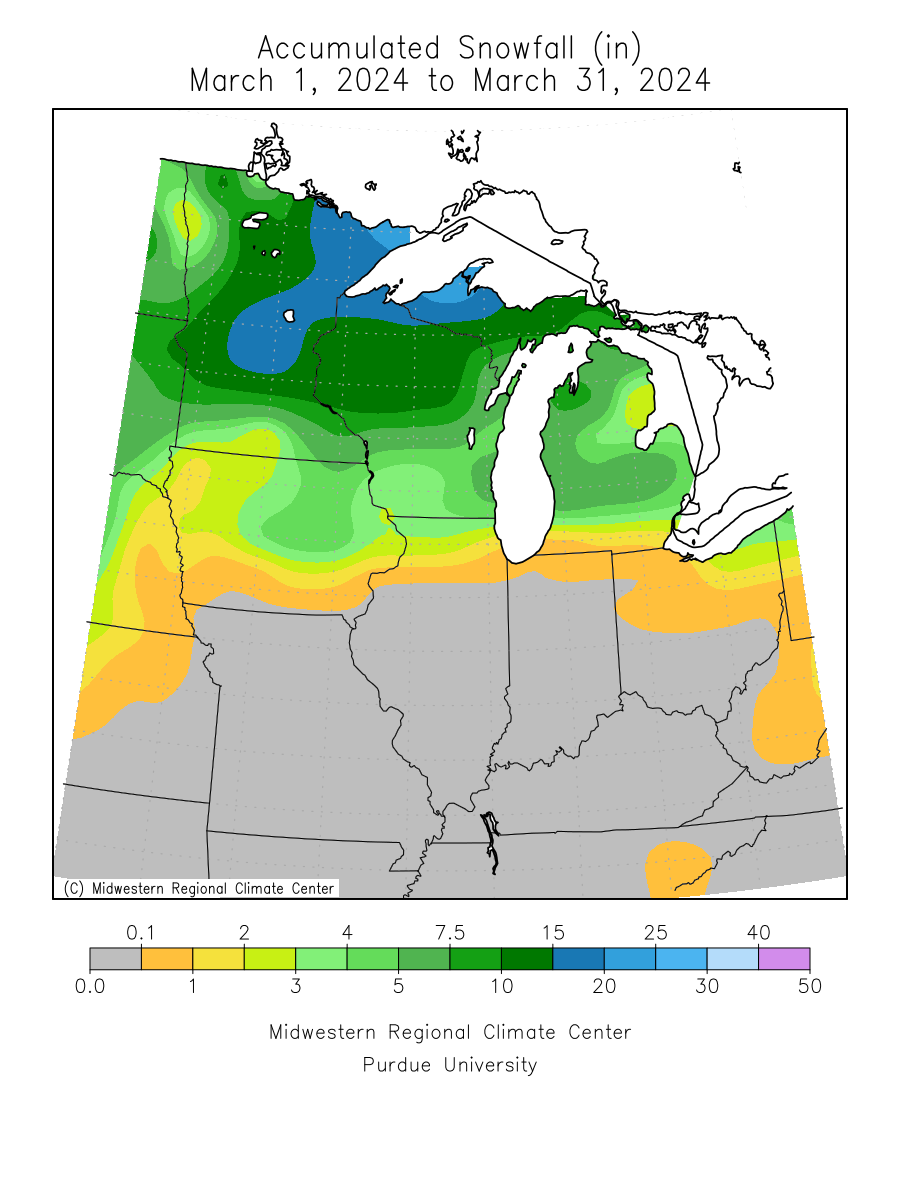
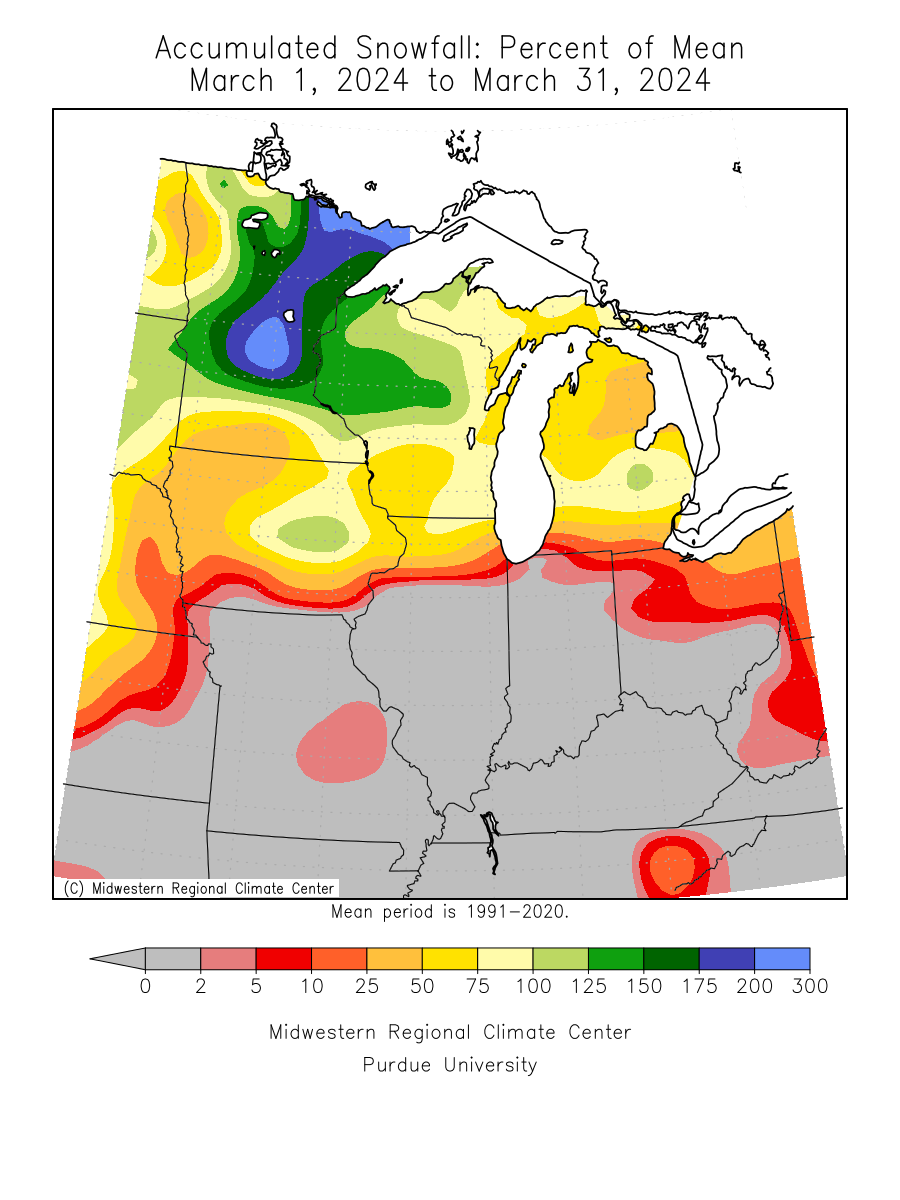
| The climate maps below are courtesy of the Northeast Regional Climate Center and Midwest Regional Climate Center. |
| These maps become available during the afternoon on the first of the month. |
| |
|
|
|
|
|
Average
Temperature |
Average
Temperature
Departure from Mean |
Accumulated
Precipitation |
Accumulated
Precipitation
Percent of Mean |
Accumulated
Snowfall |
Accumulated
Snowfall
Percent of Mean |
 |
 |
 |
 |
 |
 |
|
| |
| |
| A LOOK AHEAD |
| |
| For more information on the Climate Outlooks, see the Climate Prediction Center. |
| |
April
Temperature Outlook |
April
Precipitation Outlook |
April - June
Temperature Outlook |
April - June
Precipitation Outlook |
 |
 |
 |
 |
|
| |
| |
| |
| |
| |