| Climate/Almanac Data - Feb Normals - Feb Records |
| |
| FEBRUARY |
| |
|
Site
(Click site name for report)
|
Avg
Temp |
Normal
1991-2020 |
Dept
From
Norm |
Precip
Total |
Normal
1991-2020 |
Dept
From
Norm |
Snowfall
Total |
Normal
1991-2020 |
Dept
From
Norm |
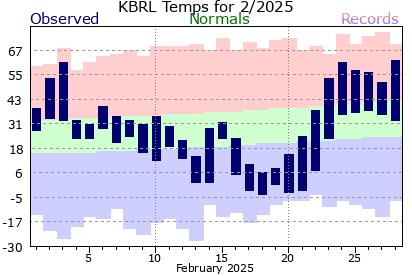
| Burlington |
27.1° |
28.8° |
-1.7° |
0.19" |
1.69" |
-1.50" |
NA |
NA |
NA |
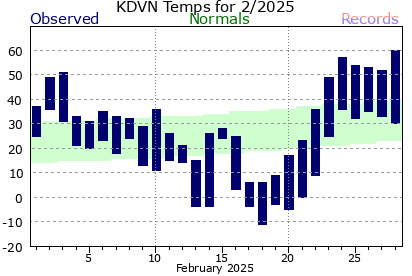
| Cedar Rapids |
22.3° |
24.1° |
-1.8° |
0.43" |
1.22" |
-0.79" |
NA |
NA |
NA |
| Davenport |
24.6° |
26.3° |
-1.7° |
0.31" |
1.44" |
-1.13" |
5.6" |
NA |
NA |
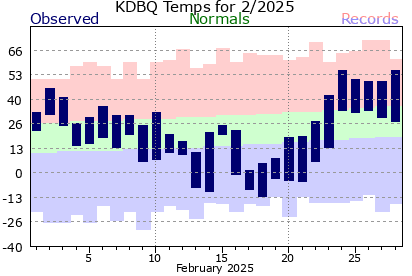
| Dubuque |
21.2° |
22.9° |
-1.7° |
0.49" |
1.57" |
-1.08" |
9.1" |
10.6" |
-1.5" |
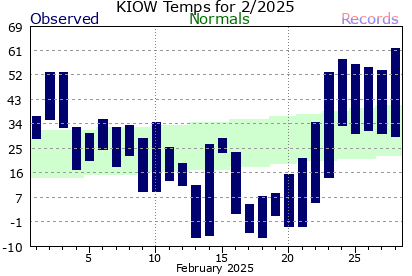
| Iowa City |
24.5° |
27.0° |
-2.5° |
0.50" |
1.21" |
-0.71" |
NA |
NA |
NA |
| Moline |
25.8° |
27.7° |
-1.9° |
0.32" |
1.83" |
-1.51" |
3.1" |
8.6" |
-5.5" |
The ranking is listed in parentheses (__) when within the "Top 10".
|
| |
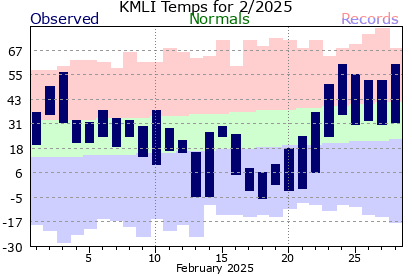
| February 2025 was about 1.7 to 2.5 degrees below normal. |
| Precipitation totals were about 0.7 to 1.5 inches below normal. |
| Snowfall totals were about 1.5 to 5.5 inches below normal. |
| |
| Please see Feb Records for monthly record information. |
| |
| |
|
|
| |
| The climate maps below are courtesy of the High Plains and Midwest Regional Climate Centers. |
| Some of these maps become available during the afternoon on the first of the month. |
| |
| |
Average
Temperature
Departure from Mean |
|
Accumulated
Precipitation
Percent of Mean |
|
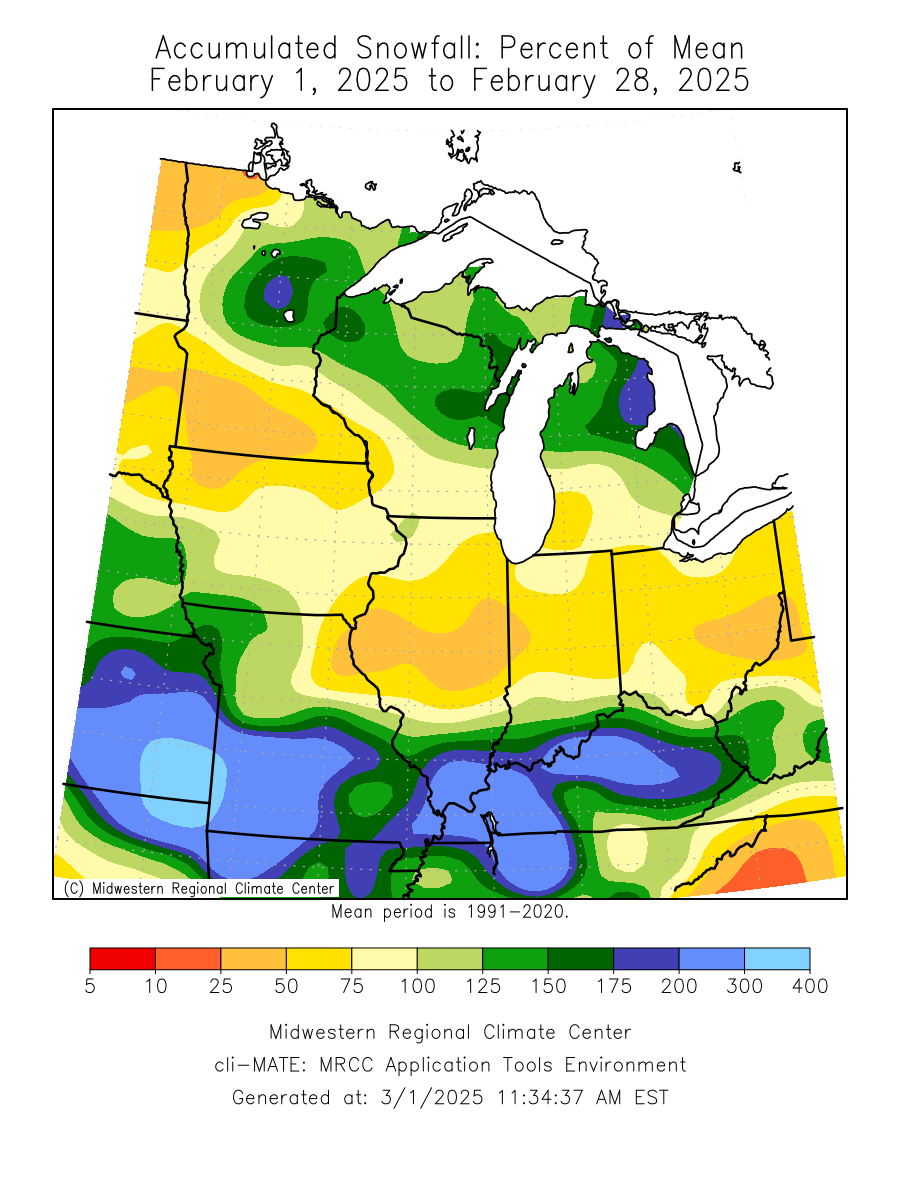
Accumulated
Snowfall
Percent of Mean |
| |
 |
|
 |
|
 |
| |
|
|
|
|
|
| |
Average
Temperature |
|
Accumulated
Precipitation |
|
Accumulated
Snowfall |
| |
 |
|
 |
|
 |
|
| |
| |
| |
| |
| |
| Climate/Almanac Data - Winter Normals - Winter Records |
| |
WINTER
(DEC-FEB) |
| |
|
Site
(Click site name for report courtesy of the
Iowa Environmental Mesonet.)
|
Avg
Temp |
Normal
1991-2020 |
Dept
From
Norm |
Precip
Total |
Normal
1991-2020 |
Dept
From
Norm |
Snowfall
Total |
Normal
1991-2020 |
Dept
From
Norm |
| Burlington |
27.2° |
27.7° |
-0.5° |
2.45" |
5.01" |
-2.56" |
NA |
NA |
NA |
| Cedar Rapids |
23.7° |
23.0° |
+0.7° |
2.47" |
3.76" |
-1.29" |
NA |
NA |
NA |
| Davenport |
25.2° |
25.3° |
-0.1° |
2.47" |
4.22" |
-1.75" |
11.6" |
NA |
NA |
| Dubuque |
22.5° |
22.1° |
+0.4° |
2.06"(9) |
4.69" |
-2.63" |
14.7"(6) |
31.6" |
-16.9" |
| Iowa City |
25.5° |
26.0° |
-0.5° |
3.00" |
3.70" |
-0.70" |
NA |
NA |
NA |
| Moline |
26.5° |
26.6° |
-0.1° |
3.59" |
5.53" |
-1.94" |
6.7"(2) |
28.2" |
-21.5" |
|
|
The ranking is listed in parentheses (__) when within the "Top 10".
|
| |
| Winter 2024-2025 was about normal in regards to average temperature. |
| Precipitation totals were about 0.7 to near 2.6 inches below normal. |
| Snowfall totals were about 17 to 21.5 inches below normal. |
| Moline saw it's second least snowy winter (DJF). Dubuque had it's sixth least snowy winter and it's ninth driest. |
| Please see Winter Records for seasonal record information. |
| |
| |
| The climate maps below are courtesy of the High Plains and Midwest Regional Climate Centers. |
| Some of these maps become available during the afternoon on the first of the month. |
| |
| |
Average
Temperature
Departure from Mean |
|
Accumulated
Precipitation
Percent of Mean |
|
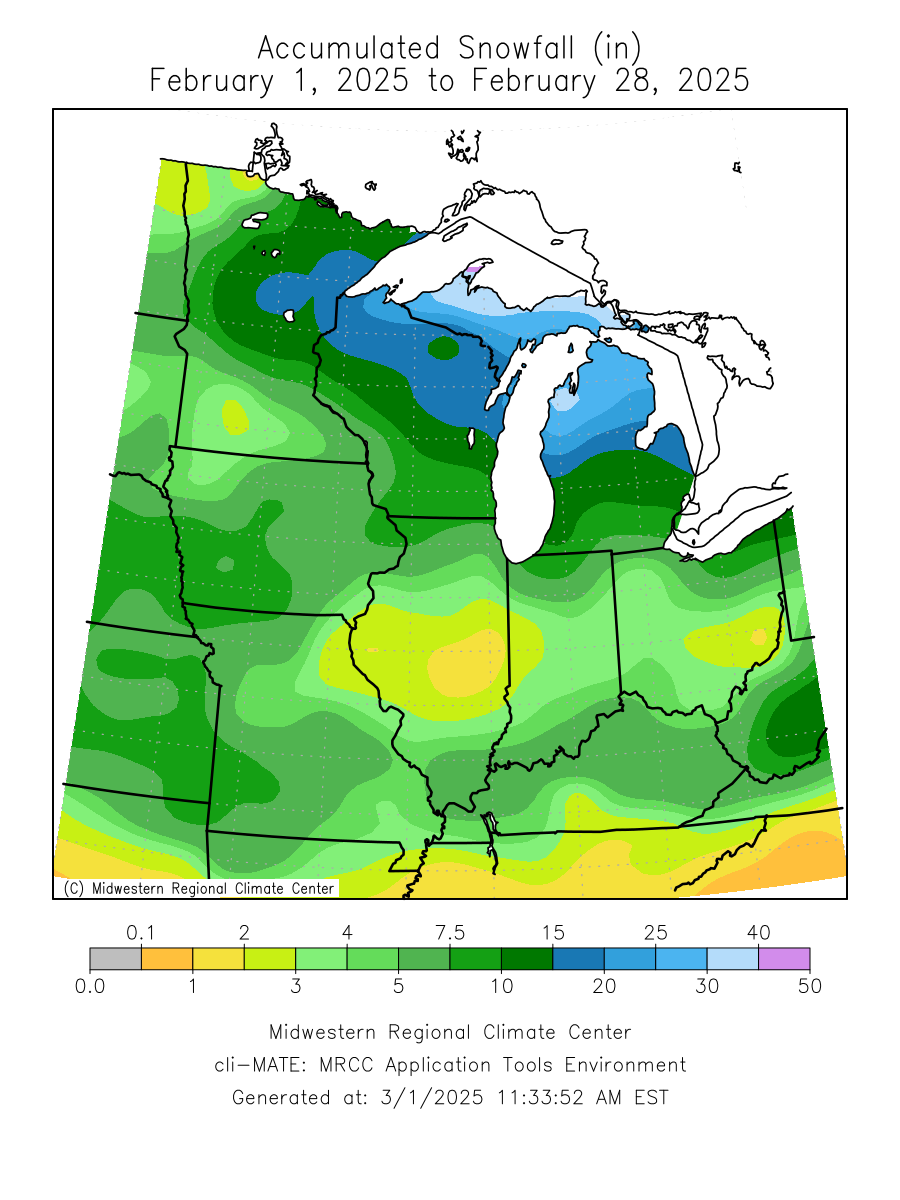
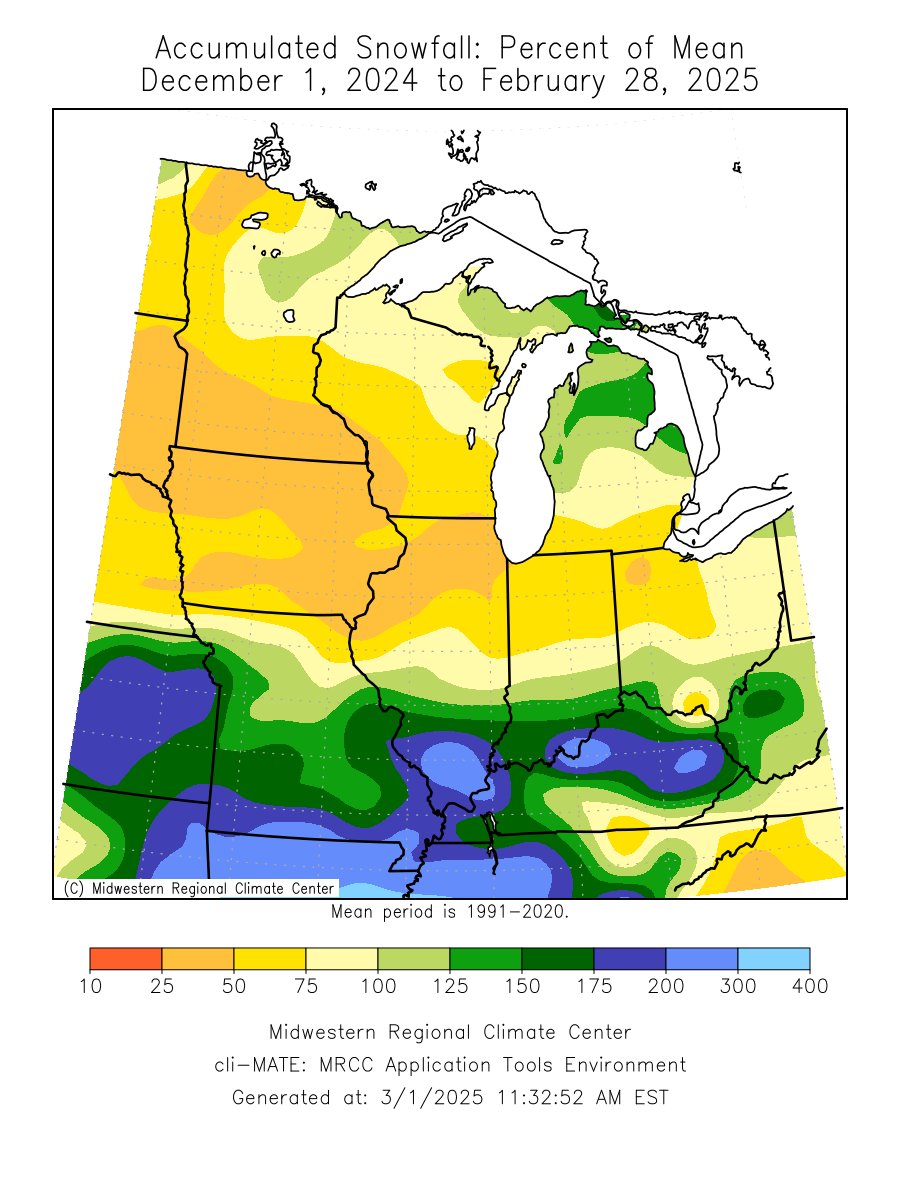
Accumulated
Snowfall
Percent of Mean |
| |
 |
|
 |
|
 |
| |
|
|
|
|
|
| |
Average
Temperature |
|
Accumulated
Precipitation |
|
Accumulated
Snowfall |
| |
 |
|
 |
|
 |
|
| |
| |
| |
| A LOOK AHEAD |
| |
| |
March
Temperature Outlook |
March
Precipitation Outlook |
March - May
Temperature Outlook |
March - May
Precipitation Outlook |
 |
 |
 |
 |
|
| |
| |
| |
| |
|
|