
An outbreak of severe thunderstorms is expected across portions of Illinois and Indiana tonight. Intense tornadoes, swaths of damaging gusts, and hail in excess of 2 inches in diameter possible. Tropical Storm Arthur will continue to produce strong winds across coastal Upper Texas and Louisiana tonight, as well as potentially life-threatening flooding across southern Louisiana into Mississippi. Read More >
Around the time of the Palm Sunday tornado outbreak on April 11, 1965, the area along the Mississippi River had already began dealing with flooding issues. Heavy rain fell across much of the northern Mississippi River region in early to mid April. With the ground still being frozen, the rain and melted snow had nowhere to go except for nearby rivers. Many record crests that were set in 1965 still stand to this day.
On April 7th, 1965, the Cedar Rapids Gazette stated that the state highway commission reported at least 17 highways were closed due to local flooding. About 400 families in Waterloo, Evansdale, and Cedar Falls had to leave their homes as the Cedar River crested.
By April 25th, flooding had driven about 14,000 people from their homes, killed fourteen people, and caused about 125 million dollars of damage. On Wednesday April 28th, the levees in both Quincy, Il and Davenport, IA gave way after being pounded by flood waters.
|
Location |
Flood Stage (feet) |
Crest (feet) |
Date of Crest |
| Rock Island, IL |
15 |
22.48 |
April 28th |
| Dubuque, IA (Railroad Bridge) |
17 |
26.81 |
April 26th |
| Bellevue, IA |
17 |
23.51 |
April 26th |
| Fulton, IL |
16 |
25.03 |
April 28th |
| Camanche, IA |
17 |
24.65 |
April 28th |
| LeClaire, IA |
11 |
17.75 |
April 28th |
| Illinois City, IL |
15 |
23.27 |
April 28th |
| Muscatine, IA |
16 |
24.81 |
April 29th |
The following figures show the amount of precipitation that fell from March 1, 1965 to May 31, 1965 at three various sites. The smooth red line is normal precipitation acculumations and the blue line shows the actual amount that fell during those months. There were above normal precipitation amounts in April and early May.
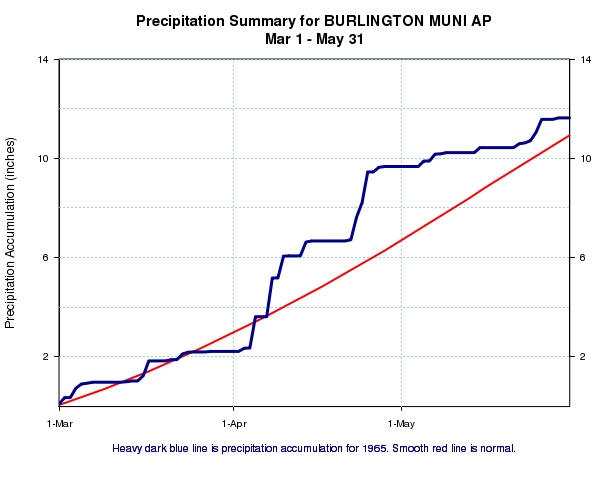 |
| Figure 1: Precipitation amounts in inches at Burlington, IA from March 1 to May 31, 1965 |
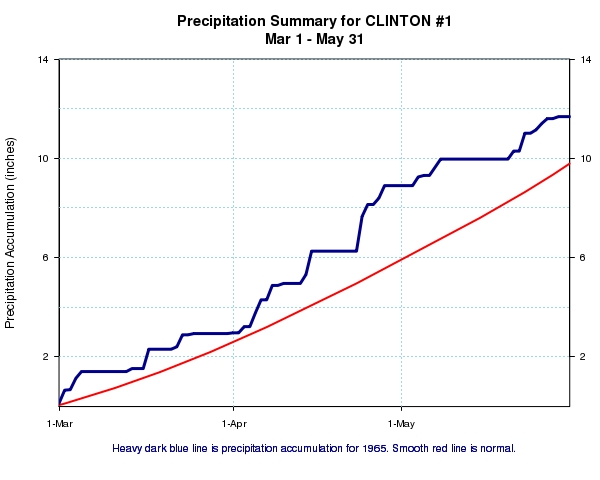 |
| Figure 2: Precipitation amounts in inches at Clinton, IA from March 1 to May 31, 1965 |
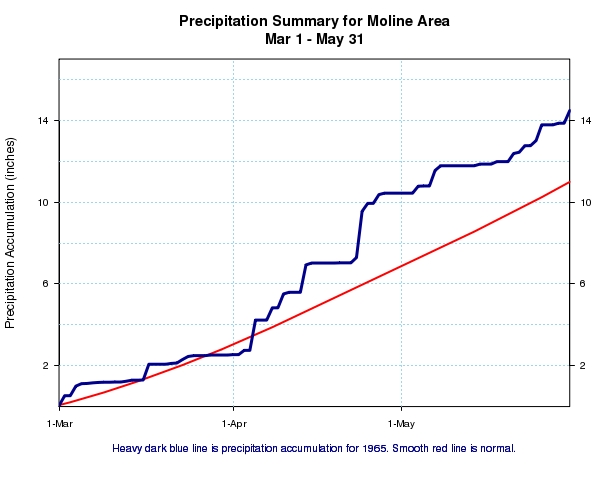 |
| Figure 3: Precipitation amounts in inches at Moline, IL from March 1 to May 31, 1965 |

