|
|
|
|
National Weather Service State College, PA - Spring 2001
Dunham retires by Dave Ondrejik
After 33 years of loyal service to the NWS, Tom Dunham has headed to the greener pastures of retirement.
Upon graduating from Penn State University (we won�t mention the year), Tom spent some time in the Navy before entering the NWS in 1973 in Souix Falls SD.� Within 5 years, Tom moved to Buffalo, NY as a lead forecaster and eventually became the Deputy Meteorologist-In-Charge for 15 years. As a native of Eagles Mere PA, Tom took the first opportunity to head south to and help to spin-up the new office in State College.
Tom will be sorely missed, not only for his wealth of knowledge and skill, but also for his wonderful personality and tennis prowess.
Tom � you will be missed throughout Central Pennsylvania!!!!!!!!!!!!!!!!!!!!!!!!!!!!!!!!!!!!!!!
New Warning Coordination Meteorologist by Dave Ondrejik
I would like to take this opportunity to introduce myself as the new Warning Coordination Meteorologist (WCM) at NWS State College.� Although I have been at the State College office for over 3 years, I had a slightly different focus, with my main duties as a Hydrologist.�
As a native of Johnstown Pa, it has been 11 years since I graduated from Penn State Univ. After graduation, I worked as a Scientist at the Navy/NOAA Joint Ice Center where I forecast the growth and decay of sea ice for shipping and navigation purposes.� In 1993, I moved to the NWS office in Columbus Oh, where I worked as a Meteorologist Intern.� By the end of 1994 I had moved to the NWS office in Wilmington, Oh where I specialized in rainfall forecasting for the Ohio Valley.�
After getting an itch to return home, I moved to the State College office in 1997 as the Service Hydrologist.
I welcome the opportunity to work with this dedicated group of SKYWARN volunteers.� Recently I received my amateur radio license (K3NWS), and have hopes to become more involved (personally and professionally) with the amateur radio groups throughout Central Pennsylvania.
If I can be of any help to you, please don�t hesitate to contact me at: (814) 234-9412 ext 223 or via e-mail at: david.ondrejik@noaa.gov

Dave Ondrejik � K3NWS
The Greenhouse Effects and Global Warming by Mike Evans
The sun warms the earth by radiating energy from space to the earth�s surface.� Most of that energy makes it through the earth�s atmosphere and gets absorbed by the earth�s surface.� The earth is warmed, and some energy from the earth is radiated back through the atmosphere into space. The atmosphere traps some of the outgoing energy and is warmed.� The natural trapping of the earth�s outgoing heat energy is known as the �greenhouse� effect.� Therefore, it can be said that the �greenhouse� effect is a natural phenomenon; without it the earth�s atmosphere would be too cold to support life.�
Gases in the earth�s atmosphere that act to trap outgoing heat energy include water vapor, carbon dioxide and methane.� Water vapor is by far the most important of these gasses.� However, another important heat trapping gas in carbon dioxide.� Since man�s burning of fossil fuels adds carbon dioxide to the atmosphere, it is natural to assume that additional carbon dioxide would mean additional trapping of heat and a warmer atmosphere.� It turns out that the amount of carbon dioxide that man is adding to the atmosphere is not enough to directly cause a large amount of atmospheric warming.� However, the theory on human-induced �global warming� states that just a small amount of warming caused by an increase in carbon dioxide could lead to more warming through a series of positive �feedback� effects. According to this theory, a small amount of warming leads to increased evaporation of water, which leads to more atmospheric water vapor.� Water vapor is a heat trapping gas, and the result would be a more significant temperature rise than what would be caused by just increasing carbon dioxide.
Scientists make predictions on the potential severity of human-induced �global warming� by running computer simulations of the atmosphere. These �climate models� factor in most of the currently known physical properties of the atmosphere, and predict what future temperature will be based on an increase in carbon dioxide.� The most common experiment involves running these models based on a human-induced doubling of carbon dioxide.� The amount of warming depends on the model that is run.� Some models predict as much as 9 degrees Fahrenheit (F) of warming during the next century, while other models only predict a few degrees.� A temperature rise of only a few degrees F may not sound like much, but it should be noted that most of the models forecast the majority of warming to be over land, and at high latitudes, with less warming for the ocean and tropical areas. This would translate into much more warming over the United States.� There has been lots of speculation about what secondary effects a big temperature rise would cause, such as increased drought, increased flooding, extinction of species, and rising sea levels.�
Plenty of scientific uncertainties remain with this entire issue.� While some scientists/media have implied that there is a strong consensus that disastrous global warming is inevitable unless drastic action is taken, that is not, in fact the case.� Many scientists do believe that a significant warming is highly likely during the next century, but there are also scientists who believe that little warming will occur, or at the very least, we do not know enough to make an accurate prediction.
One issue that needs more attention is the question about how much human-induced warming has already occurred. To answer this question, we need to know how much of the recently observed warming is natural, and how much is man-made.� Natural cycles of warming and cooling have always taken place.� Also, we need to know exactly how much warming has taken place worldwide during the last century.� Current estimates are that the earth has warmed about 0.6 degrees F in the last 100 years.� However, accurately measuring the temperature of the earth�s atmosphere to within a few tenths of a degree is difficult.� Potentially inaccurate or incomplete temperature measurement over the oceans and in under-developed countries, as well as complications from urban heat islands, makes this a very difficult issue.
Another issue that needs more attention involves improving the climate models that are making the predictions of warming.� One area of improvement that is needed is in the area of forecasting atmospheric water vapor and cloud cover.� Another area where new discoveries are just now being made is in the area of how ocean circulation cycles can trigger and control climate variations. The accuracy of the models will improve as more is learned about all of these things.
So, there you have it.� I think I will wait around until the year 2350 to see how things work out.
On Saturday, September 29, the NWS State College office and the Middle Atlantic River Forecast Center will hold an Open house from 10 am to 3 pm. Tours of both offices will be offered along with severe weather videos, and explanations on weather and hydrologic forecasting.� Watch our web page (http://www.nws.noaa.gov/er/ctp) for further information and directions to the office.
Weather Safety on the Internet
As we enter the new severe weather season, it is time once again to review our weather safety information.� Plenty of information can be found on our Internet web page at: http://www.nws.noaa.gov/er/ctp/safety.html
Staying calm in a weather emergency situation is one of the most important factors.� Be prepared ahead of time!!� Know where to go during a severe thunderstorm or tornado warning before it is issued.� If a flash flood warning is issued and you live near a stream or river that is expected to flood, have a pre-planned evacuation route.
Know where to go before the event hits is the key to safely surviving the storm.
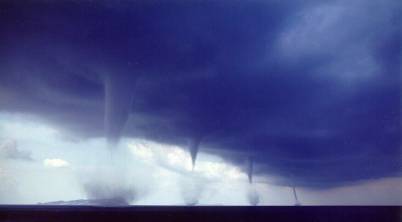
This picture of 4 simultaneous tornadoes was taken in Italy in April 2001.
Central Pennsylvania Winter Summary 2000-2001 by John La Corte
The winter of 2000-2001 was a remarkable season over much of the northeastern United States. A marked contrast to the previous two warm and relatively snow-less winters, this year�s winter saw a return to cold and snow in many locations. Perhaps the most remarkable aspect of the winter was the late flurry with which it ended over much of New York and New England. Several coastal storms resulted in record late season snows. Many sites such as Binghamton and Rochester New York, Burlington Vermont and Portland Maine all received more snow in March alone than the reporting sites of central Pennsylvania had all season!
In our area, the traditional winter (December through February) will go down as a cold and dry one, but the statistics are a bit misleading.
After starting off the winter on a particularly harsh note, the months of January and February ended up rather mild and dry here in central Pennsylvania. Looking at data for Williamsport and Harrisburg showed that December started off with near record cold and above normal snowfall. Harrisburg saw the fourth coldest month of December on record with an average temperature of just 26.5 degrees. This was more than seven degrees below normal. January and February recovered nicely however. January temperatures were near or slightly above normal and February continued the trend ending up much warmer than normal. As well as ending warm, January and February were drier than normal in Williamsport and Harrisburg. Averaging as much as 1.5 inches of rain below normal, this equated to snowfall deficits a little below normal in Harrisburg, to several inches below normal in Williamsport.
So while the season�s numbers will record a colder than normal winter, in fact here in central Pennsylvania it could have been much worse. Our neighbors to the north got far more use out of their snow shovels. Several stations saw more than 100 inches of snow, with Buffalo topping the chart with more than 13 feet of snow!
Improving Our Ability To Anticipate Tornadic Events by Richard Grumm
In October of 1999, the National Weather Service office in State College and the Pennsylvania State University began a program to help forecasters identify significant weather events.
A web page was established at http://eyewall.met.psu.edu/�� At this site, forecasters and �weather hobbyists� can find a wide range of forecast products.� The goal of these products is to help forecasters identify weather events that have the potential to produce unusual weather.
In addition to the forecast products, there is a web page that provides rankings of weather events at http://eyewall.met.psu.edu/ranking/ranking.html.
The rankings include all weather events since 1 January, 1948 and the page is updated monthly.�� Events are rated by categories including the top-20 strongest events of all time and the top ten events for each month of the year.� The domain
includes the eastern United States and the western Atlantic.
The famous super storm of March 1993, which produced record snows in Pennsylvania, ranked 3rd overall and was the single strongest event in the month of March.� The late season snowfall of 15-16 May 1976 was associated with 2nd strongest weather event during the month of May.
The Climatological data can be used to rank storms and see what conditions looked like during past significant weather events. The data can also be used to see how the current forecasts compared to the Climatological data used in the ranking system.� Over the past year, we have found that we can identify many unusual weather events well in advance using the current forecasts and the climatological data. Using these data, we have identified some unique characteristics of Pennsylvania tornado events, which could be identified in model forecasts well in advance of their occurrence.
We have determined that all large tornado outbreaks appear to be related to the passage of a very strong surface low across the Great Lakes and a very strong low-level jet.� In fact, since 1948, there has not been a major Pennsylvania tornado outbreak that was not associated with these features. It is type of information will help us do a better job anticipating tornado events in the future.
Middle Atlantic River Forecast Center (MARFC) Advanced Hydrologic
Prediction Services (AHPS) Demonstration Project by Ned Pryor
Advanced Hydrologic Prediction Services is a National Weather Service (NWS) program designed to provide longer-range hydrologic products including flood outlooks, drought products and water supply guidance. This improved capability builds on the traditional expertise and responsibility of the NWS flood forecasting program and will ultimately provide the public, emergency management agencies and water resource organizations with a wide suite of water resources products.
AHPS forecasts also provide information about forecast uncertainties, which can be beneficial to end-users.� These longer-range products will include probabilistic (e.g. there is a 25% chance that the river will exceed flood stage at a given location during the next 7 days) information, mostly in graphical format, to describe the likelihood of various hydrologic scenarios.
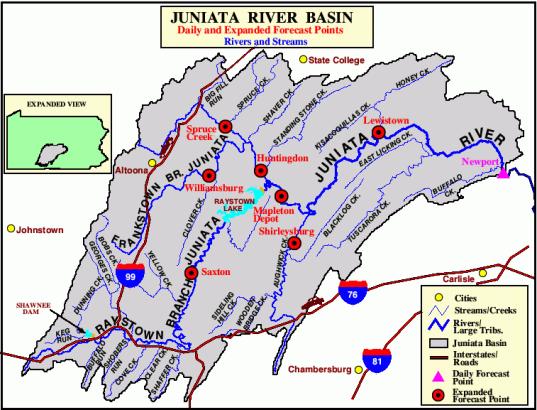
MARFC has selected the Juniata River Basin in south-central Pennsylvania to demonstrate some of the AHPS capabilities and product formats.� The Juniata River Basin is approximately 3350 square miles above Newport, Pennsylvania and includes the Frankstown Branch Juniata River, the Raystown Branch Juniata River, Raystown Dam, the Little Juniata River, Aughwick Creek and Tuscarora Creek.
Two key programmatic components need to be in place for AHPS to work in a given watershed.�
First, the basin must be calibrated with a continuous rainfall-runoff model so that the hydrologic computer model (which incorporates rainfall processing, snow modeling, rainfall-runoff calculations, evapotranspiration estimates, baseflow runoff, hydrologic routings, reservoir operations) can be run for extended periods of time.
Secondly, an NWS program entitled Ensemble Streamflow Prediction (ESP) must be set up for the basin of interest so that various probabilistic forecasts of streamflow can be generated.�
The ESP system enables hydrologists to make longer-range probabilistic streamflow forecasts based on the current hydrologic conditions (river and reservoir levels, soil moisture conditions, and the extent and characteristics of any snowpack) along with 40 years of historical temperature and precipitation data.� ESP generates one streamflow trace for each year of historical meteorological data with each model run initiated to the current basin hydrologic conditions.� A probabilistic forecast is then generated by statistical analysis of the streamflow traces for the flow variable of interest (maximum flows, minimum flows, mean daily flow volumes) over the time period of interest.
Examples of AHPS graphical products include Trace Ensembles, Exceedance Probability Plots and Probability Interval Histograms. Visit MARFC's website at http://marfchp1.met.psu.edu and click on "AHPS" to view samples of these AHPS products.� Continue to check back during the next several months as additional AHPS products are developed and posted to the website.
A new Senior Service Hydrologist has been hired to watch over central Pennsylvania�s rivers and streams.� Peter Jung has been at this office for over 8 years, where he has worked numerous flooding and flash flooding events, including the Jan 1996 flood.� Pete has previously been stationed at the NWS offices in Syracuse, NY and New York City.
Pete has a wealth of meteorological and hydrological knowledge and the citizens of central Pennsylvania will benefit from his experience.� Please join me in congratulating Pete on his selection.

Senior Service Hydrologist, Pete Jung


 Send Us a Report