2018 was extremely wet for Pennsylvania and there are many ways to show how wet it was. We'll attempt to contextualize the year that was in a variety of ways.
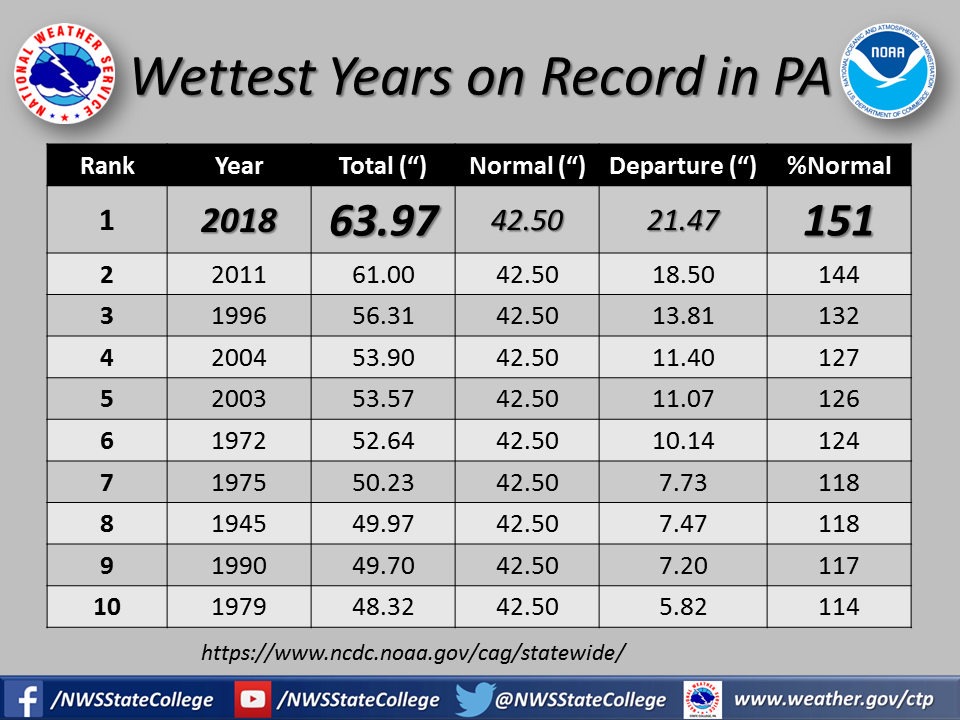
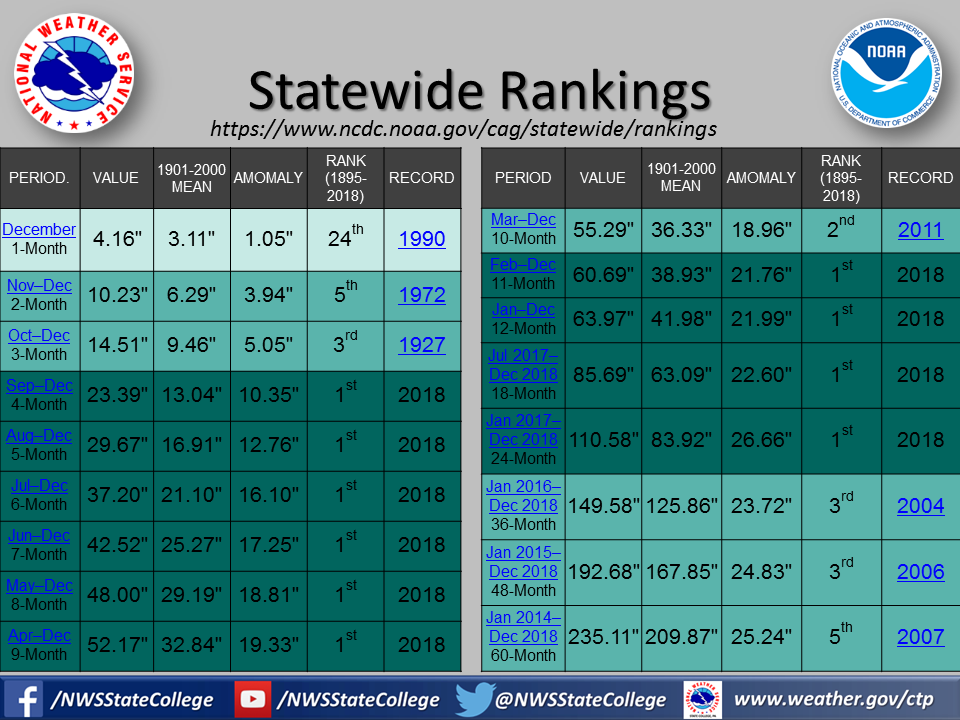
First, we look at statewide rainfall totals averaged across the state by the National Center for Environmental Information:
Data from the National Center for Environmental Information: https://www.ncdc.noaa.gov/cag/statewide Data from the National Center for Environmental Information: https://www.ncdc.noaa.gov/cag/statewide/haywood Data from the National Center for Environmental Information: https://www.ncdc.noaa.gov/cag/statewide/timeseries Data from the National Center for Environmental Information: https://www.ncdc.noaa.gov/cag/statewide/rankings
Statewide Rainfall - Rankings
Statewide Rainfall - Haywood Plot
Statewide Rainfall - Time Series
Statewide Rainfall - Rankings by Month
.png)
.png)
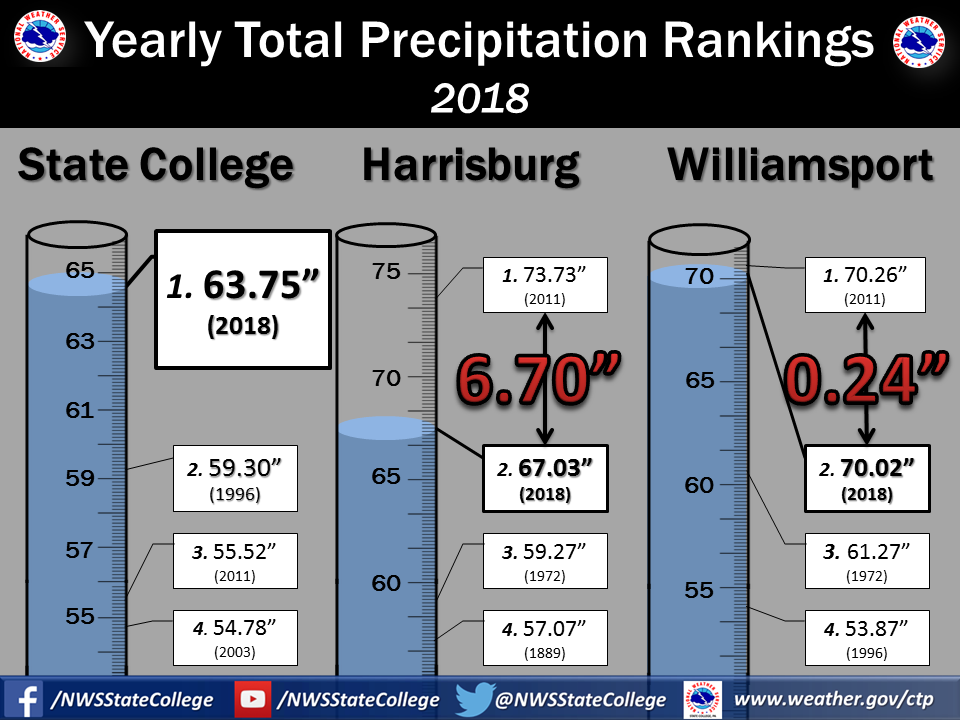
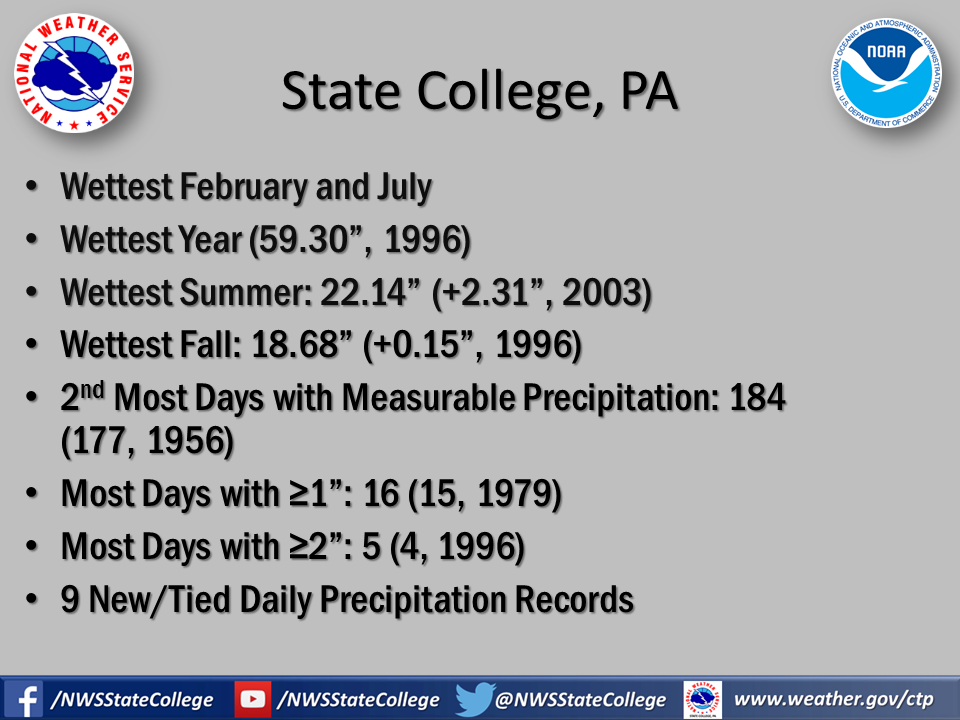
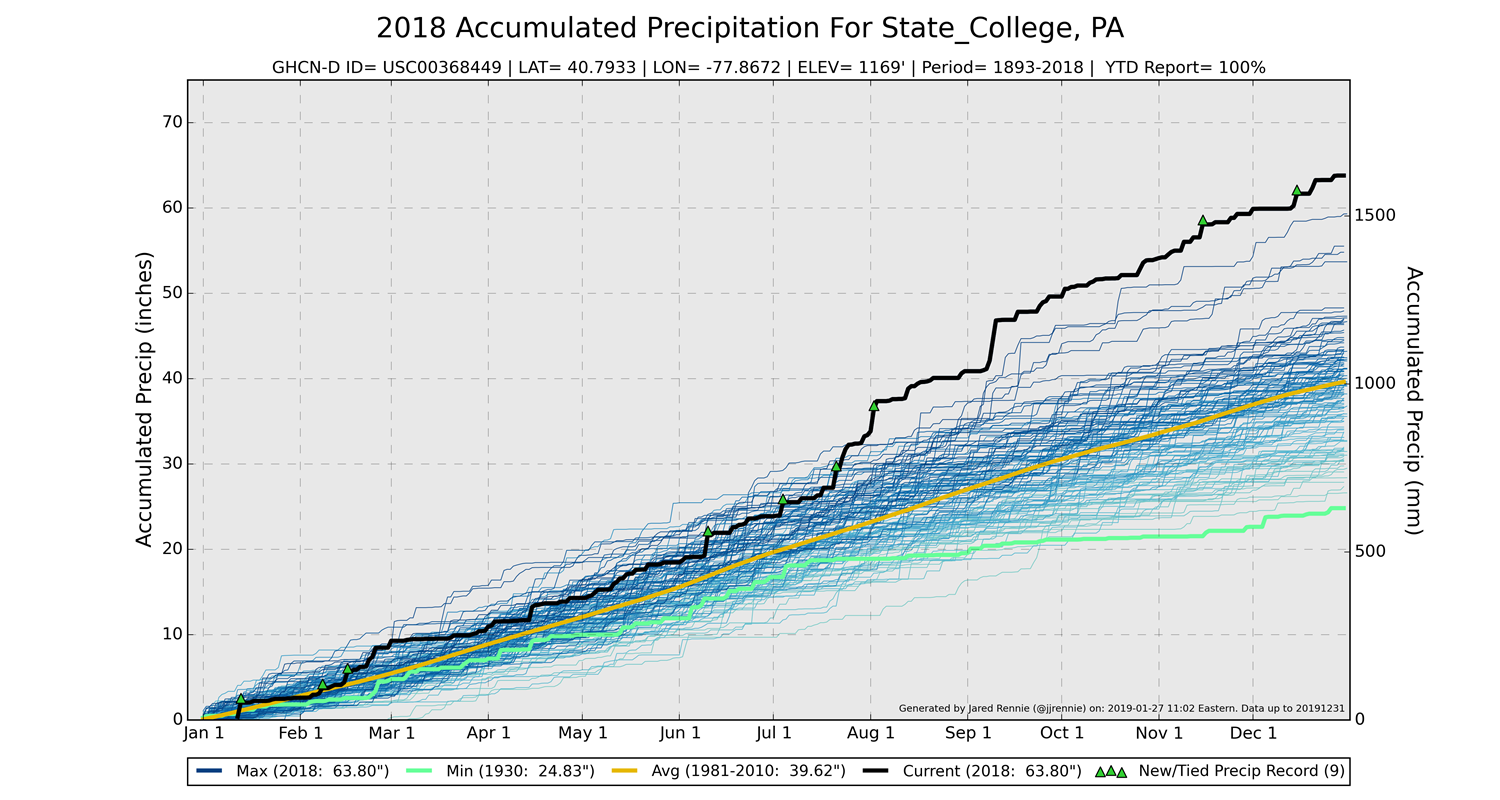
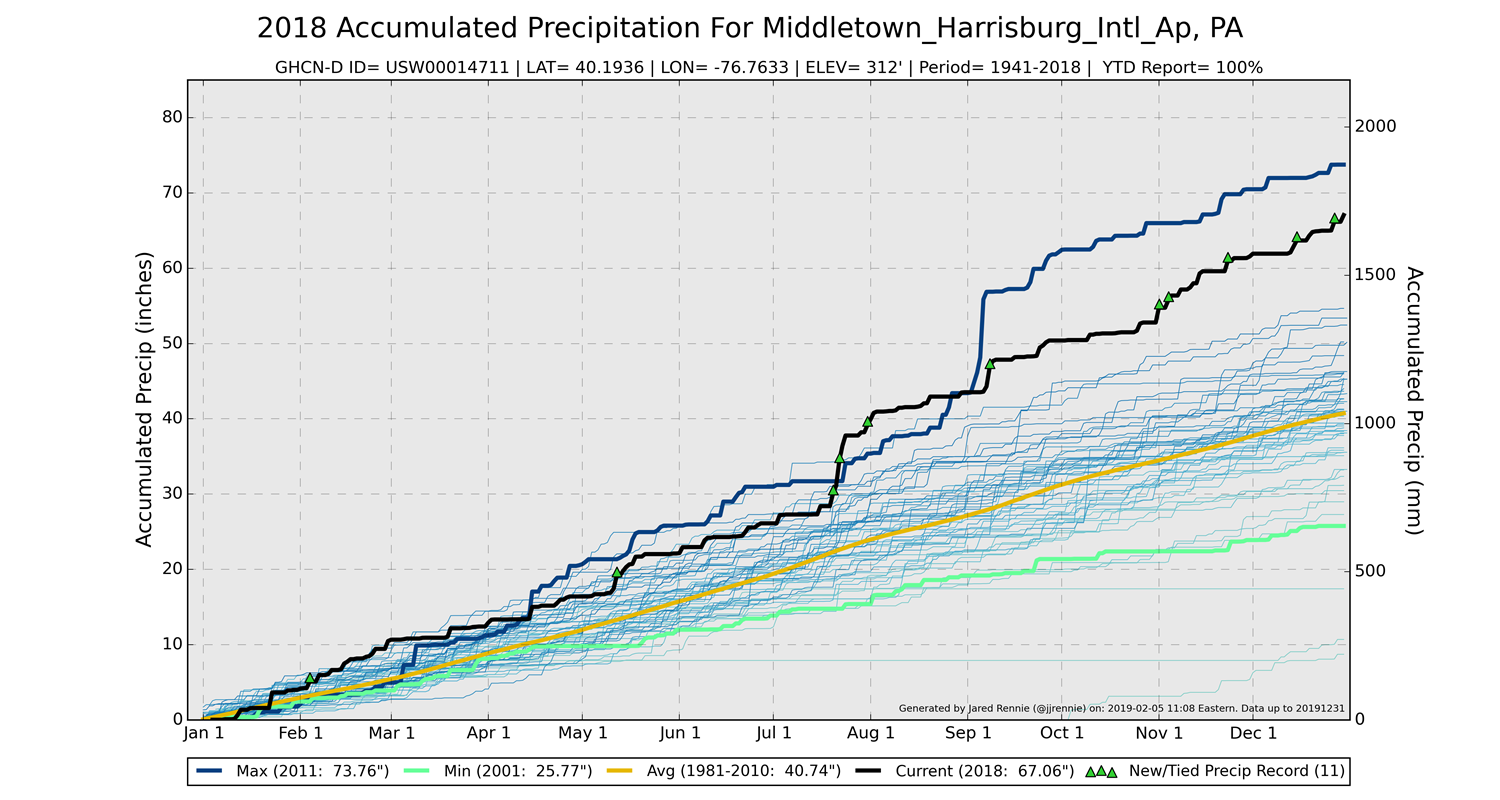
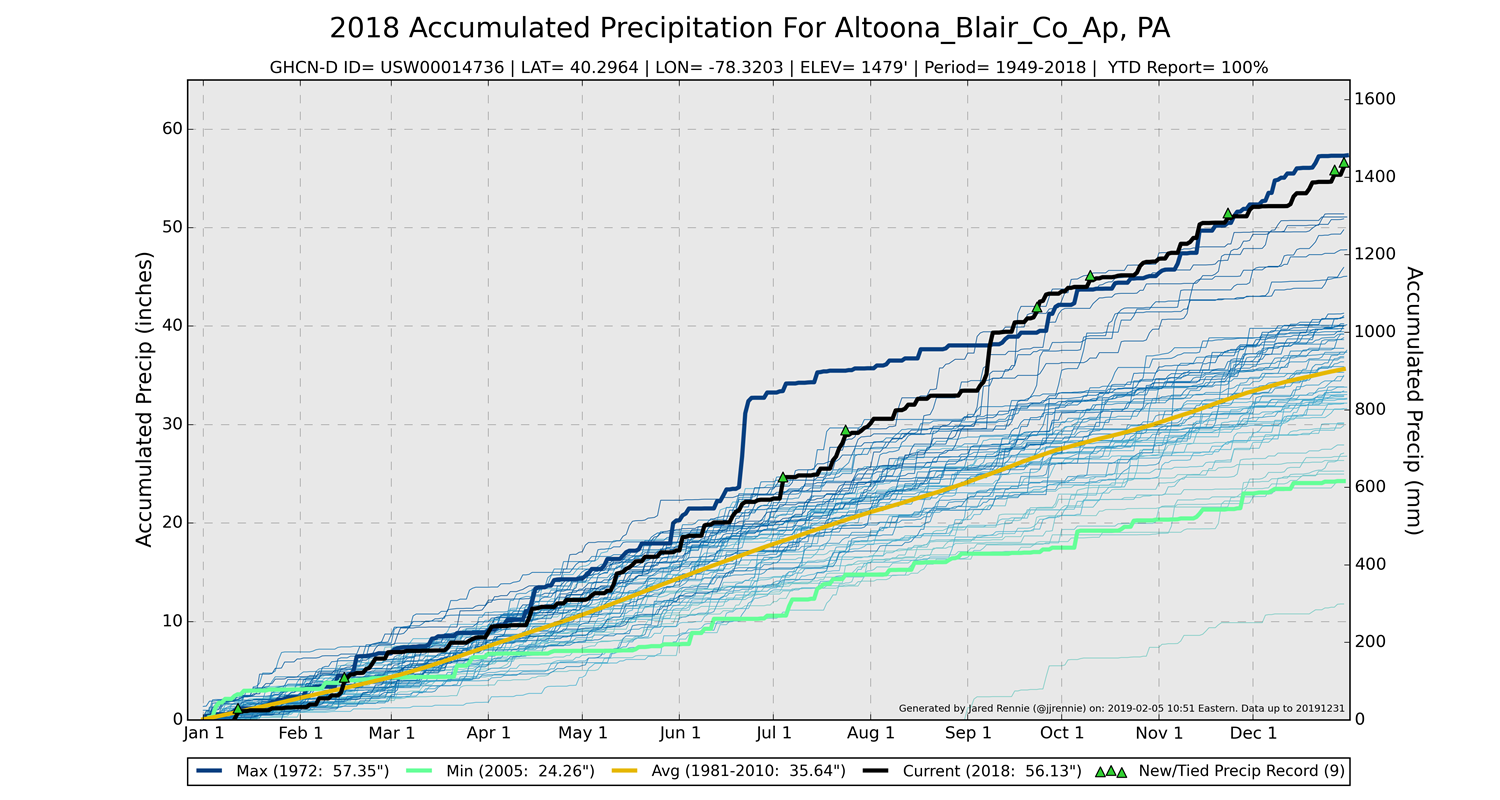
Now we can look at a few individual stations. Note that 2018 was a pretty average year until late July.
Record information from xmACIS. Accumulation time series from the North Carolina Institute for Climate Studies and Jared Rennie. Record information from xmACIS. Accumulation time series from the North Carolina Institute for Climate Studies and Jared Rennie. Record information from xmACIS. Accumulation time series from the North Carolina Institute for Climate Studies and Jared Rennie. Record information from xmACIS. Accumulation time series from the North Carolina Institute for Climate Studies and Jared Rennie.
Yearly Total Precipitation Rankings
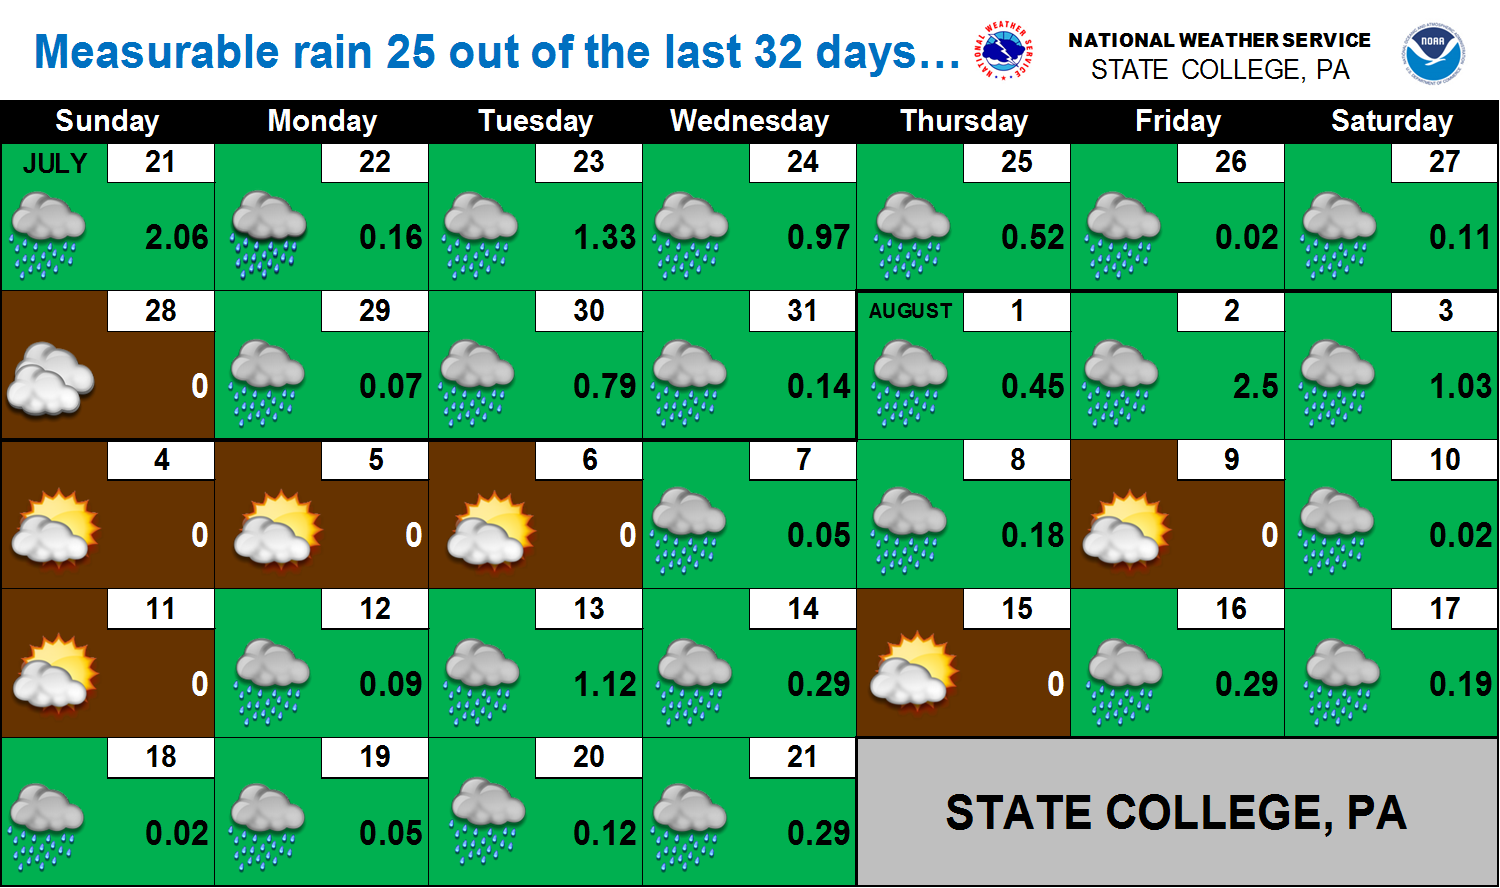
State College
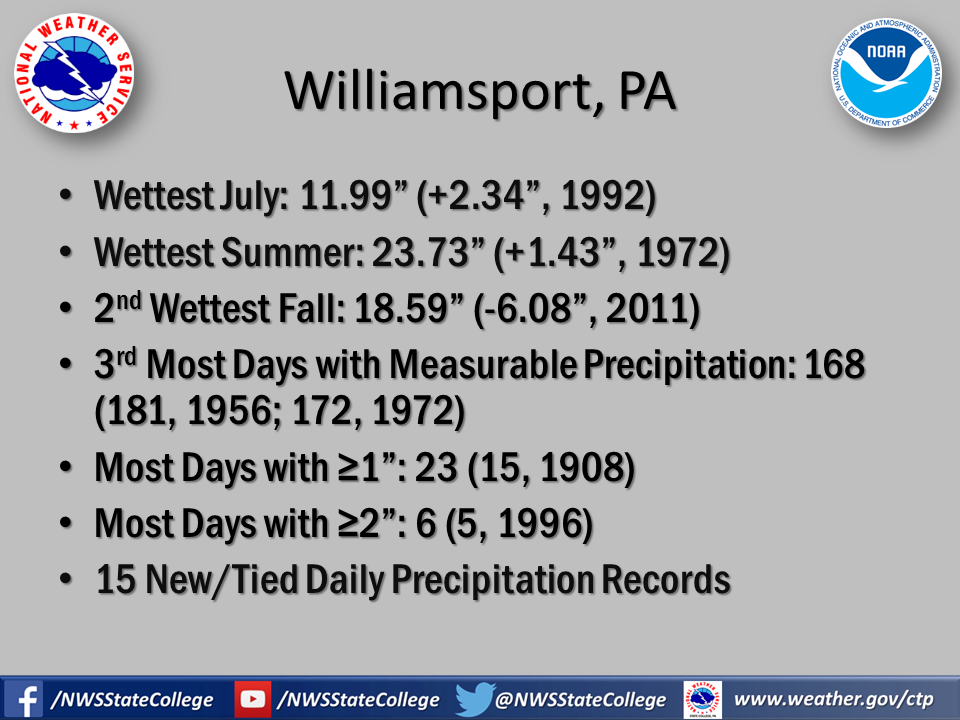
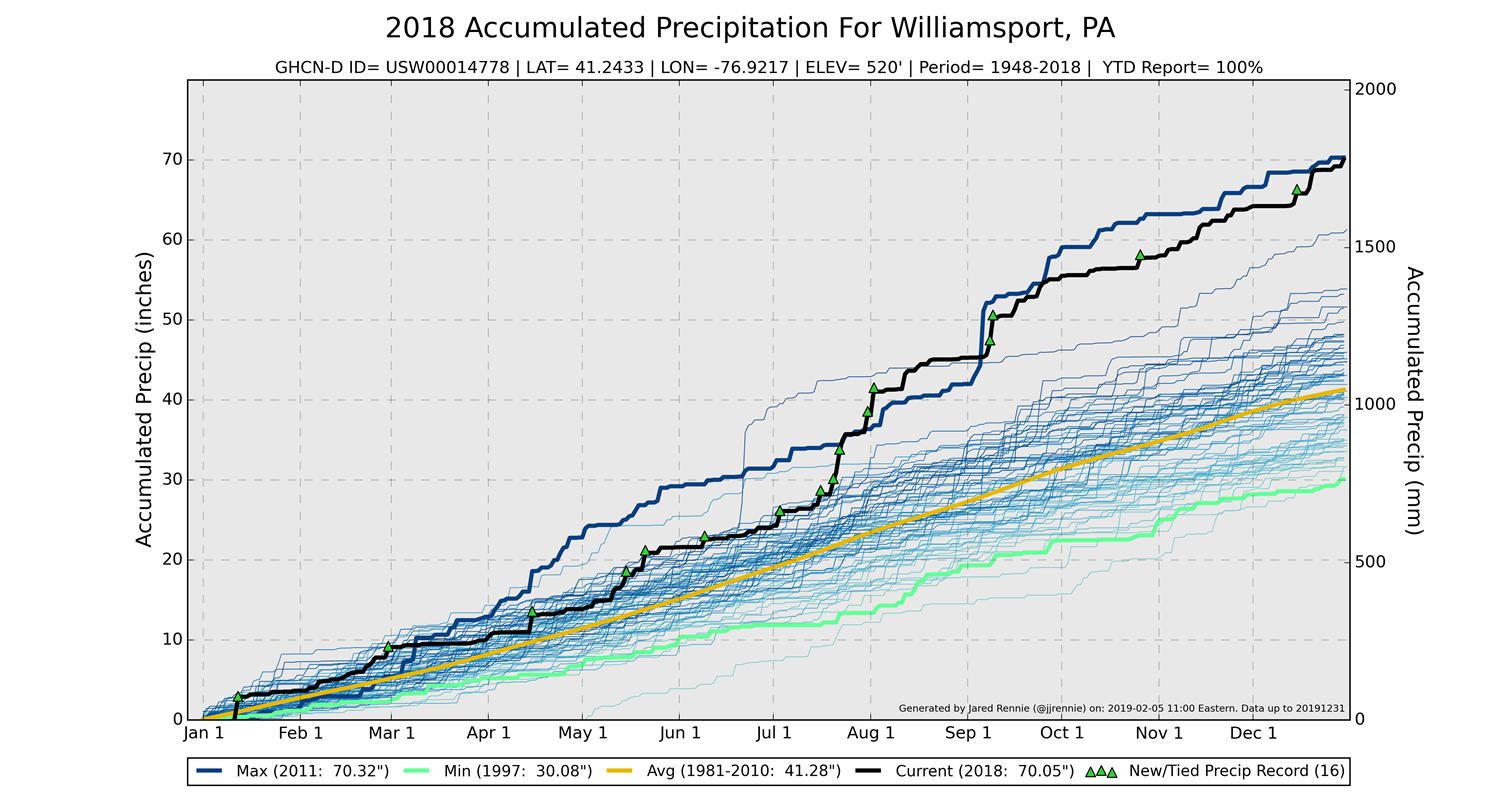
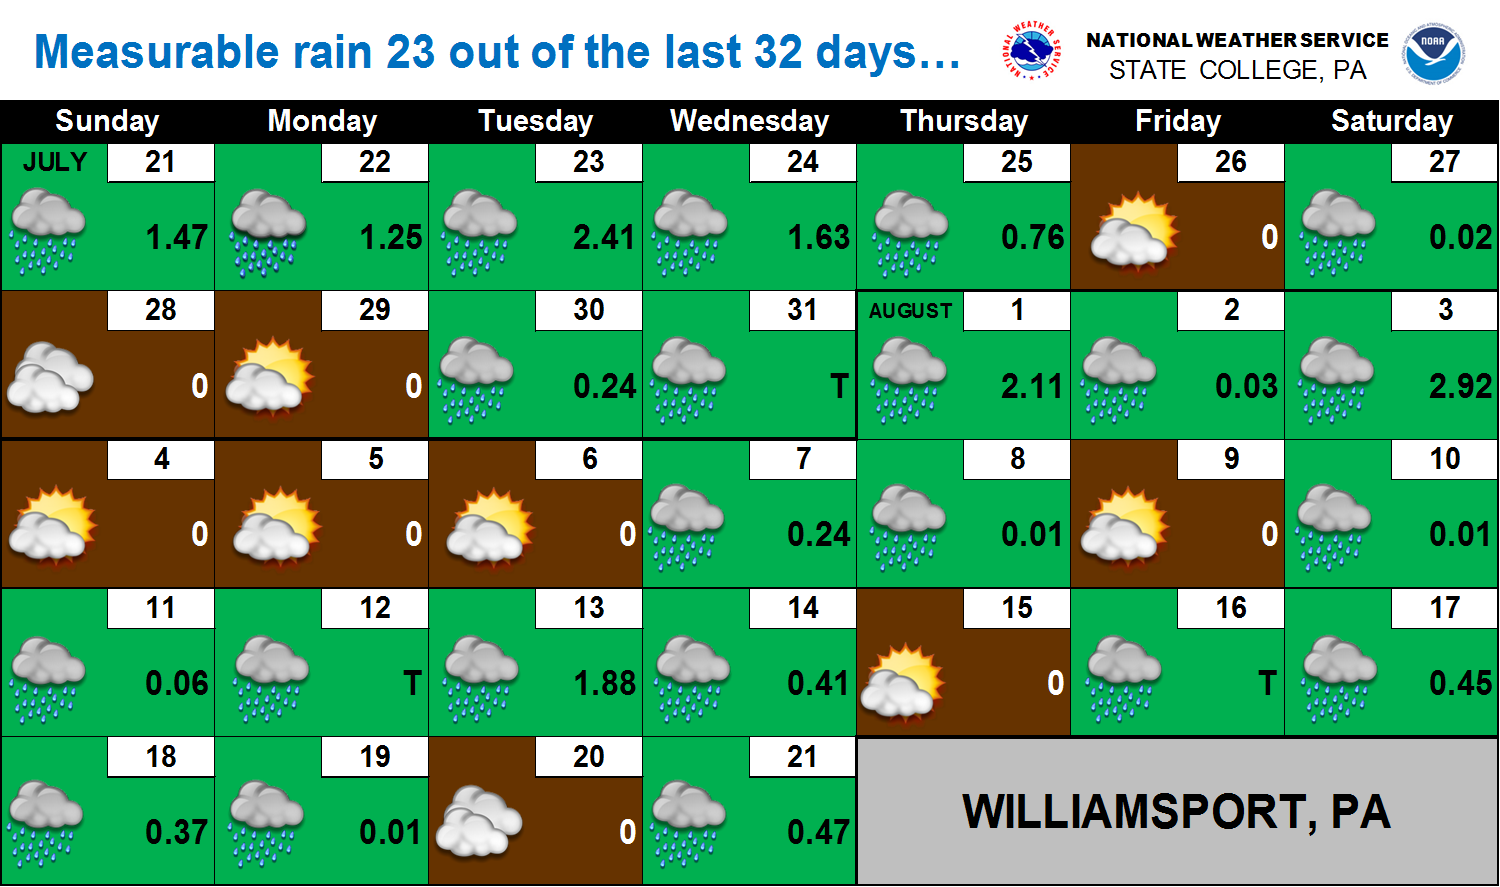
Williamsport (IPT)
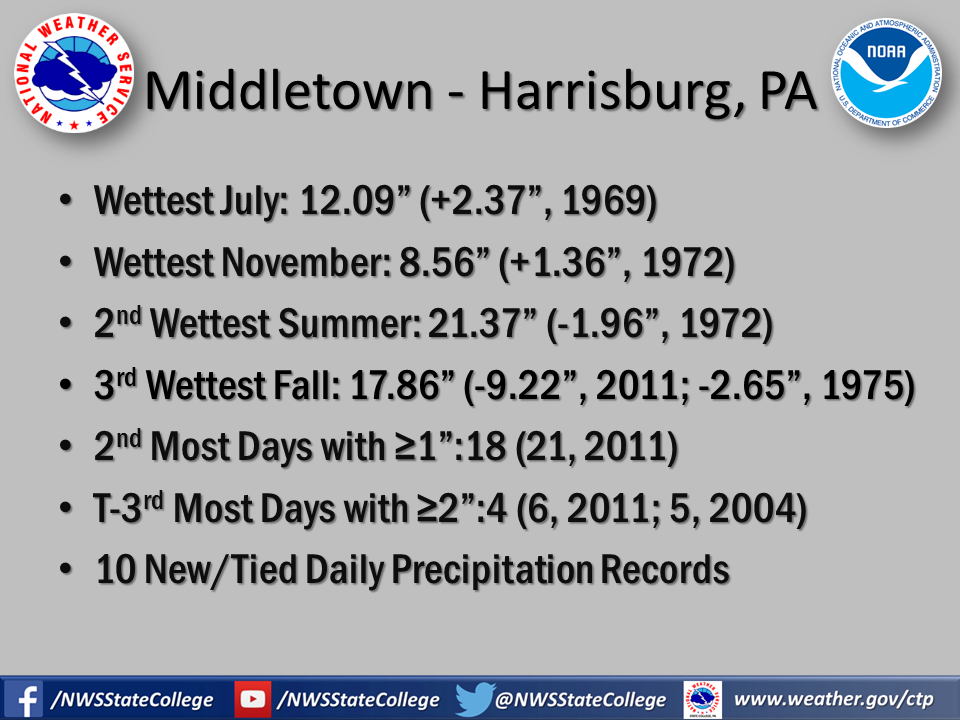
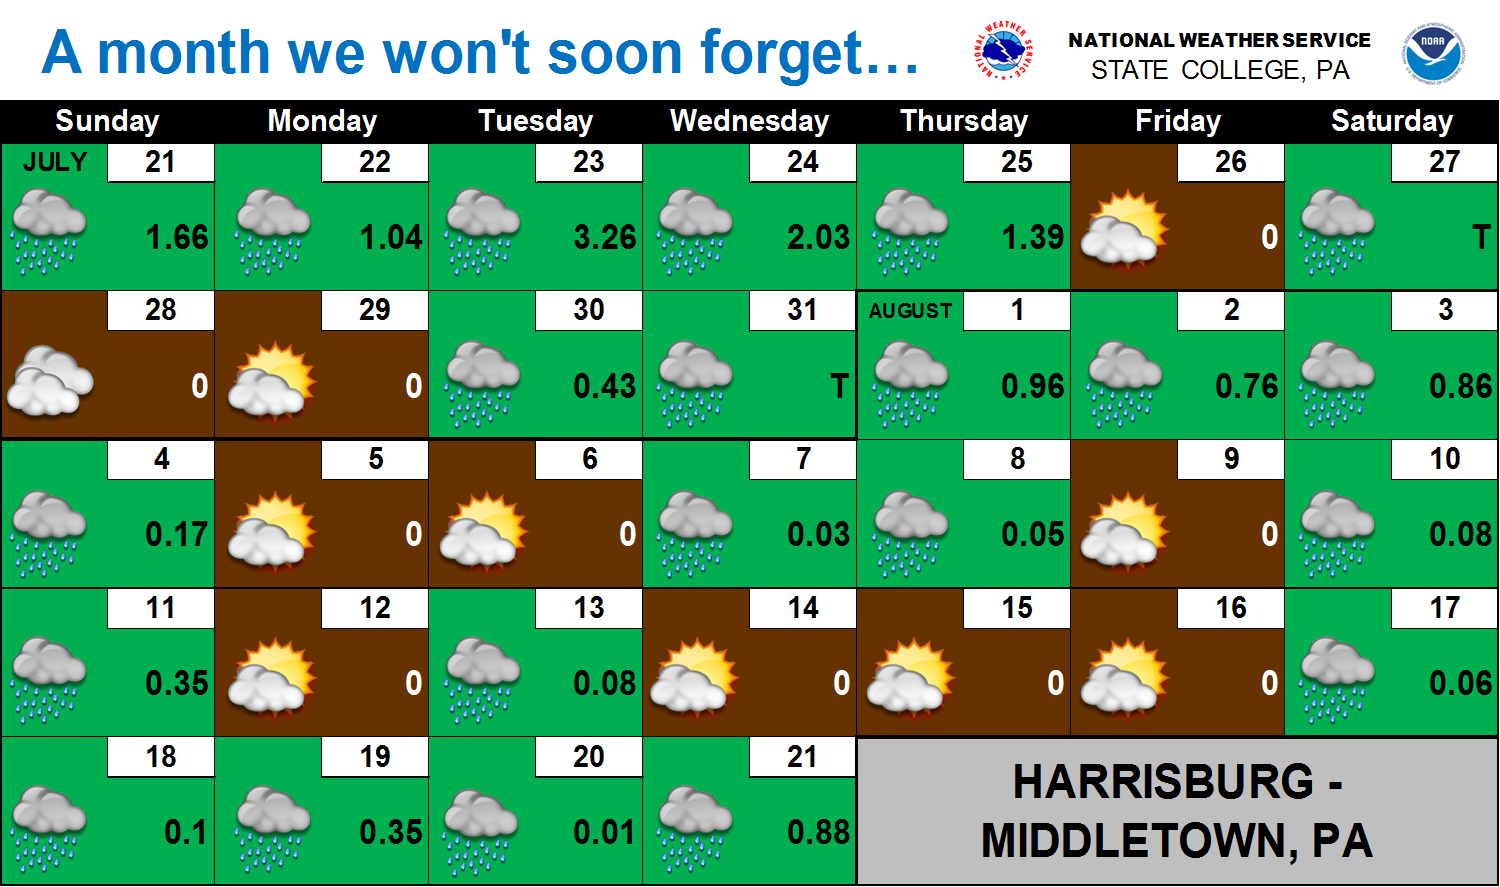
Middletown - Harrisburg (MDT)
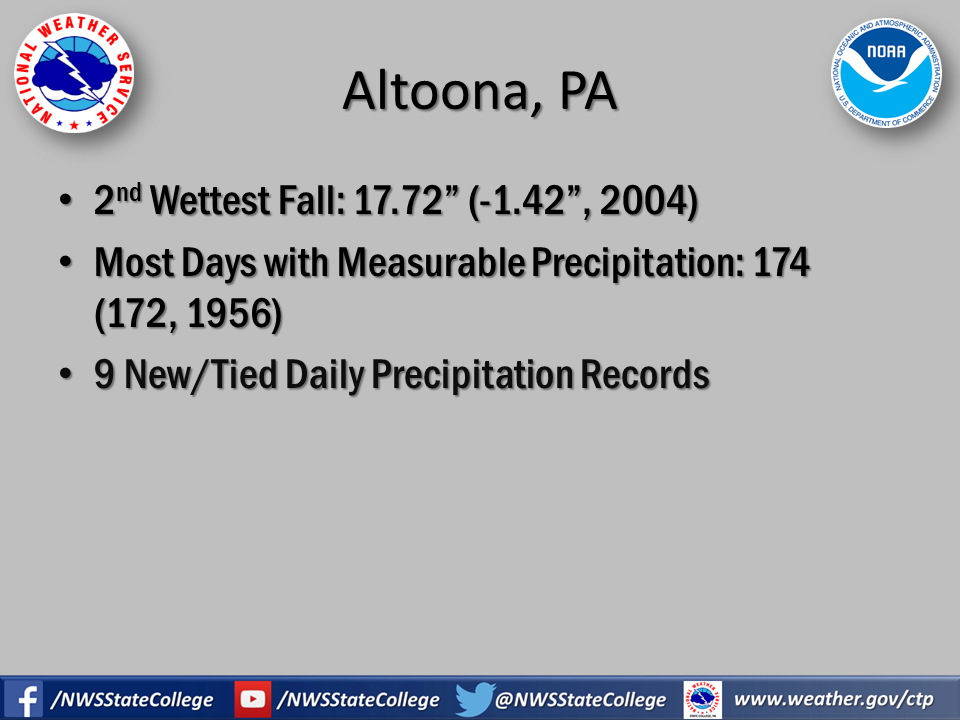
Altoona
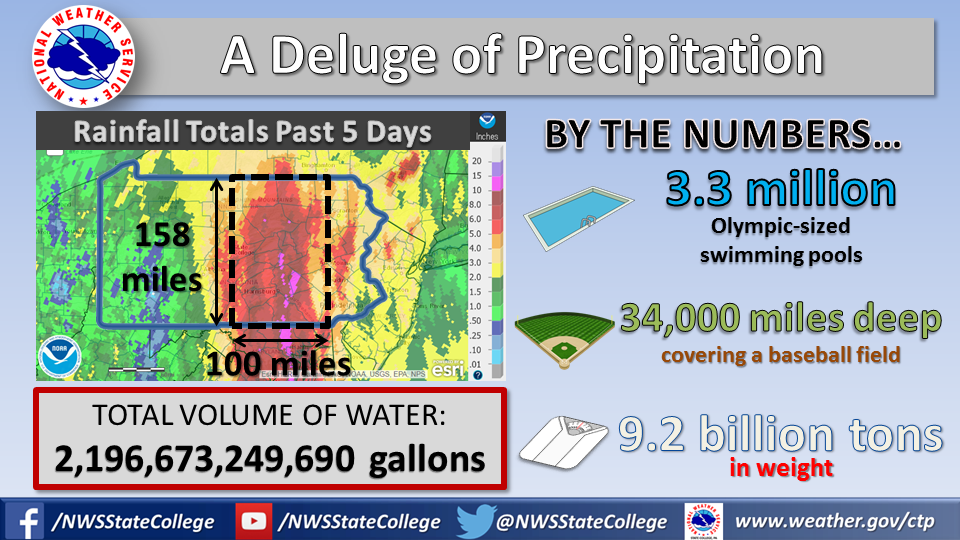
Let's now look at a few of the major events from 2018:
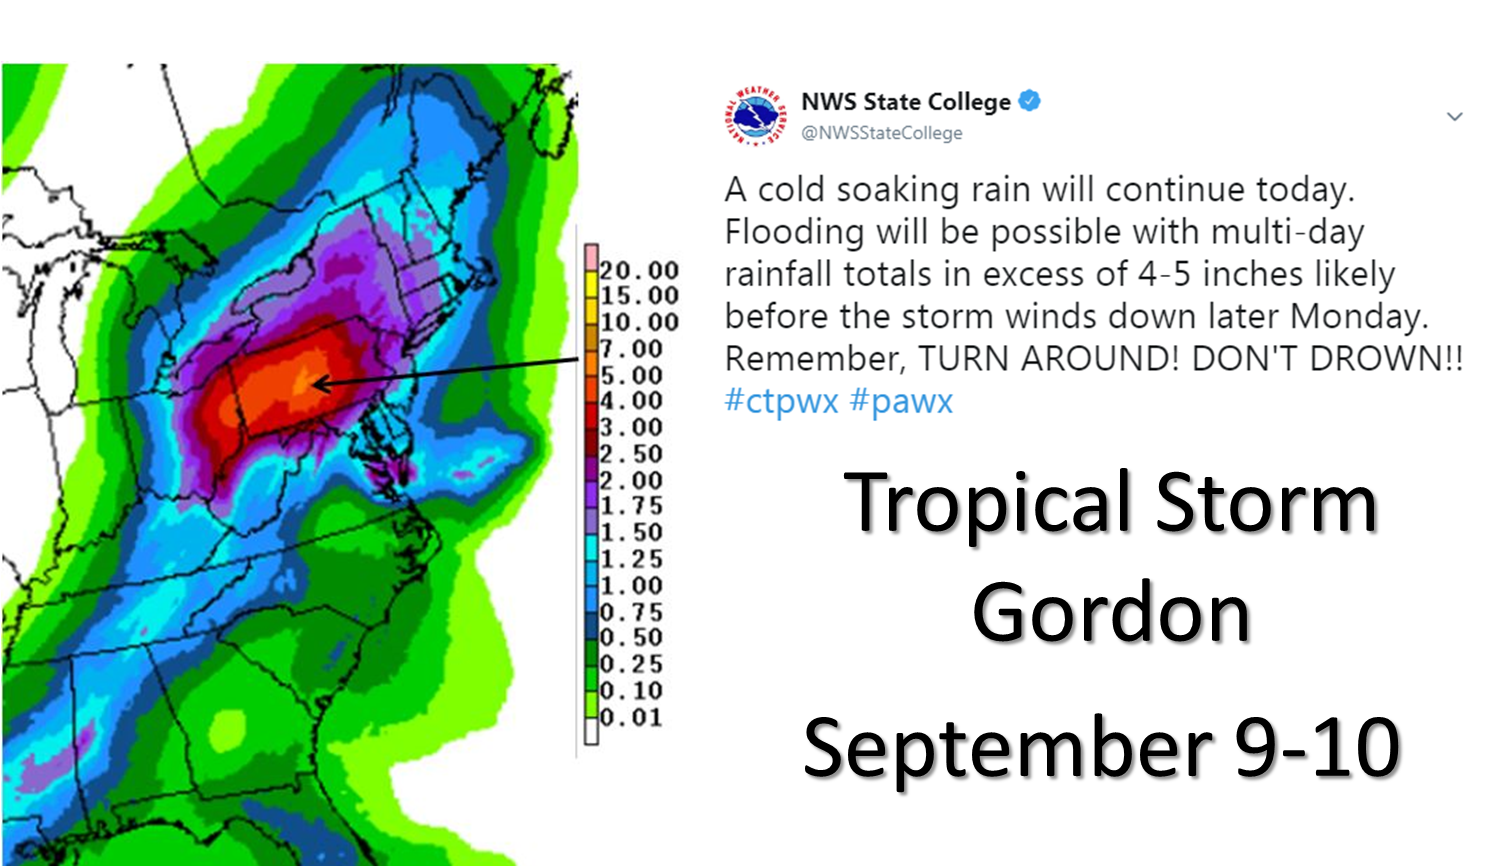
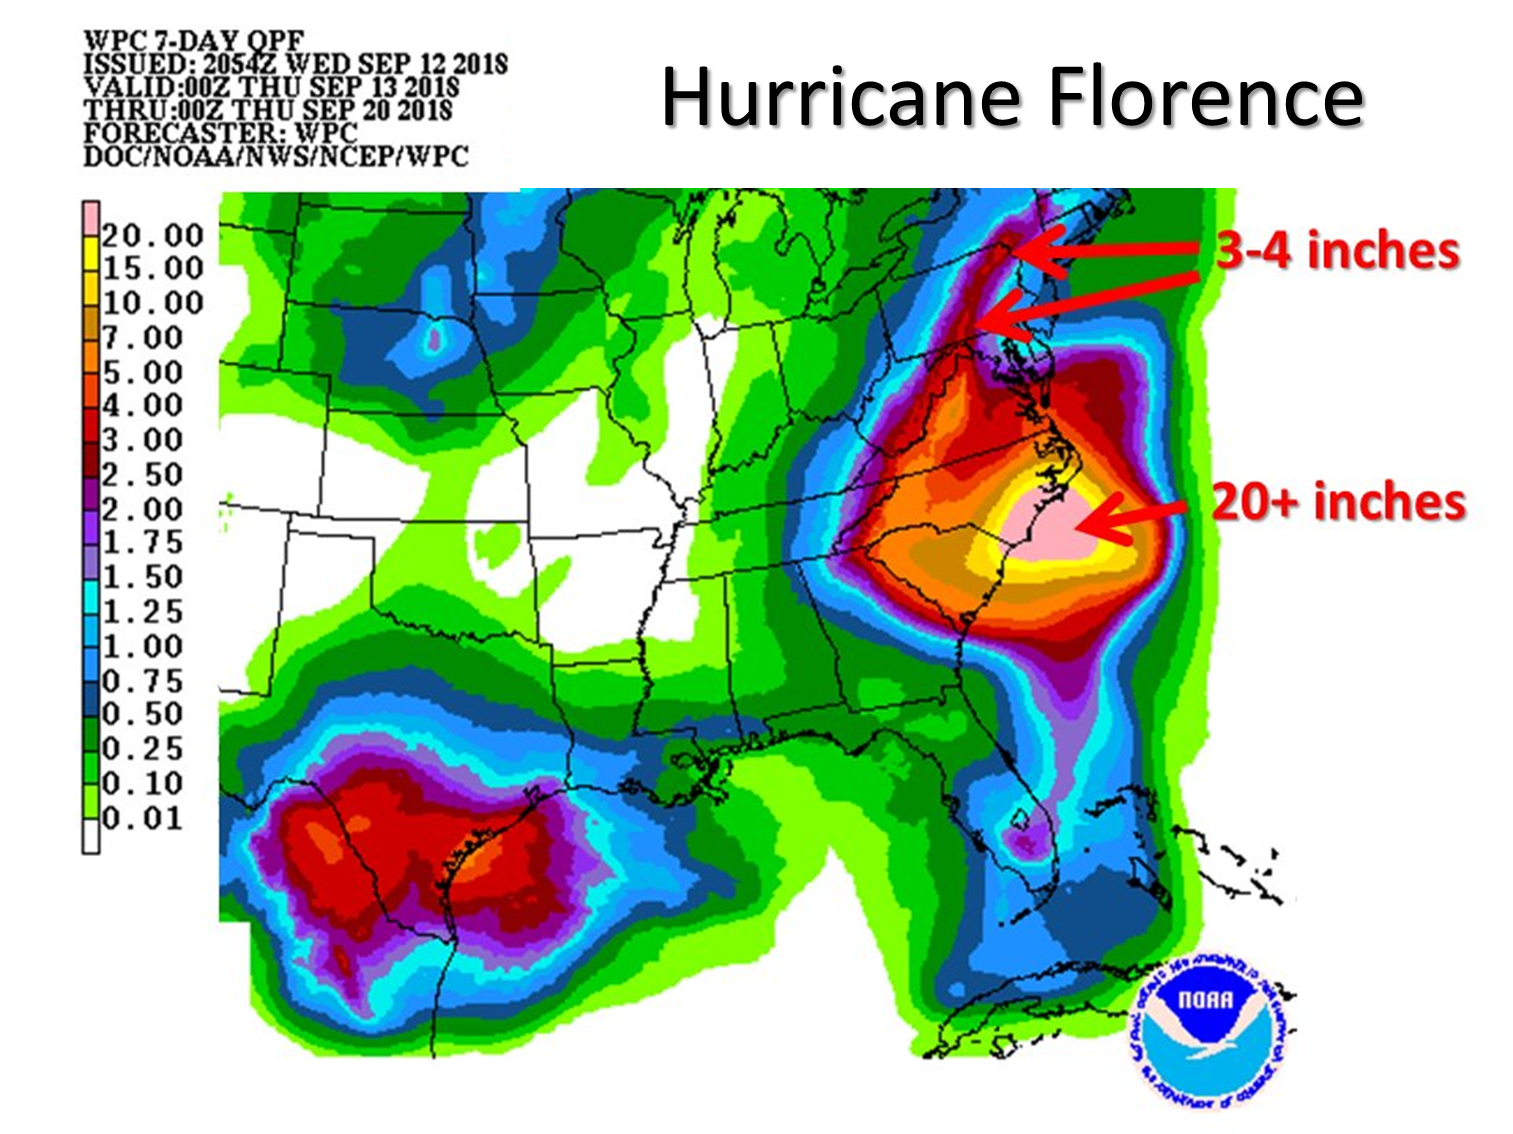
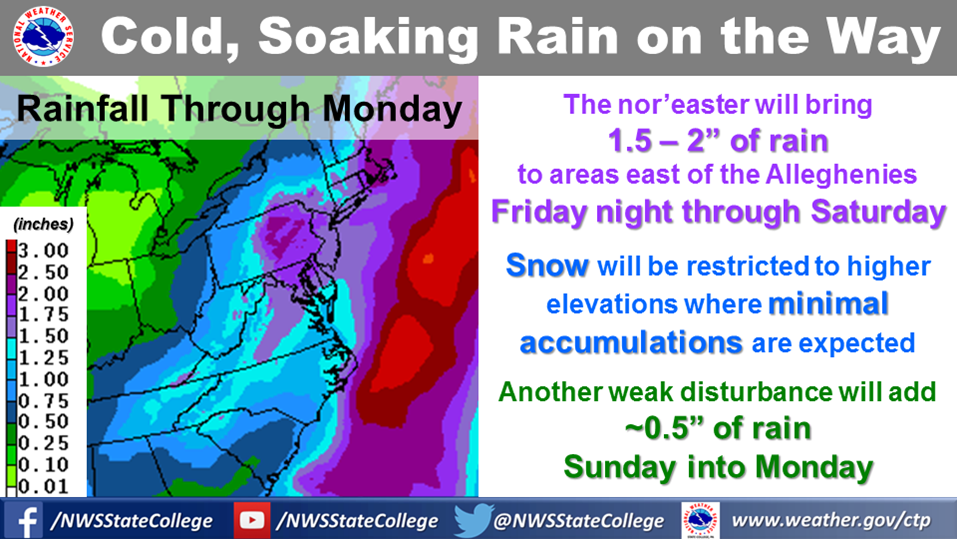
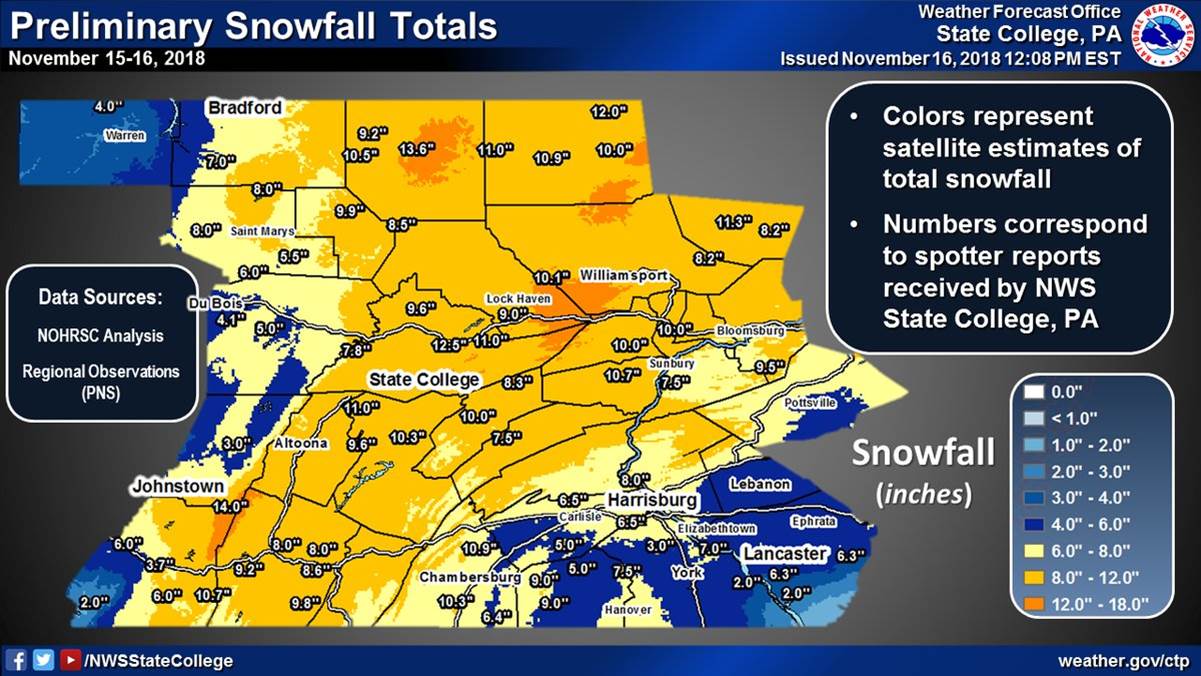
A deep stationary upper level low pressure system parked over the Ohio valley produced widespread rainfall starting July 21, 2018 and continuing for the next 7-10 days. A series of disturbances brought 8"+ of rainfall to much of Central Pennsylvania, including several 24-hour totals >4" on July 23rd. The last week in July was particularly wet, but the active pattern continued through most of August. Here are daily precipitation totals for Williamsport, State College, and Harrisburg for July 21-August 31. Prior to September 9th, 2018 was notable for being extremely wet without the influence of any tropical systems. 1972 (Agnes) and 2011 (Lee) were extremely wet but included a huge amount of moisture from tropical systems. TS Gordon arrived in PA and dumped a bullseye of rain right over Central PA on September 9th and 10th. After hanging out over the Atlantic and looping about several times, Hurricane Florence made landfall in the Carolinas in the middle of September. On September 16-17, 2018, Florence dumped 3-4" of rain along and just east of the Appalachians. Florence really cemented 2018 as the wettest year ever from the Carolinas through the Delmarva region and into Pennsylvania. October 26th and 27th delivered a nor'easter to Central PA. Typically associated with significant snowfall in the northeast, this system was warmer and brought a couple inches of rain into the already-saturated regions of Virginia, Maryland, and Pennsylvania. The combination of significant moisture and cold temperatures brought widespread 8"+ of snowfall across most of Central Pennsylvania on Thursday and Friday November 15-16, 2018. This storm, which initially was expected to produce quite a bit of sleet, overproduced for much of the area and resulted in significant travel impacts across the middle Atlantic and northeastern United States.
July 21-25th, 2018
Heaviest Precipitation Totals
Late July - Early August
Tropical Storm Gordon
Hurricane Florence
Late October (snowless) Nor'easter
November Winter Storm
.jpg)
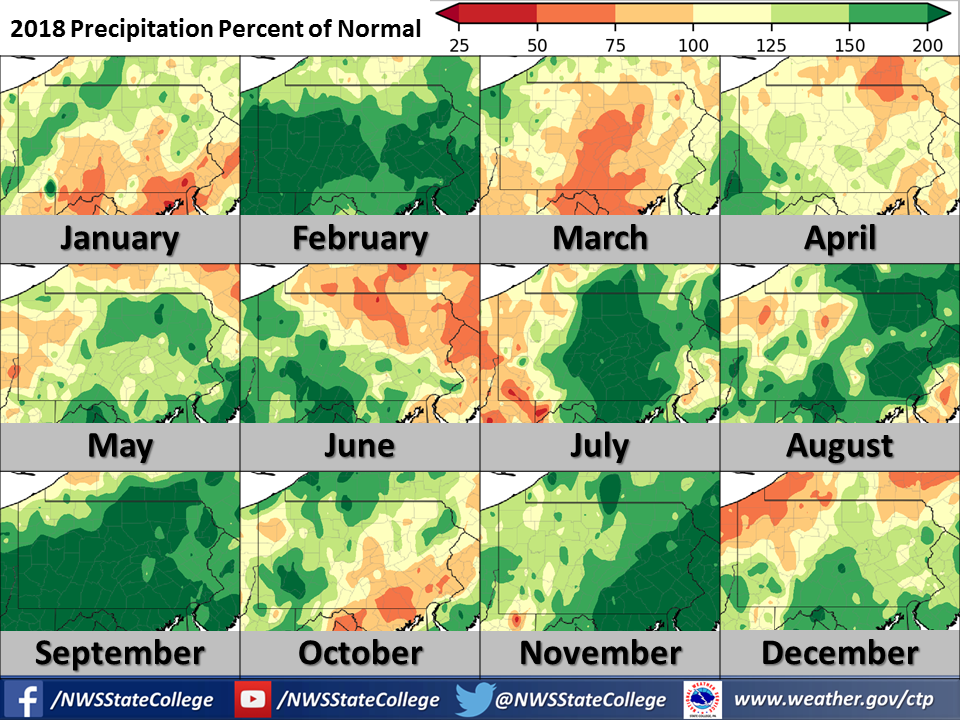
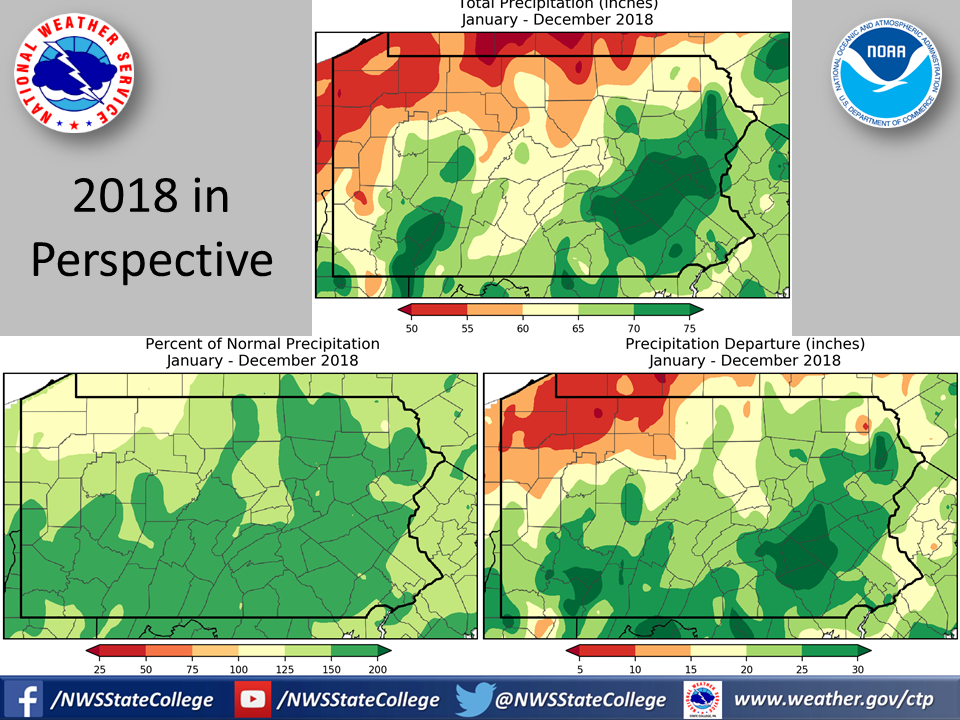
And finally, we close with a few graphics showing how precipitation compared to normal across Pennsylvania:
Graphics from the Northeast Regional Climate Center: http://www.nrcc.cornell.edu/regional/monthly/monthly.html Graphics from the Northeast Regional Climate Center: http://www.nrcc.cornell.edu/regional/monthly/monthly.html
Monthly Precipitation
Annual Precipitation
Sources:
North Carolina Institute for Climate Studies: https://www.arcgis.com/apps/webappviewer/index.html?id=602e105ede7e4442b1764218e87a232b&extent=-16107286.4041%2C2254661.2808%2C-4973163.116%2C7078143.5137%2C102100
Regional Climate Center Perspectives: http://www.nrcc.cornell.edu/wxstation/perspectives/perspectives.html
Northeast Regional Climate Center: http://www.nrcc.cornell.edu/regional/monthly/monthly.html
xmACIS2: https://xmacis.rcc-acis.org/
PRISM (Oregon State): http://prism.oregonstate.edu/comparisons/anomalies.php
NCDC: https://www.ncdc.noaa.gov/cag/statewide/
National Water Prediction Service: https://water.weather.gov/precip/


 Send Us a Report