
Strong to severe thunderstorms capable of producing large to very large hail, damaging wind gusts and a few strong tornadoes are likely from the Midwest to the Mid-Atlantic tonight. Moderate Risk (level 4 of 5) of severe thunderstorms is outlooked for the Midwest. A widespread heat wave will peak in the South and East on Friday, with many temperature records expected to be broken. Read More >
Background
The new 30-year climate normal values (the average conditions to be expected) have been released after careful calculations by NOAA's National Center for Environmental Information (NCEI). This information uses data collected between 1991 and 2020. Every 10 years, the normals are re-calculated based on the prior 30 years of data. This keeps the data fresh, helping to account for changes in the conditions near the observation sites. The previous 30-year time frame was 1981-2010.
What are these values used for?
The normal values are referenced frequently in NWS forecasts and statements. We use the normal values to give perspective to how unusual some occurrence would be, and can answer questions like:
* Is it warmer than normal? * How much warmer? * Is this an unusually wet month? * Did we have more snow than normal last season?
Each day, the NWS Forecast Office in State College issues detailed climate summaries for 5 locations around Central PA; Harrisburg, Williamsport, Johnstown, Altoona and Bradford. More climate summaries, including monthly data can be found on the NWS Climate information pages. Continuous, hourly data has been collected at these sites for many years, some for well over a century. In these summaries, and in the monthly, seasonal and annual summaries we periodically issue, we reference the normal maximum (high), minimum, and average (max + min / 2) temperatures, and the normal amount of precipitation and snowfall (where available). This can provide visibility and promote awareness to the trends and (ab)normality of the actual weather observed.
The normals are also used in academia for research purposes. They can be referenced by government and industry for a myriad of purposes. Some examples: If a local municipality wishes to plan for an event in the future, or decide on a budget for road salt/chemicals, they can look up these normals. If an industry wishes to plan on where to move materials during the year, they may check the normal temperatures if the material is sensitive to freezing temperatures. A company wishing to move it's office to a different city can use the normals to get an idea of how wet/rainy a location will be. You can use the normals to figure the amount of heating oil you may burn through during a winter with near-normal temperatures.
Key points:
Maps
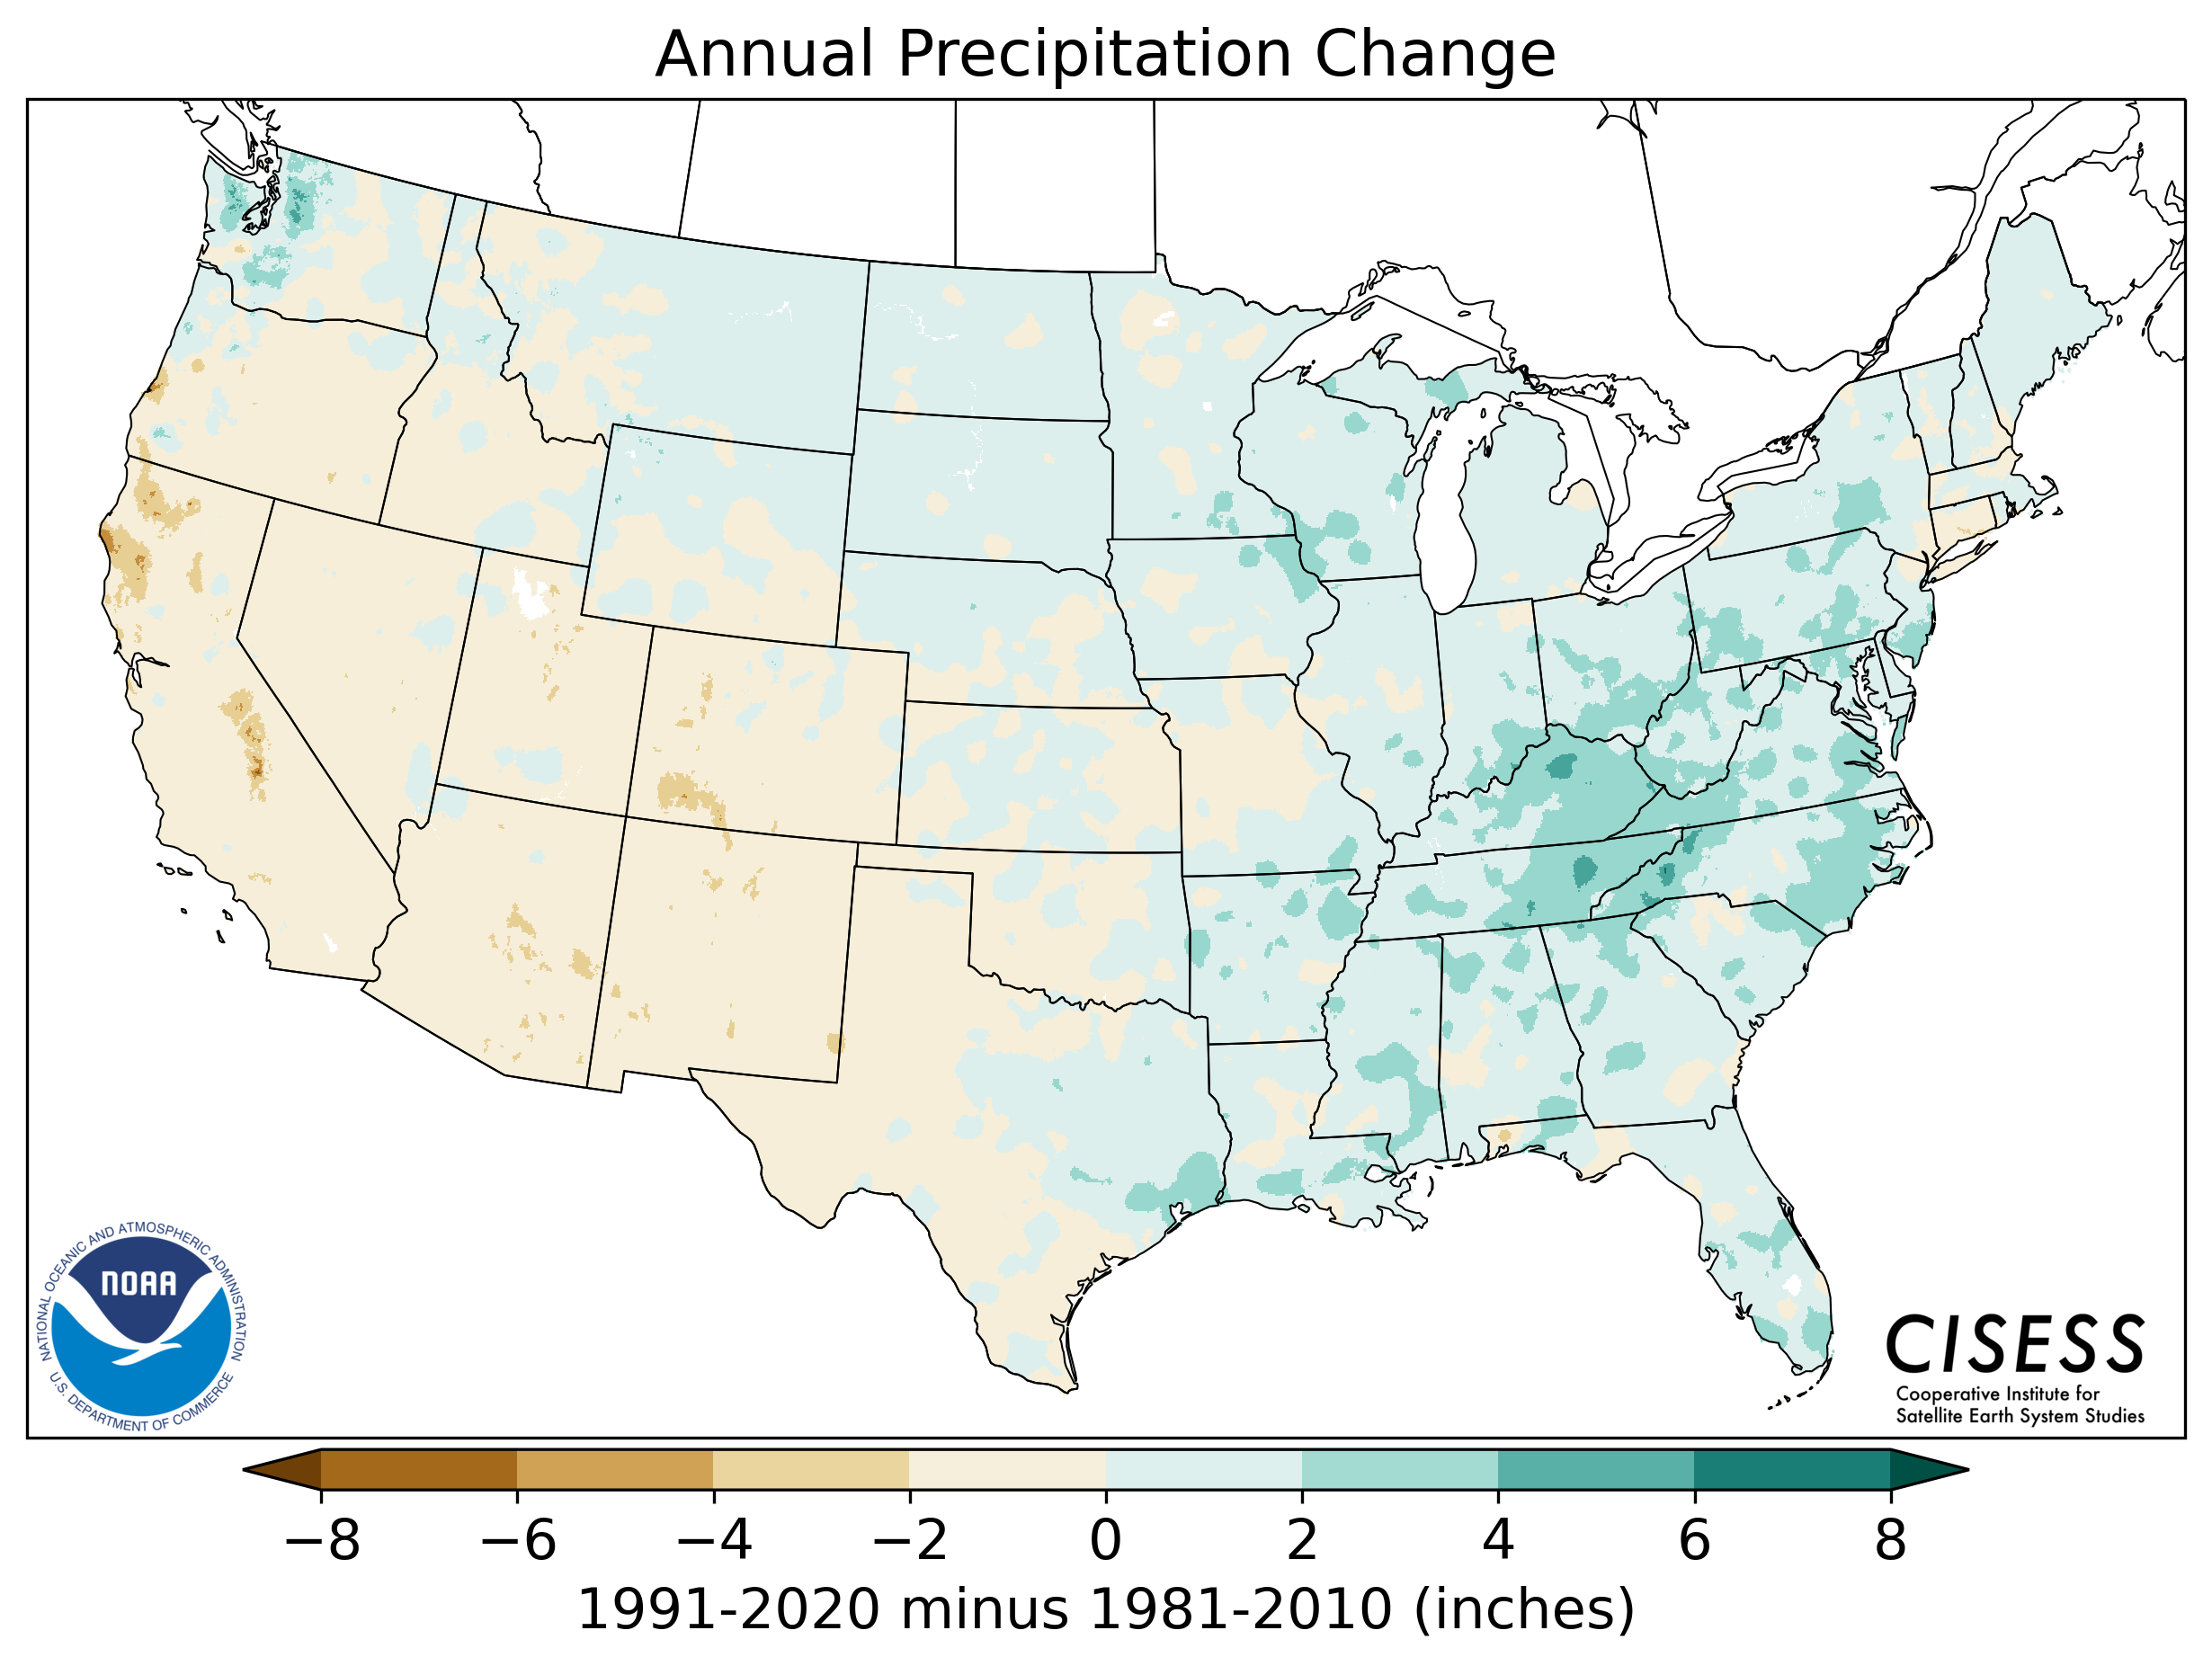
Here are a few maps showing the change in normals between the old 1981-2010 values and the new 1991-2020 values:
|
Difference in Annual Precipitation (inches). Positive (negative) values mean that it is wetter (drier) in the new normals. It was slightly wetter in PA for the 30 year period from 1991-2020 vs the previous/old 30-year (1981-2010) period. Takeaway: We had more rain & melted snow/ice in PA over the past 30 years than during 1981-2010. |
|
Difference in Annual Average Temperature. Positive (negative) values mean that it is warmer (cooler) in the new normals. The temperatures over PA through the whole year are warmer in the new 30-year (1991-2020) period than during the previous (1981-2010) period. Takeaway: It was warmer in PA during the last 30 years than during the 1981-2010 period. |
Additional Resources
Climate at a Glance mapping tool from NCEI : https://www.ncdc.noaa.gov/cag/


 Send Us a Report