
Widespread life-threatening flash and urban flooding continues in south-central Texas, with considerable flooding impacts possible across central Texas. Wildfire smoke is impacting air quality across much of the Great Lakes region into southern New England and the Mid-Atlantic. Monsoonal thunderstorms may produce isolated to scattered flash flooding across the Southwest into the Great Basin. Read More >
|
National Weather Service State College, PA - Winter 2002 �Working Together To Save Lives�
|
|||||||
|
Pennsylvania Drought of 2002 by Richard Grumm, Science and Operations Officer
A drought has dominated much of Pennsylvania for the past few years.� This drought is the result of a persistent upper level ridge, near the level of the jet stream.� This ridge was present in the winters of 2001 and 2002 and continued through the spring and summer of 2002.�
The average 500 mb heights (about 18,000�) for the spring of 2002 are shown in upper panel of Figure 1. The solid contours show the heights (meters) above the surface and the shading shows how much these heights departed from normal for the three spring months of March, April, and May of 2002.� The key feature was the strong ridge over the southern United States.� This feature kept warm moist air from entering our state which allowed the drought to continue.�
|
The lower panel shows the 850 mb temperatures (about 5000�).� Note the cold air locked up in Canada and the warm air over the Gulf of America.� These conditions did not favor an active jet stream over our region.� Much of the cold over Canada was the result of a surge of Arctic air into central Canada during the month of May. Over much of the eastern United States, May was the only cool month in the January to August time frame.
The same data for the summer of 2002 are shown in Figure 2. These data also show how warm it was and how strong the ridge was over the eastern United States.
This pattern began to erode in October and into November suggesting the drought conditions should continue to decrease over the area during the next several months.
|
||||||
|
Pennsylvania Summer of 2002 by John La Corte, Senior Forecaster
The recent summer (June through August) was one that will be remembered as being long and hot. The warmth really got started in early spring, and with the exception of a cool-wet May, warmer than normal conditions have been the rule since the mild winter of 2001-2002.
Severe weather also made a return to the region with several events being noteworthy. While technically not a summertime occurrence, the season got off to an ominous start in late April when a storm system caused widespread severe weather from the Midwest all the way up into the Northeast. This storm spawned the deadly tornado in La Plata Maryland as well as 10 (weaker) tornadoes here in Pennsylvania.
Another widespread event occurred on the 4th through the 6th of June when more than 60 severe storms spawned reports of damaging winds, large hail or flooding. Of course the season wasn�t over as the 26th and 27th of June, the 23rd and 28th of July and 1st of August all resulted in many reports of severe local storms.
Recent weeks have seen a reversal of fortune as we slide into the cool season. After a warm start to October, the second week of the month suddenly turned cold and wet and we ended up averaging below normal for temperatures, the first time since May. November has followed suit, also ending up cooler than normal.
Summer Recap Climatology summaries for central Pennsylvania show that while Harrisburg and Williamsport were warm and dry, neither station managed to crack the top five for either warmest or driest for the three-month period. Both Harrisburg and Williamsport were about 2.5 degrees above normal for the summer. Central Pennsylvania wasn�t alone enduring the long hot summer. The rest of the state was also abnormally warm. Most reporting stations averaged more than 2 degrees above normal for the season (Figure 1).
|
Fig 1. Temperature Summary for the Summer of 2002 (degrees)
Fig 2. Precipitation Summary for the Summer of 2002 (inches)
Considering the state of the El Nino and relating it to past years, statistics show that we average near to slightly above normal for snowfall. However, more than half the winters were less snowy than normal. This suggests that statistics may be of little use in giving us a peek into the future. Some winters like 1969, 1977 and 1993 were very snowy, while the winters of 1991 and 1994 saw very little snow.
|
|
Unfortunately the warm summer was also a dry one (see previous article). Drought warnings or watches were the rule over most of central Pennsylvania. While recent rains have eased some of the long-term water deficits, much of southeastern Pennsylvania remains under a drought warning with water use restrictions being imposed in some areas.
Rainfall for the season averaged more than 3 inches below normal for most of the state (Figure 2). The exception was over northeastern areas where a very wet June managed to blunt some of the effects of the parched conditions of July and August. For a more complete and up to date description of the drought as well as precipitation summary maps, go to the Mid Atlantic River Forecast web site at:� http://www.erh.noaa.gov/er/ctp/hydro.shtml
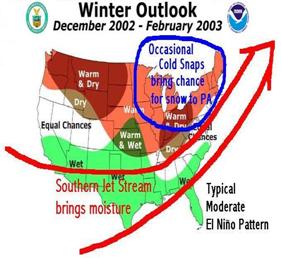
Upcoming Winter
What will the coming season have in store for the region? If anyone out there knows please call us at� Seriously, no one really knows. Experts believe a moderate El Nino is developing. This in conjunction with some abnormally warm waters off the eastern seaboard may allow more in the way of east coast storminess to develop, especially compared to recent winters (Figure 3). However the overall seasonal outlook from the long-range branch of the National Weather Service is for warmer and drier than normal. This sounds depressingly familiar to storm lovers who have suffered through the last two anemic winters here in central Pennsylvania.
Climatologically speaking, when Williamsport has had measurable snow in October, such as this year when 1.7 inches fell, they average more than a foot above normal for the ensuing winter. Temperatures also tend to the cold side, averaging around a degree colder than normal in those winters.
Harrisburg had no snow in October so no comparisons could be made.
Fig 3. Expected Winter Pattern
|
Considering the state of the El Nino and relating it to past years, statistics show that we average near to slightly above normal for snowfall.� However, more than half the winters were less snowy than normal.� This suggests that statistics may be of little use in giving us a peek into the future.� Some winters like 1969, 1977, and 1993 were very snowy, while the winters of 1991 and 1994 saw very little snow.
So we are left to wait and see, which is also known as �job security� for the weather forecasters of the world.
How to Measure Snow by Greg DeVoir, Senior Forecaster
With the cold season upon us, it will become fairly commonplace to see the precipitation we get fall in the form of snow. With that in mind, a brief review on how to measure snow is in order.
Liquid Equivalent of Snow
To obtain the liquid equivalent of the snowfall, remove the funnel and inner measuring tube of your rain gauge so that it can more accurately catch the frozen precipitation. This can then be melted down and measured by pouring the liquid back into the measuring tube. It is also a good way to get a rough idea of how much snow has fallen. On average it takes about one inch of liquid to get 10 inches of snow. So if you melt down the snow in your gauge and measure .45 inches of liquid, about 4 to 5 inches of snow probably has fallen. Use caution equating liquid to snowfall however, lake effect snows which are common over the northwestern part of the state this time of year, as well as any snow that falls when it is extremely cold can often yield 15 or 20 inches of snow per inch of liquid.
|
Reporting Snowfall
We here at the National Weather Service want to hear from you when it snows. Please give us a call at 1-800-697-0010 whenever you receive significant or heavy snow, such as amounts of 4 to 6 inches or more.� Snowfall reports can now also be submitted via the web. To do so, point your browser at: http://www.erh.noaa.gov/er/ctp/ and click on the Climate section (lower left). You can then click on the section that says: Public Reports of Rain Fall and Snow Fall - search by date! and enter your report. Either way, we appreciate the reports as every snow storm brings plenty of public interest regarding how much snow fell and where it occurred.
For a very detailed description of how to officially measure snow for the purposes of climatological archives, you are encouraged to check out: http://www.nws.noaa.gov/om/coop/Publications/snowguid.htm This site will tell you everything you want to know about taking snow measurements, and then some. Enjoy and we look forward to hearing from you!
New NWS Snowfall Criteria for Winter Weather Watches, Warnings and Advisories� by Barry Lambert, Senior Forecaster
New for this winter season are revised criteria for various forms of freezing or frozen precipitation (snow, sleet or freezing rain) that will trigger Winter Storm Watches, Warnings or Advisories. The same holds true for Lake Effect Snow Warnings and Advisories for residents and travelers across the Northwest Mountains of Pennsylvania.
Since it�s logical to consider the �representative� amount of snow or ice that a large percentage of the population is expected to receive, we have adopted the �average value� rule for the snow/ice accumulation when it comes to the issuance of a Watch, Warning or Advisory. Our previous method of using forecast values for the upper end of the snowfall range likely caused us to be too pessimistic on the impact of the storm, since any one point receiving the upper end snowfall would trigger a Warning or Advisory.� The NWS feels that our slight modification to the Winter Storm/snowfall criteria will better reflect the expected severity of the storm.
|
You will also notice on the maps (see link below) that the criteria have a slight geographical difference across Pennsylvania (greater when you consider the entire Northeast U.S.). The logic behind the varying criteria is that large urban areas tend to be more adversely impacted by smaller amounts of snow (especially during the morning and evening rush hours) than do the rural mountain areas.���������
Below are listed the updated winter weather criteria for the State College Weather Forecast Office. The following link has the detailed maps and criteria for all of the eastern United States.��� http://www.erh.noaa.gov/er/ctp/definitions.shtml
Snow Winter Weather Advisory� 3 inches in 12 hours. Winter Storm Watch�a winter storm with significant snow possible. Winter Storm Warning�6 inches expected in 12 hours except the Lower Susquehanna Valley (5 inches� in 12 hours). 8 inches or more in a 24 hour period for all areas. Blizzard Watch�potential for a blizzard to occur. Blizzard Warning� Sustained winds of 35 mph or greater and snow frequently reducing visibility to less than 1/4� of a mile, for a period of 3 hours or more. Lake Effect Snow Watch �heavy snow produced by moisture from the Great Lakes (note: Lake effect Products are limited to 5 counties of the northern mountains served by NWS CTP). Lake Effect Snow Advisory�3 inches or more in 12 hours. Lake Effect Snow Warning�6 inches or more in 12 hours.
Freezing Rain Winter Weather Advisory�Any ice accumulation. Winter Storm Warning�1/4 to 1/2 inch of ice accumulation. Winter Storm Warning for Severe Icing�Greater than 1/2 inch of ice accumulation.
Mixed Precipitation
Winter Weather Advisory�An accumulation of less than a quarter of an inch of ice along with any snow accumulations up to 5 inches�except 4 inches in the Lower Susquehanna .� � Winter Storm Warning�An accumulation of a quarter of an inch or more of ice along with any snow accumulations, or any accumulation of ice accompanying 6 inches or more of snow in 12 hours�except 5 inches in 12 hours lower Susquehanna region (8 inches in 24 hours all areas).
|
|
What�s New at the National Weather Service? by Barry Lambert, Senior Forecaster
Over the last year, the National Weather Service has embarked on a new way of creating and displaying weather forecasts.� The software that�s responsible for producing the high temporal and spatial resolution graphical and text products is called the Interactive Forecast Preparation System, or IFPS.
The software enables forecasters to provide users with a highly sophisticated dataset that is capable of displaying a wide range of products, such as pinpoint forecasts of rain or snowfall amounts for any city or town.�������
The forecast product is set into motion by first �painting� various weather elements onto a map using embedded tools such as: drawing contours, or applying a specific value for a weather element to a region, or using the pencil tool to �paint� the images.
The advances in technology have allowed NWS Meteorologists to not only produce worded forecasts but also graphical images. The� software accesses the database, then decodes the information, and creates a �rough draft� of text for the forecaster to edit, with the final version identical to the worded forecast we are all used to seeing or listening to over the radio.������
Long time listeners and readers of National Weather Service forecasts will see little or no change in the way forecasts are worded, but will have the opportunity to access two distinct forms of the high resolution data set via the Internet.� A tabular format, or Revised Digital Forecast (RDF), can be viewed at: http://www.erh.noaa.gov/er/ctp/graphical_rdf.shtml.� This form of forecast data is displayed by first selecting your county of interest. Its benefit is to capture the most important elements of the weather at a relatively quick glance.
The forecast elements are displayed with the use of �symbols�, and are broken down first into daily time intervals out through 6 days, and into 3-hourly increments for the first 48 hours of the forecast. The latter can be used for more specific planning of your daily activities.
|
Images of various weather elements, capable of being animated can be found at http://www.erh.noaa.gov/er/ctp/ifps/
We welcome you to explore the information on our office�s Web Site and provide us feedback on the specific usefulness to you, and your friends or business associates. We are always looking for ways to improve the data quality, or the way it�s displayed to better our service to you.
Early Winter Snows by Richard Grumm, Science and Operations Officer
An early season snowfall struck a large portion of central Pennsylvania in October of 2002. This was the first widespread snowstorm to affect the State since October 1993.� November snows are more common than October snows, but big November snowfalls are still not a common occurrence in Pennsylvania.
The most memorable snow storm for older western Pennsylvanians is the 26 November 1950 storm.� This storm produced record snows in the Pittsburgh area.� The features associated with this storm are shown in Figure 1. The data show that a very strong low pressure system moved over Erie, Pennsylvania while a surge of very cold air moved south of the state.� The deep low and cold air produced record snows in western Pennsylvania.� Interestingly, this storm occurred a few weeks after the only known November F3 tornado event, which occurred in Lancaster and Berks Counties on 4 November 1950.�
The average 500 mb (about 18,000�) heights and 850 mb (about 5000�) temperatures are shown in Figure 2. These data show that both the 500 mb heights and 850 mb temperatures were below normal for the month. It is also interesting to note that in the mean, the 500 mb trough was negatively tilted (slanted from northwest to southeast) for the month.� Negatively tilted troughs are often associated with strong storms.
|
|
The last major November snow storm occurred on 14-15 November 1995 in association with a strong surface storm that passed over Philadelphia. This November storm was followed by several in December which gave Williamsport their second snowiest December ever.� Additionally, several large snow events were seen in January 1996.
|
Are we going to follow a similar trend this year�stay tuned!�
|


 Send Us a Report