Overview
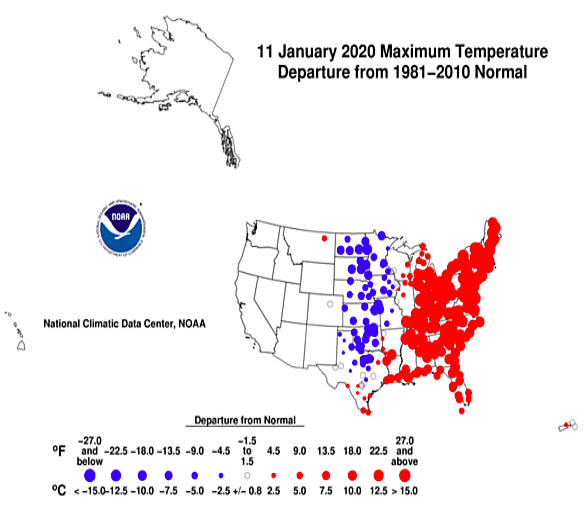
January 11th, 2020 was one of the warmest January days Pennsylvania has ever experienced! High temperatures in the 60s and lows in the upper 50s set records at several climate sites. And then, following the 12th warmest January in state history, average temperatures in February and March were the 10th warmest respective months in the state’s 126-year period of record Graphic highlighting the spring-like day temperatures with summer-like overnight lows |
NWS Reports
 |
 |
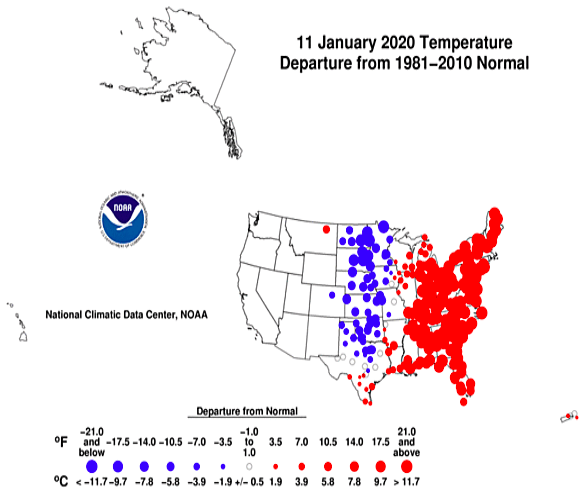 |
| NWS State College Tweet | US Maximum Temperature Departure | US Average Temperature Departure |
Daily Surface Maps
 |
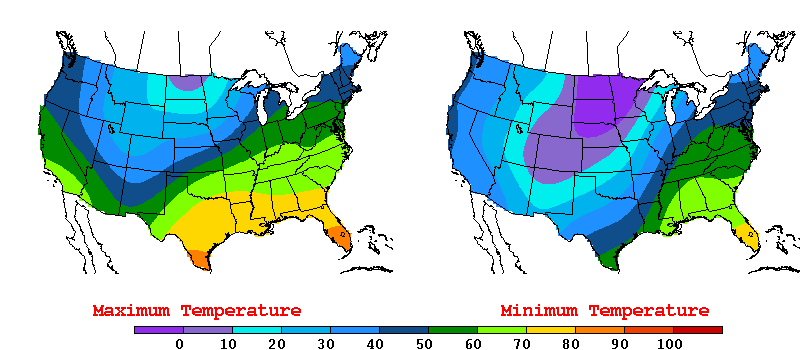 |
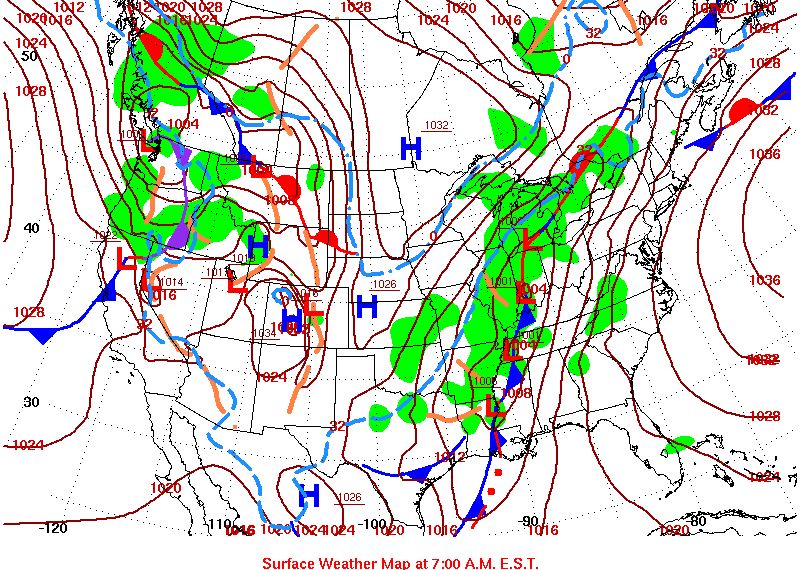
| Saturday, January 11, 2020 Daily Surface Map | Maximum & Minimum US Temperatures January 11, 2020 |
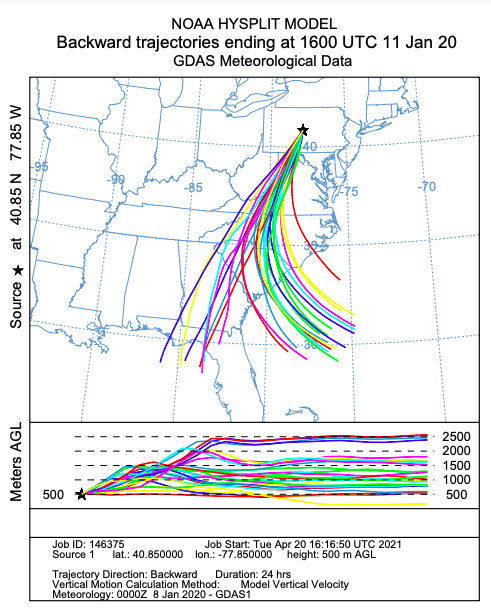
NOAA Hysplit Model
After tracking where the air mass originated, it becomes clear why the region got so warm. Air moved northward from the Gulf of America and southern Atlantic Ocean.
Climate Report
Max/Min Temperature and Precipitation Table for PA
553
ASUS61 KCTP 120054
RTPCTP
MAX/MIN TEMPERATURE AND PRECIPITATION TABLE FOR PENNSYLVANIA
NATIONAL WEATHER SERVICE STATE COLLEGE PA
745 PM EST SAT JAN 11 2020
.BR CTP 0112 Z DH00/TAIRZY/TAIRZI/PP
::Automated Surface Observing Systems (ASOS) Sites
:Automated Temperature and Precipitation Data -
:12 Hour High/24 Hour Low Ending 7 pm EST/8 pm EDT and
:24 Hour Accumulated Precipitation Data ending at 7 pm EST/8 pm EDT
:Pennsylvania -- Temperature and Precipitation Stations
:......................................................
: Station Max / Min / 24-Hour
: Name Temp/ Temp / Precip
:......................................................
:
ABE : Allentown : 67 / 37 / 0.00
AOO : Altoona : 66 / 38 / 0.00
BFD : Bradford : 62 / 45 / 0.10
CXY : Capitol City : 70 / 40 / 0.00
FIG : Clearfield : 64 / 35 / 0.04
DYL : Doylestown : 67 / 48 / 0.00
DUJ : Dubois : 64 / 44 / 0.03
ERI : Erie : 71 / 42 / 0.31
MDT : Harrisburg : 69 / 38 / 0.00
JST : Johnstown : 64 / 50 / 0.01
LNS : Lancaster : 64 / 40 / 0.00
GKJ : Meadville : 67 / 47 / 0.24
MPO : Mt. Pocono : 57 / 42 / T
PNE : NE Philadelphia : 70 / 47 / 0.00
PHL : Philadelphia : 67 / 47 / 0.00
AGC : Pittsburgh : 71 / 53 / 0.01
PIT : Pittsburgh Intl : 71 / 50 / 0.03
PTW : Pottstown : 65 / 40 / 0.00
RDG : Reading : 65 / 39 / T
AVP : Scranton : 64 / 39 / T
SEG : Selinsgrove : 66 / 33 / 0.00
IPT : Williamsport : 64 / 34 / T
THV : York : 67 / 44 / 0.00
:
.END
T = Trace
M = Missing
:- - - - - - - - - - - - - - - - - - - - - - - - - - - - - - - - -
.BR CTP 0112 Z DH00/TAIRZY/TAIRZI
:Automated Surface Observing Systems (AWOS) Sites
:Automated Temperature Data - 12 Hour High/18 Hour Low
:Ending 7 pm EST/8 pm EDT
:................................................................
: Station Max / Min
: Name Temp/ Temp
:................................................................
:
BVI : Beaver County : 70 / 51
LOM : Blue Bell : 68 / 45
BTP : Butler : 69 / 51
MQS : Coatesville : 64 / 45
FKL : Franklin : 66 / 46
MUI : Ft Indiantown Gap : 59 / 35
IDI : Indiana : 68 / 52
LBE : Latrobe : 73 / 50
UCP : New Castle : 69 / 50
UKT : Quakertown : 66 / 45
UNV : University Park : 63 / 32
.END
:
The temperature data for AWOS sites represent the highest and
lowest temperatures that were reported on the metar observations
that transmit three times an hour and may not represent the actual
high or low for that site. These sites do not measure precipitation.
These data are preliminary and have not undergone final quality
control by the National Climatic Data Center /NCDC/.
Therefore these data are subject to revision. Final and certified
climate data can be accessed at www.ncdc.noaa.gov
:- - - - - - - - - - - - - - - - - - - - - - - - - - - - - - - - -
$$
BANGHOFF
 |
Media use of NWS Web News Stories is encouraged! Please acknowledge the NWS as the source of any news information accessed from this site. |
 |