|
Summary
For much of June, it seemed like the intensifying drought would never end. A persistent upper level high pressure ridge anchored from Texas through northern Mexico maintained a pattern of very hot, breezy, and dry weather across all of Deep South Texas through the 21st. Temperatures were 2 to 4 degrees higher than the already very warm averages for the month; on June 15th, long range forecasts suggested more of the same through the end of the month. By the 13th, water year rainfall (October 1st through June 13th) was at record dry levels for nearly all of the Rio Grande Valley. The situation peaked during the period of June 17th to 21st, when daytime heat index reached toward 110°F or higher along the Rio Grande, nighttime heat index remained in the 90s until midnight or beyond, and windy afternoons and evenings further increased the threat for explosive wildfire growth. The situation culminated with a conflagration not seen since March 2008, when more than 30,000 acres burned in western Brooks County between June 18th and 22nd.
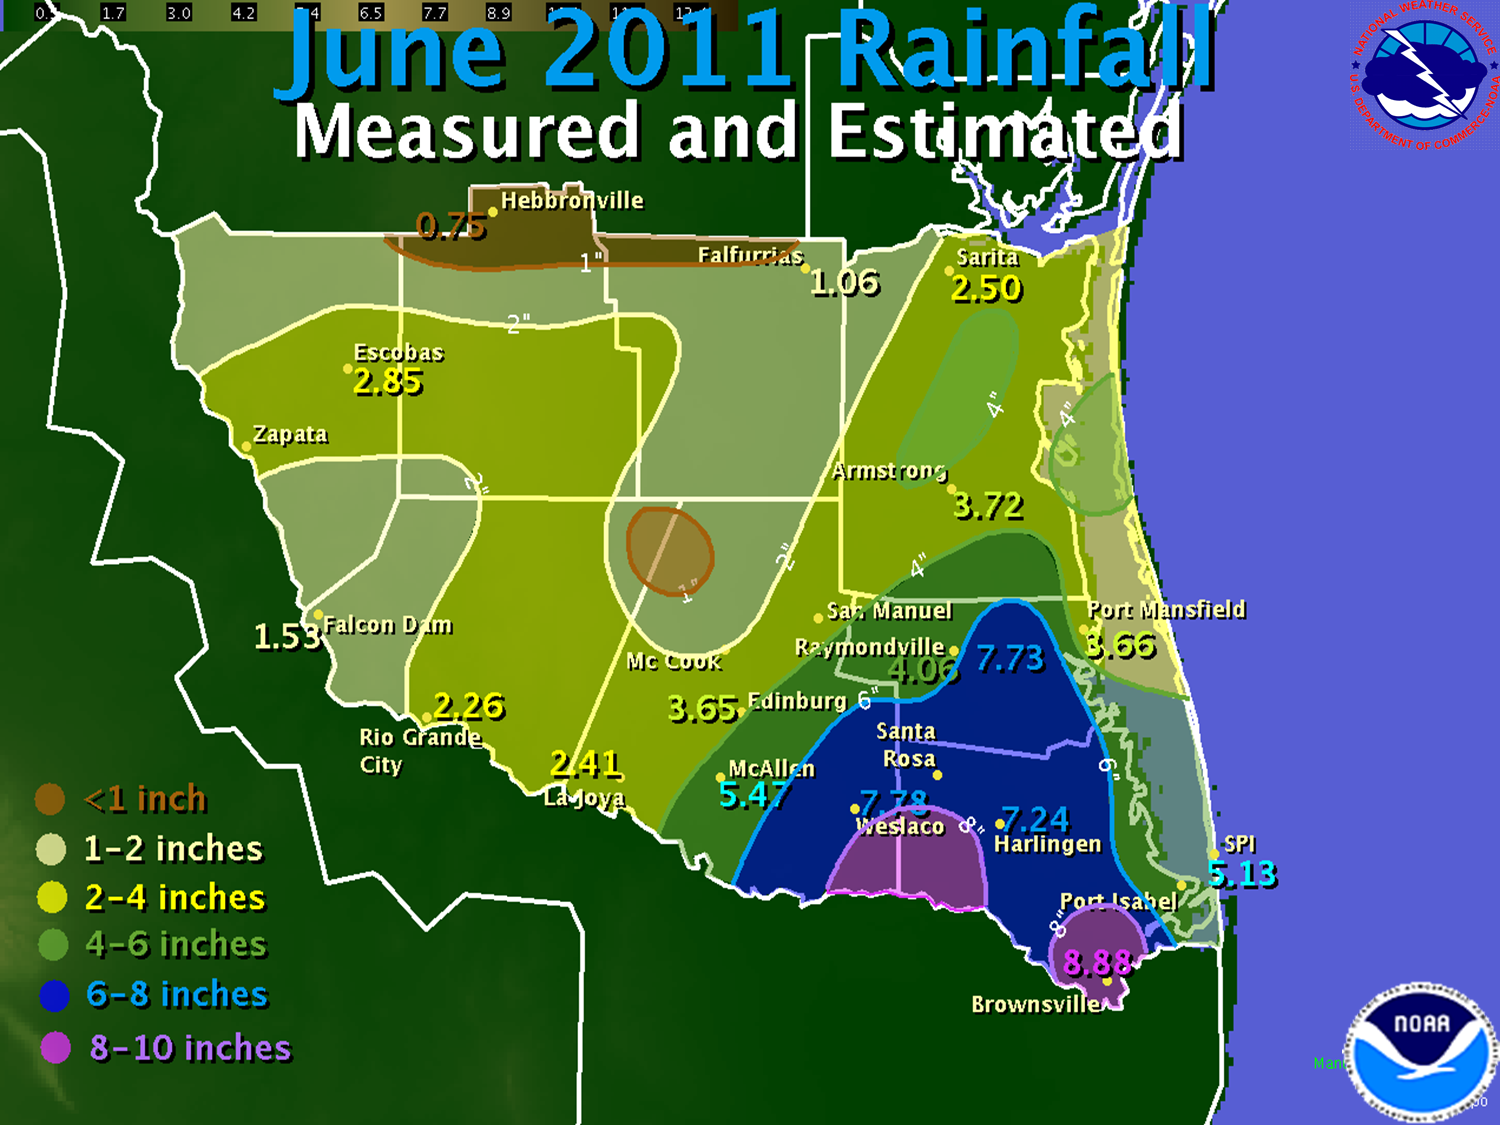
And then...some relief. The high pressure ridge which seemed unable to be moved...moved. One section split off into the eastern Gulf of America, while the dominant dry weather maker drifted west toward the northeastern Pacific Ocean and southwest U.S. In between, a vigorous upper level trough moving through the upper Mississippi Valley left a tail of energy, or shear, well into Texas. This tail linked up with a weak disturbance moving from east to west toward the Valley, drawing very rich tropical moisture northward. The collision of energy sparked drenching rains across the Rio Grande Valley on the 22nd and 23rd, with more than 6 inches in locations from Weslaco to east of Raymondville. Lesser rains across the Brush Country did little to alleviate the drought, at first. More relief arrived with the approach of feeder bands on the north side of [Tropical Storm Arlene, which made landfall near Tampico on the 30th. Add a quick blurb about additional rainfall occuring on June 28th to June 30th here.] While the welcome rains of the final week of June failed to alleviate the drought entirely, they put a dent into the exceptional conditions across the most populated areas from McAllen to the coast. By the end of June, exceptional drought had tapered to extreme, and the additional rains would likely decrease drought conditions one or more levels, to "severe", by the first full week of July.
Just How Dry Compared with Other Years?
The table below shows the water year rainfall (since October 1, 2010) compared with prior records, as well as how much rain is still needed to make up the difference from average, for selected locations across Deep South Texas.
Current Rainfall as of July 1st, Compared with Prior Records
|
Location
|
Current Rainfall (Rank)
|
Prior Record (year)
|
Rain Needed to Reach Average (in.)
|
|
Brownsville
|
11.66 (24)
|
5.88 (1952/53)
|
4.55
|
|
Harlingen/Coop
|
11.73 (19)
|
6.45 (1915/16)
|
5.38
|
|
Raymondville
|
8.84 (11)
|
5.50 (2001/02)
|
8.13
|
|
Port Mansfield
|
6.31 (3)
|
2.96 (2008/09)
|
10.87
|
|
Sarita
|
9.04 (13)
|
3.02 (2008/09)
|
8.69
|
|
Hebbronville
|
4.14 (2)
|
3.81 (2007/08)
|
10.41
|
|
Falcon Dam
|
2.56 (1)
|
3.92 (1970/71)
|
9.57
|
|
Rio Grande City
|
3.73 (3)
|
3.40 (1915/16)
|
8.52
|
|
La Joya/Mission
|
3.30 (1)
|
4.16 (2007/08)
|
10.80
|
|
Mc Cook
|
2.26 (1)
|
3.38 (2005/06)
|
11.91
|
|
McAllen/Miller Arpt
|
6.84 (7)
|
3.98 (2005/06)
|
7.19
|
|
Mercedes 6 SSE
|
9.89 (15)
|
5.18 (1988/89)
|
5.82
|
|

