|
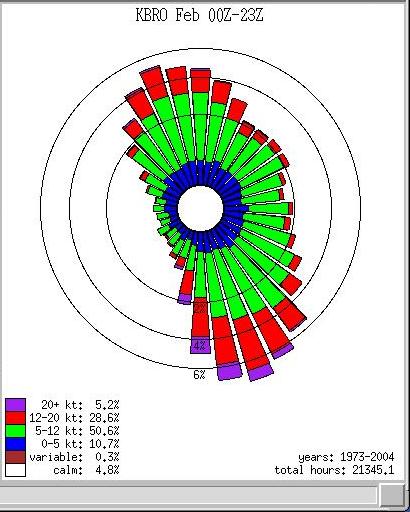
Yes, it was windy this February. On a number of days, sustained winds, mainly from late morning until around sunset, averaged 25 mph or higher along and near the Highway 77 Corridor, including much of Cameron, Willacy, Kenedy, and portions of eastern Hidalgo and southeastern Brooks Counties. Fully one quarter of the month had segments of long duration (generally, 4 hours or more) of 25 mph sustained winds with frequent gusts in excess of 30 mph. These days included February 3rd through February 5th, February 14th through February 16th, and February 26th and 28th. The winds have continued into the first few days of March, with another round of hefty winds on either side of a cold front on March 2nd and 3rd. Interestingly, there was a period of relative calm amidst the maelstrom, between February 17th and 24th, as high pressure from the surface to high levels of the atmosphere remained in control. The quiet period likely helped drop average winds to near their 1961-1990 levels (12.4 mph in 2008 versus 12.2 mph based on the 1961-1990 average). However, when using a later example of a wind rose for Brownsville (below), using 1973 to 2004 data, the 12.4 mph average value falls within the 12 to 20 knot range bin, or 28.8% of all wind values.
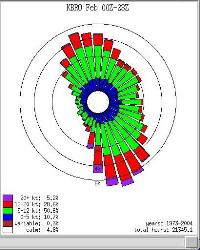
Figure 1. Wind Rose, Brownsville/South Padre Island Airport, February. Colors denote increasing data "bins" as shown in the legend, bottom left (click to enlarge).
The Valley's Wind Engine
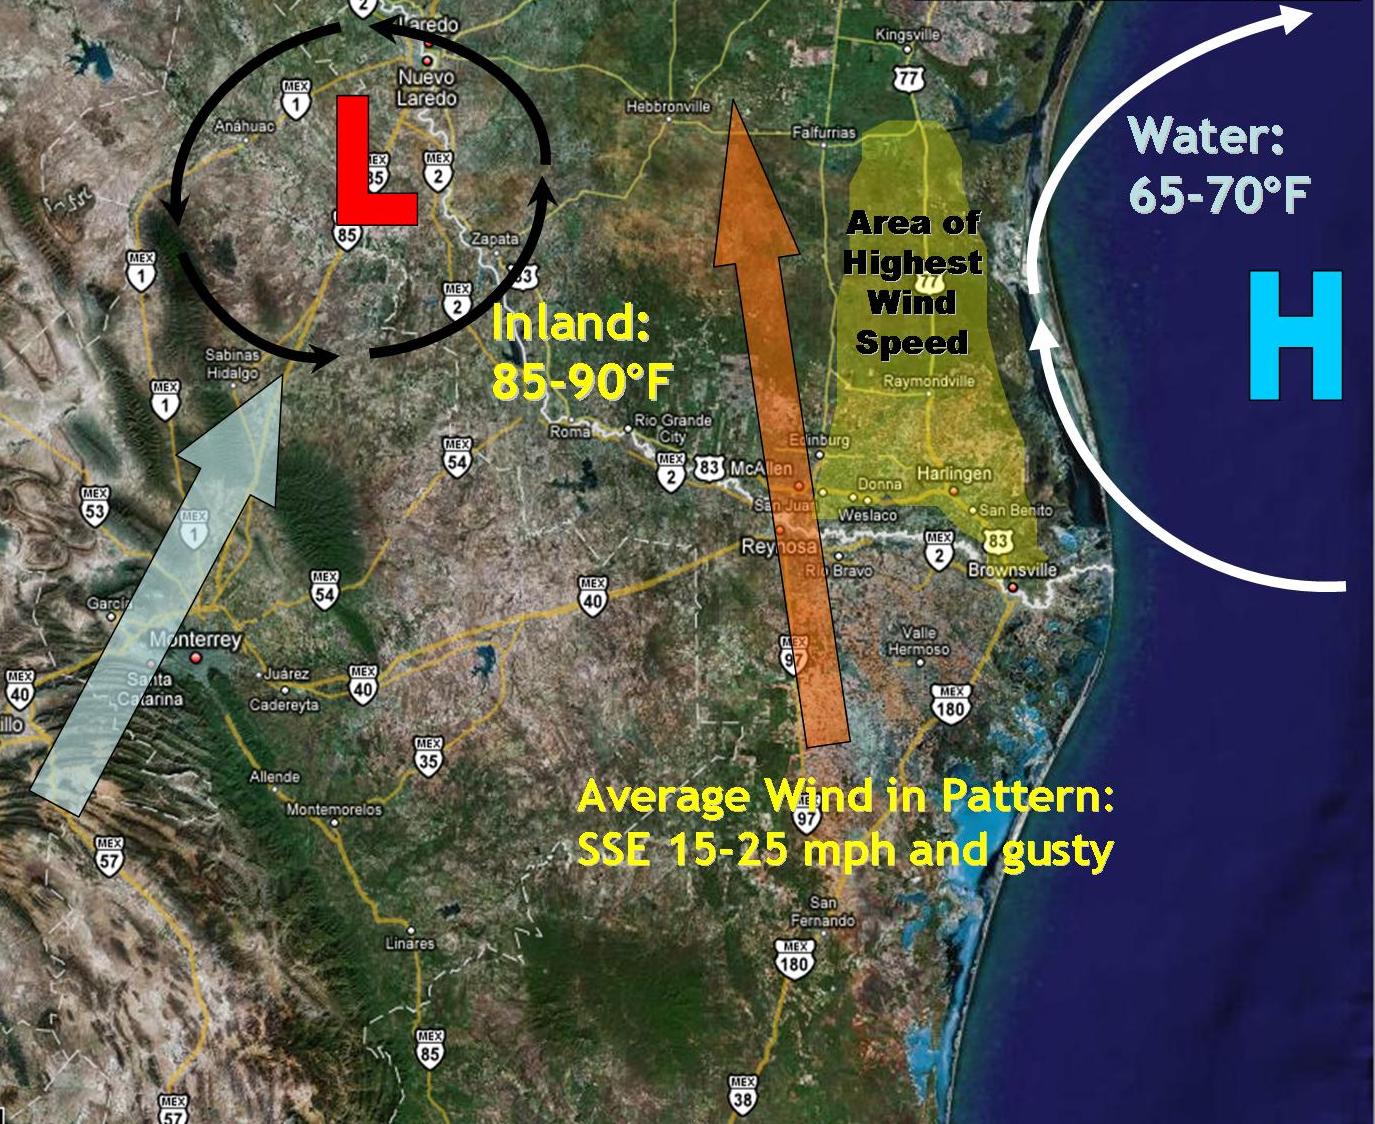
The persistent autumn, winter, and spring breezes across the lower Rio Grande Valley and points north in Deep South Texas are the result of geography. South to southeast winds dominate, with a secondary maximum of northerly winds (Figure 1, above). As high pressure moves eastward into the Gulf and away from Texas, return flow develops. For many residents of the southeast U.S., the strength of the return flow is dictated by large scale pressure systems. This is not the case for the southern tip of Texas, as locally higher pressures over the cooler Gulf waters combine with a semi-permanent area of low pressure in the lee of the Central Mexican Plateau and Sierra Madre Oriental. Figure 2, below, shows general flow around high (H) and low (L) pressure (black arrows); the larger light blue arrow shows broader downslope flow from the Central Mexican Plateau and Sierra Oriental into the lower and middle Rio Grande Valley well west of the Gulf Coast, and the orange arrow denotes the primary south-southeast flow that develops between all systems. Shaded yellow area is general location of the strongest breezes, which typically range from 15 to 25 mph, with gusts between 25 and 30 mph.
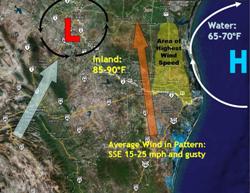
Figure 2. Graphic depicting "typical" return flow around high pressure (right) and low pressure (left) partly created by downsloping of wind in the lee of the Sierra Oriental (click to enlarge).
|
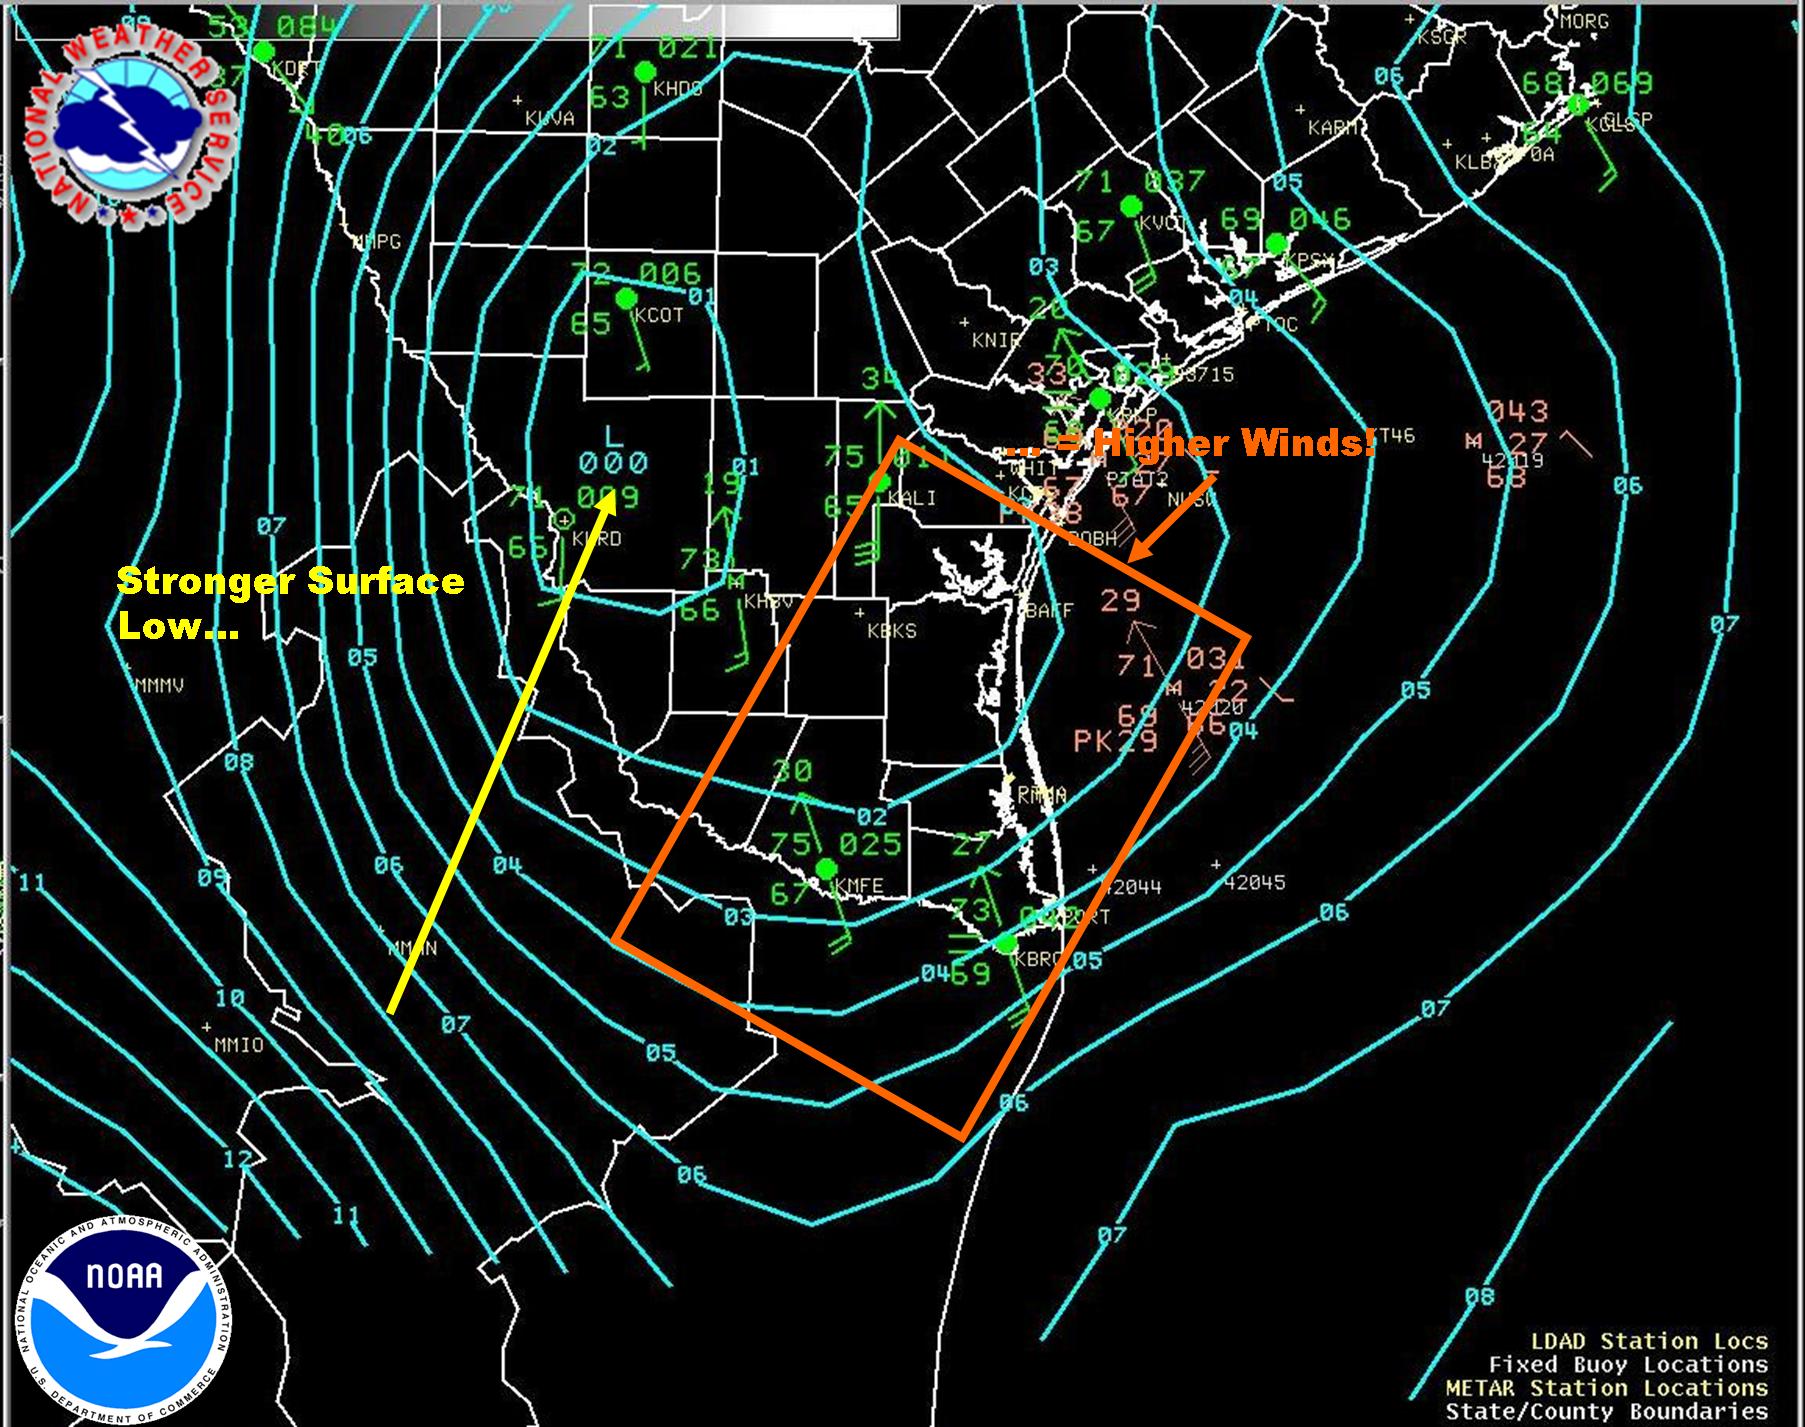
Figure 3. Surface pressure analysis, lower Rio Grande Valley and Deep South Texas, 5 AM CST March 3, 2008 (click to enlarge).
February and Beyond, 2008
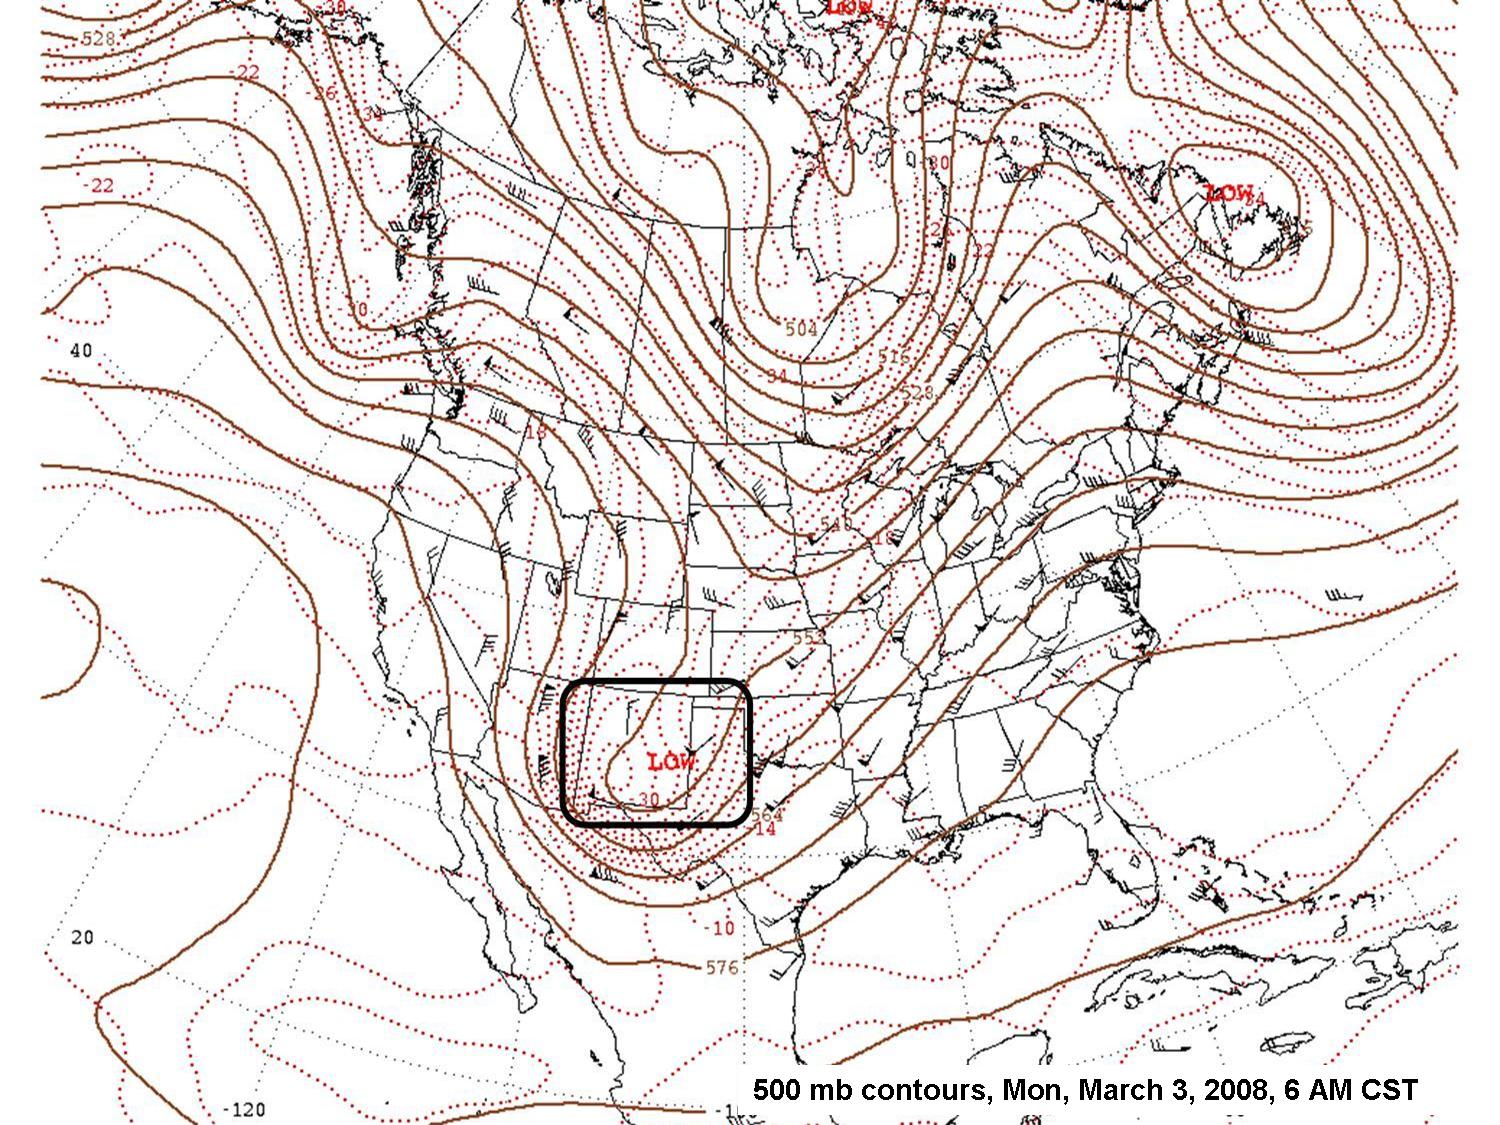
While there had been a few days of blustery winds in December and January, the bulk of windy days has been in February and into early March. These "enhanced" windy days, with notably higher speeds, are in part the result of small but potent upper level disturbances diving initially south into the Great Basin/four corners region (Figure 4) before scooting northeast through the lower Great Plains on their way toward the Mississippi. The disturbances help to decrease surface pressures several millibars lower across the middle and upper Texas Rio Grande Valley than what would be expected with a more zonal (west to east) flow pattern between 15,000 and 25,000 feet above the earth. At the same time, still cool Gulf waters east of the Texas coast maintain somewhat higher surface pressures, providing a tighter pressure gradient which increases winds across the lower Rio Grande Valley, most concentrated in the area shown in Figure 2.
Fairly robust disturbances produced southerly wind gusts near or above 50 mph on the 5th and 16th, and again on March 2nd, in the corridor from Cameron to Kenedy County, as well as eastern Hidalgo and southeastern Brooks Counties. Minor damage was reported to unsecured or poorly fastened structures such as roofs and awnings; thousands of customers were without power due to the winds on March 2nd, which were the strongest, area wide, this season.
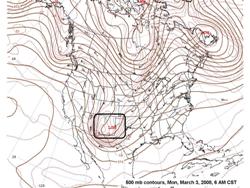
Figure 4. 500 mb analysis, 6 AM CST March 3, 2008. Note vigorous but progressive disturbance within the black square over New Mexico (click to enlarge).
La Niña To Blame?
While one should not blame any individual weather event on the larger scale El Niño/La Niña or other atmospheric teleconnections, the general pattern since mid winter across the lower Rio Grande Valley and Deep South Texas, and the entire lower 48 states, matches up fairly well with some of the expectations in a La Niña episode, including generally warmer and drier conditions across the southern and southeastern U.S., including all of South Texas, and cooler and wetter conditions from the central and northern Great Plains into the upper Midwest. The winds will continue to exacerbate drought conditions in South Texas (below) by quickening the pace of drying. With La Niña in full swing this spring, and the normal peak of windiness yet to come, residents and visitors to Deep South Texas can expect more of the same through March and perhaps beyond.
") |

