Overview
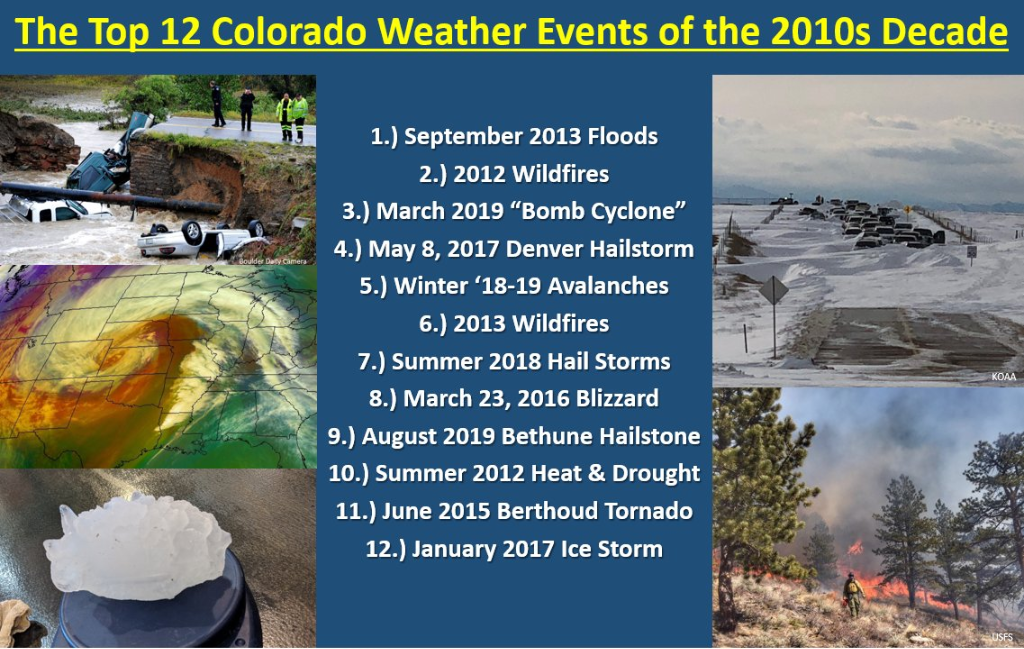
A number of different weather events, from 2010 through 2019, were voted on, by the staffs at all three National Weather Service offices in Colorado (Boulder, Grand Junction and Pueblo). From December 20th through December 31st, a daily countdown of the Top 12 Weather Events will be sent out on Social Media. They also will be listed on this page as well.
 |
An abnormally mild Pacific storm system moved through western Colorado during the early morning hours of January 9th, producing rainfall due to the increase in warm air aloft. A few days before this event, some areas in western Colorado received several inches of snowfall which allowed surface based inversions to form in many western Colorado valleys. Due to the cold air trapped in some lower valleys, temperatures remained below freezing at the surface which resulted in the formation of freezing rain as these inversions never broke.
Freezing rain is fairly uncommon in western Colorado, so that alone was noteworthy, but the extent of the freezing rain occurrence makes this an event to remember. Even locals who have lived in western Colorado for over 50 years, especially the Grand Valley, do not recall an event of this magnitude in their lifetime.
Freezing rain was first detected in the Steamboat Springs area around 2 in the morning, where over 4600 customers went without power due to a downed feeder line west of Clark likely caused by a coating of ice on the power lines due to freezing rain. Then between 4 am and 6 am, freezing rain occurred in La Plata County in southwest Colorado as well as the Grand Valley through Glenwood Canyon in west-central Colorado. This resulted in icy roads, numerous slide offs and accidents and major highways to be closed for the majority of the day due to accidents and cleanup activities, including Interstate 70 from Grand Junction to Glenwood Springs and Highway 160 from Durango to Hesperus Hill. Impacts were felt not only with the morning commute, but also at dispatch centers and hospitals that were overwhelmed. Emergency rooms at various hospitals throughout the Grand Valley, including Grand Junction, exceeded their daily admittance records with over 200 people treated for broken bones and other blunt force injuries due to the icy surfaces. Schools were also closed throughout the Grand Valley and many businesses were negatively impacted by either not opening, opening late or the lack of customers. This was the first day back from winter break for Mesa County schools, which in addition to the icy road impacts, crippled transportation. The Grand Junction Regional Airport also closed for several hours due to the ice, resulting in a few diverted flights.
An after action review was conducted by forecasters at the National Weather Service in Grand Junction to discuss lessons learned and updated guidance and policies moving forward with regards to issuing Ice Storm Warnings for any occurrence of freezing rain. An additional summary of the winter weather events surrounding this timeframe can be found here: https://www.weather.gov/gjt/2017Jan08-10_WinterStorm.
|
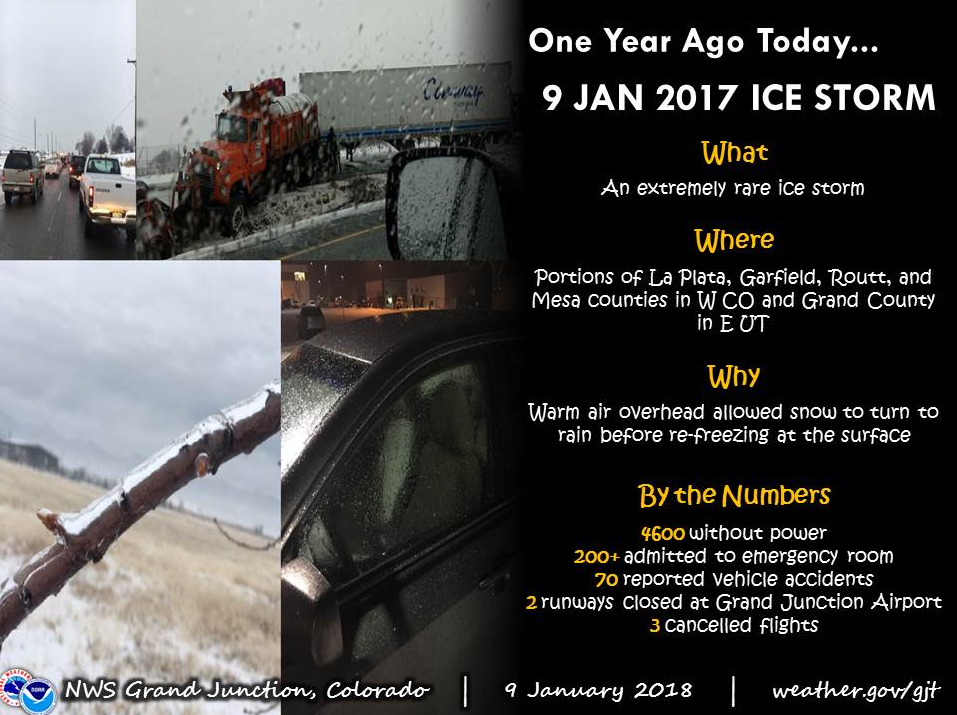
Social media post created on the one year anniversary of this rare ice storm event providing a summary of impacts
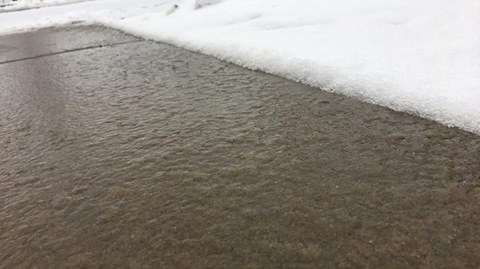
Photo taken of the icy pavement just outside the National Weather Service WFO in Grand Junction, CO (Credit: Mike Charnick)
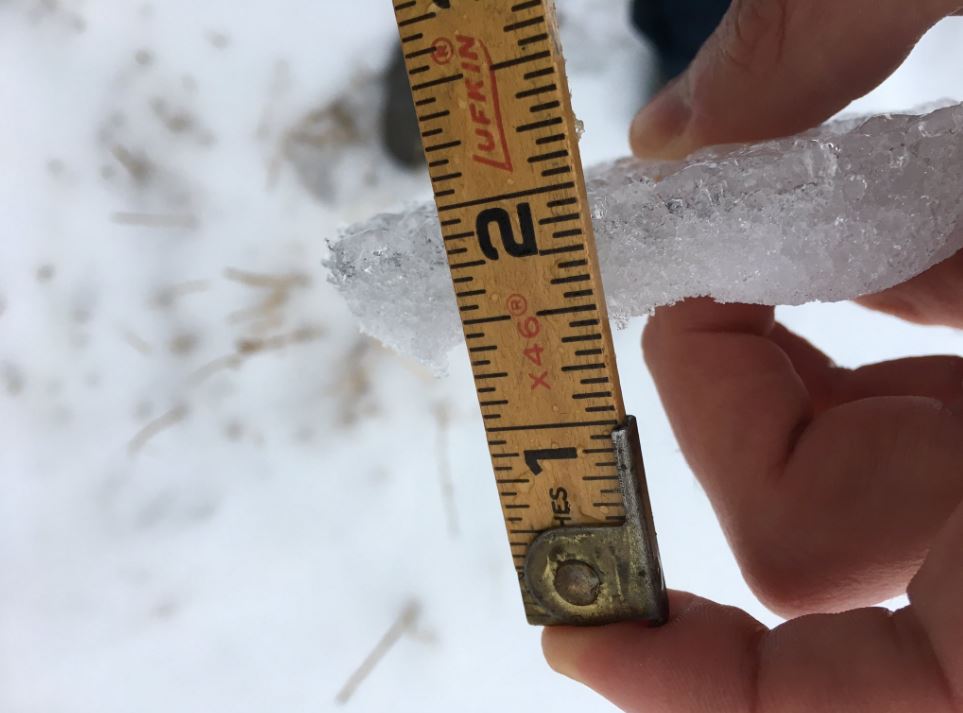
Photo taken of a measurement of ice thickness (half inch accumulation) in Grand Junction, CO (Credit: Mike Charnick) |
|
#11 Berthoud, Colorado TornadoJune 4th, 2015 Berthoud, Colorado(Click to view a direct page write-up)
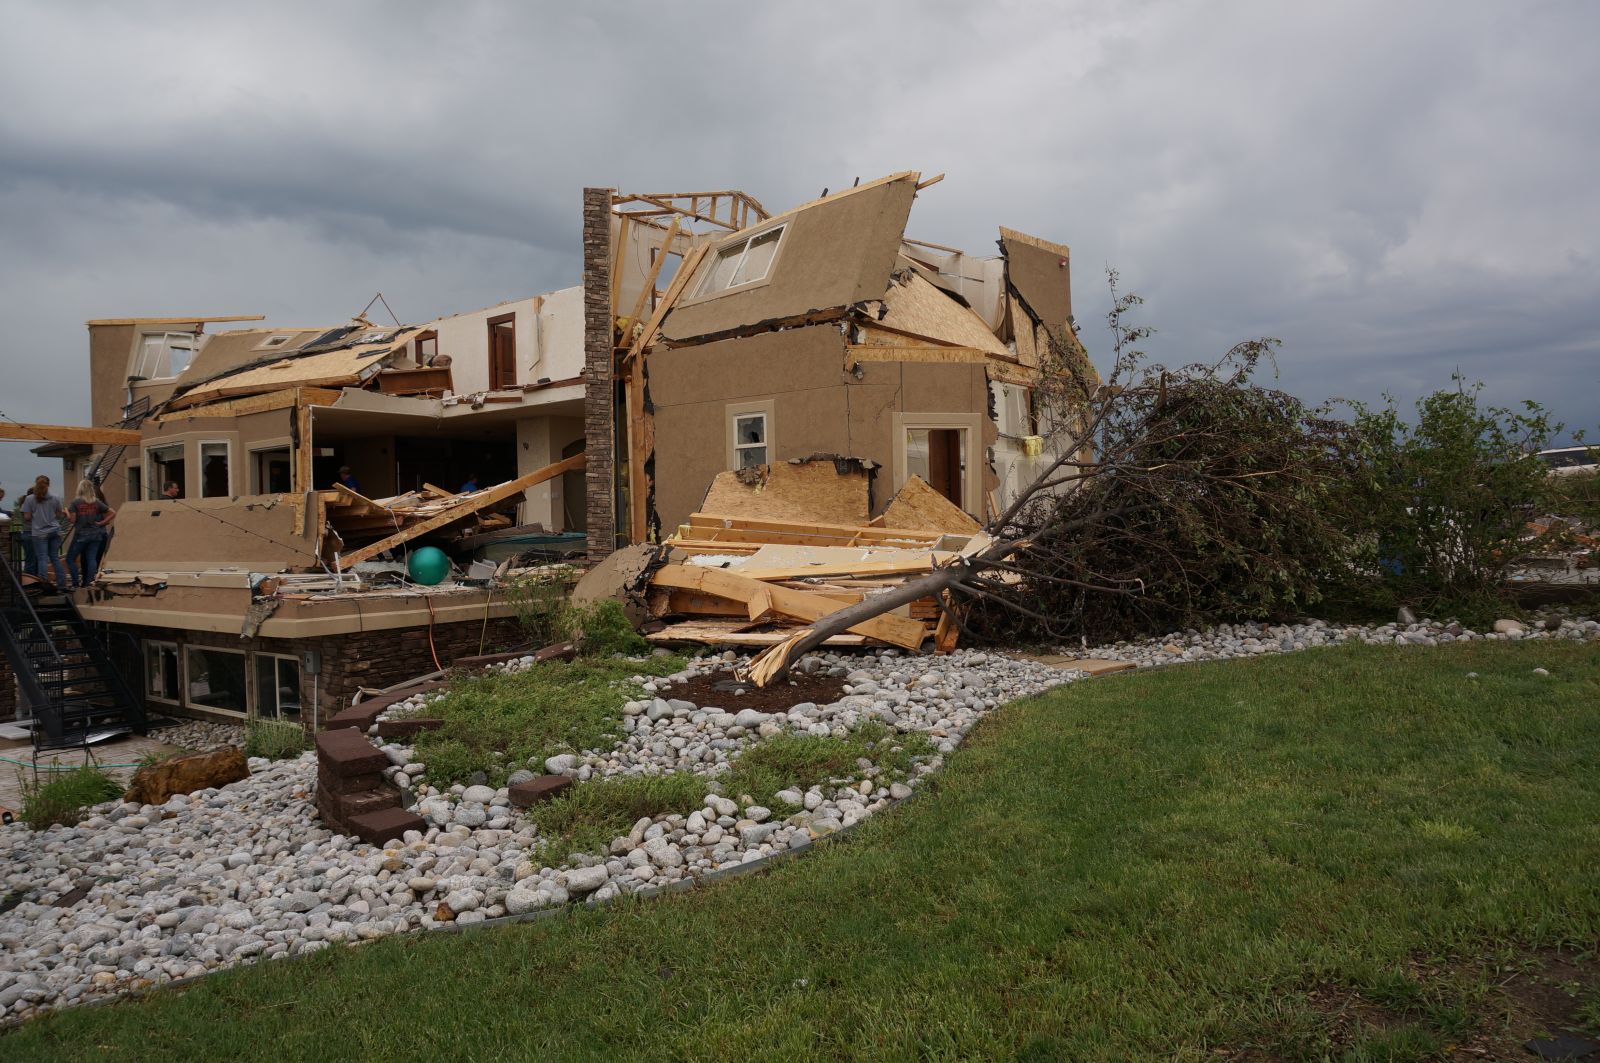
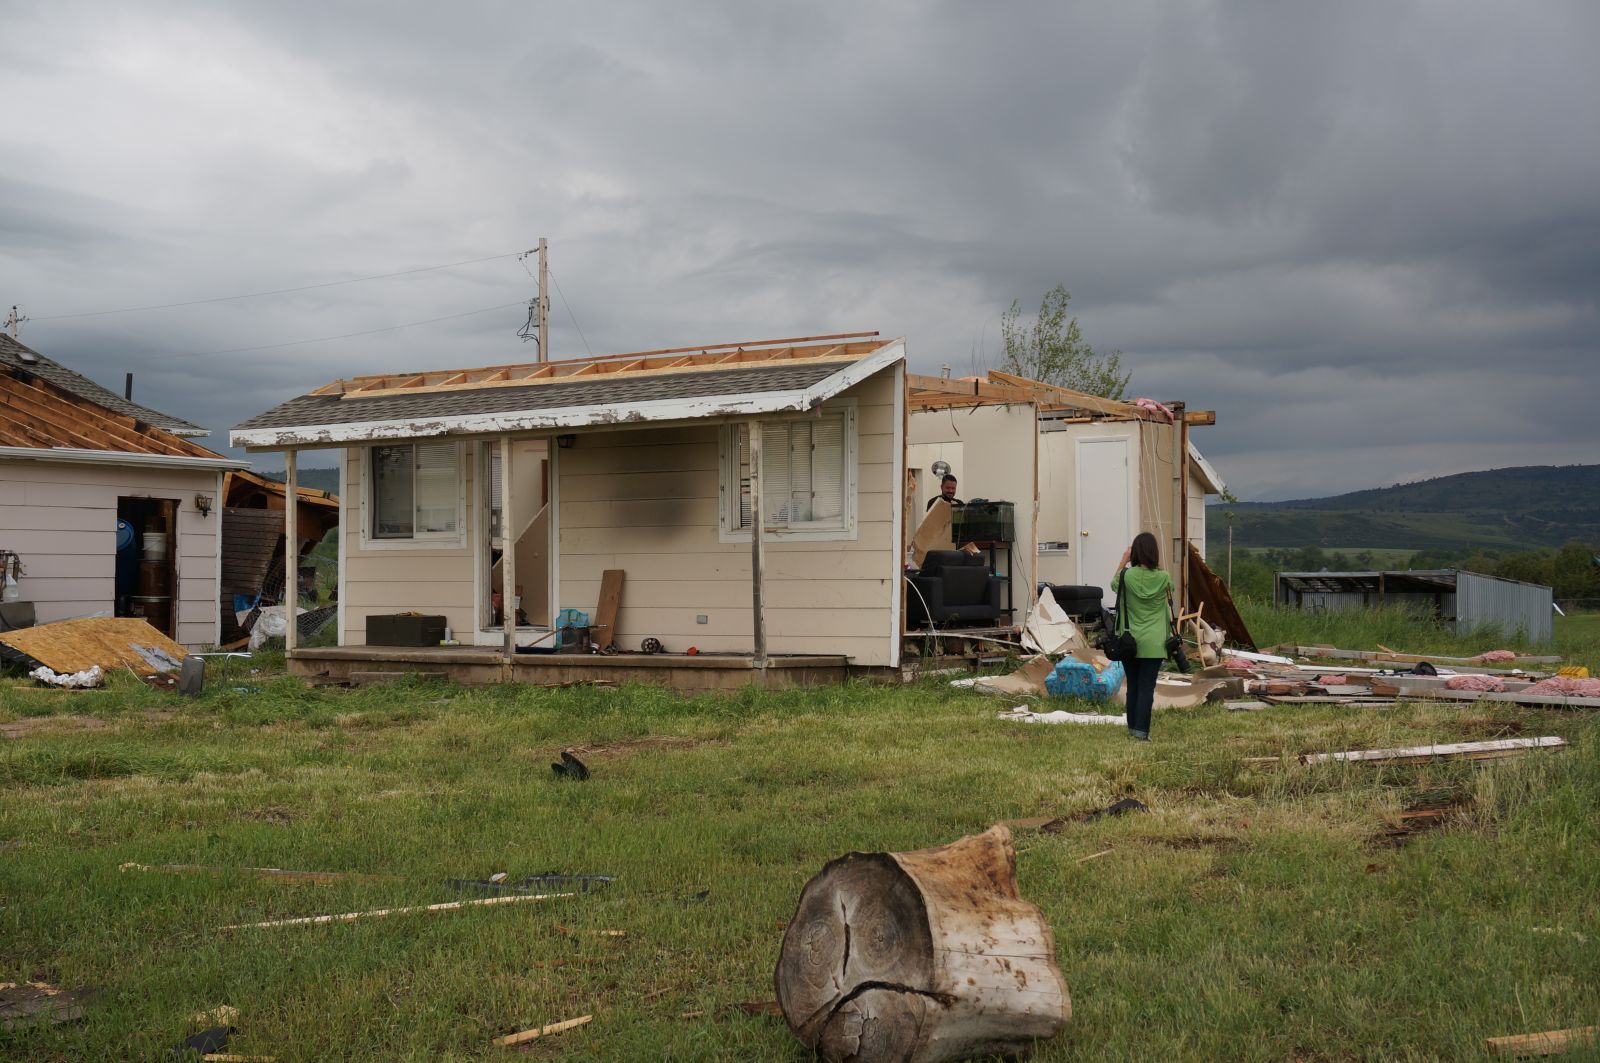
On the evening of June 4th, 2015 a rare EF3 tornado, with estimated wind speeds up to 140 mph, tracked almost due west along the Boulder, Larimer county line. The tornado was a quarter mile wide, at times, and had a patch length of 6 miles. Since tornadoes have been officially rated, starting in 1950, this is the strongest tornado on record that has affected Boulder and Larimer counties. 28 homes were damaged with three being destroyed. Fortunately, there were only a few minor injuries and no deaths.
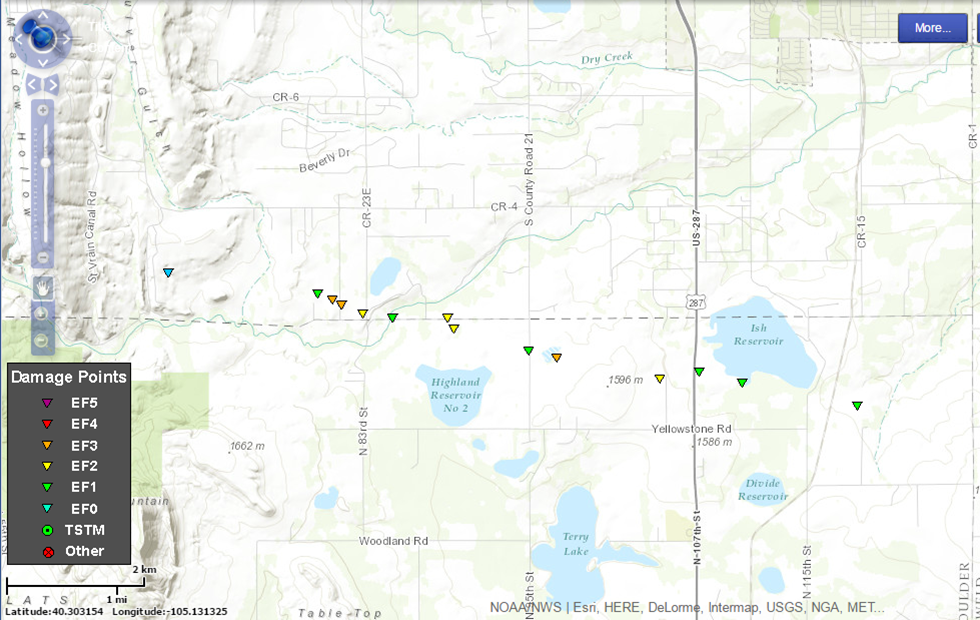
Tornado track and intensity based on NWS Storm Survey
EF scale: The Enhanced Fujita scale classifies tornadoes into the following categories: EF0...Weak......65 to 85 MPH Video of Tornado courtesy of Cory Reppenhagen
Reflectivity Loop at 0.5 Degrees
Storm Relative Velocity Loop at 0.5 Degrees
Damage pictures near the Boulder/Larimer county line
|
|
#10 Summer Heat Wave and Drought in ColoradoSummer of 2012 across the state of Colorado(Click to view a direct page write-up)
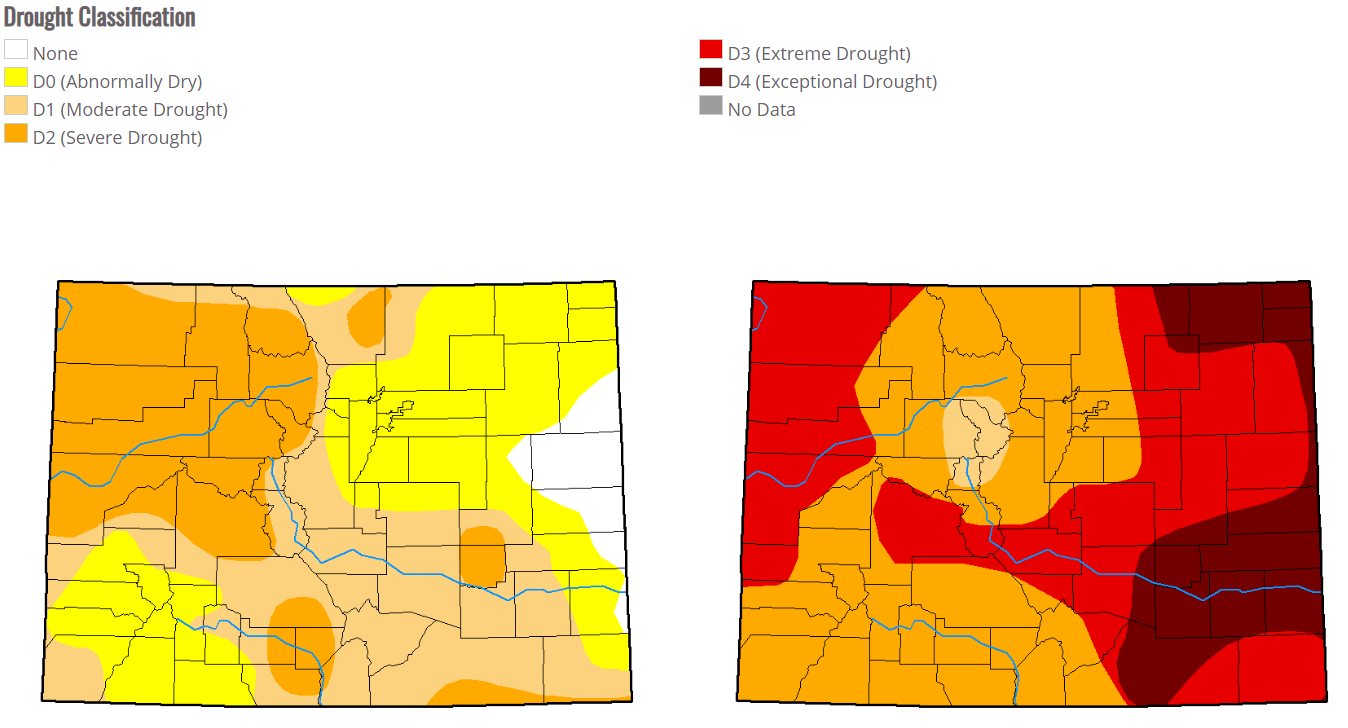
Moderate to severe drought conditions covered much of the state of Colorado by the end of May, continuing and worsening throughout the summer months into early Fall of 2012. Extreme drought conditions were felt across northwest Colorado. Leading up to these widespread severe to extreme drought conditions, snowpack basins for the winter of 2012 were at historically low levels. These near record low snowpack levels and resultant below normal runoff, in addition to below normal precipitation and above normal temperatures throughout the late Spring and Summer into early Fall contributed to the elevated drought conditions across the state and areas beyond just Colorado. High wildland fire danger, agricultural impacts and water shortages and restrictions were all being realized by the end of June across Colorado. Many record high temperatures were also set during the summer months, especially June, where June of 2012 was the hottest June in Denver since weather records began back in 1872. Many areas in western Colorado also saw record high temperatures including several 100 degree days. This record breaking and triple digit heat was felt statewide. Denver had a total of seventeen 90 degree days and a stretch of five consecutive 100 degree days during the month of June, compared to eighteen 90 degree days and six 100 degree days in Grand Junction during the same month. To put it in perspective, the normal high temperature in Denver during the month of June is 82 degrees on average, making high temperatures in June 2012 some 10 to 20 degrees above normal. On the other side of the divide, the normal high temperature in Grand Junction during the month of June is 88 degrees on average, making high temperatures in June 2012 some 8 to 12 degrees above normal which is still very hot for this time of year. Some relief to the hot and dry conditions were seen in early July across western Colorado due to an early onset of monsoonal moisture with several stations reporting above normal precipitation for the month of July. This was short-lived though as hot and dry conditions returned by August and into September with most of the area reporting well below normal precipitation, resulting in little change to the severe to extreme drought conditions and high wildland fire danger.
Map showing the change in drought conditions through the Summer of 2012. Map on left is the state of the drought as of May 1, 2012; the map on the right is the state of the drought as of Oct 2, 2012. (source: USDA)
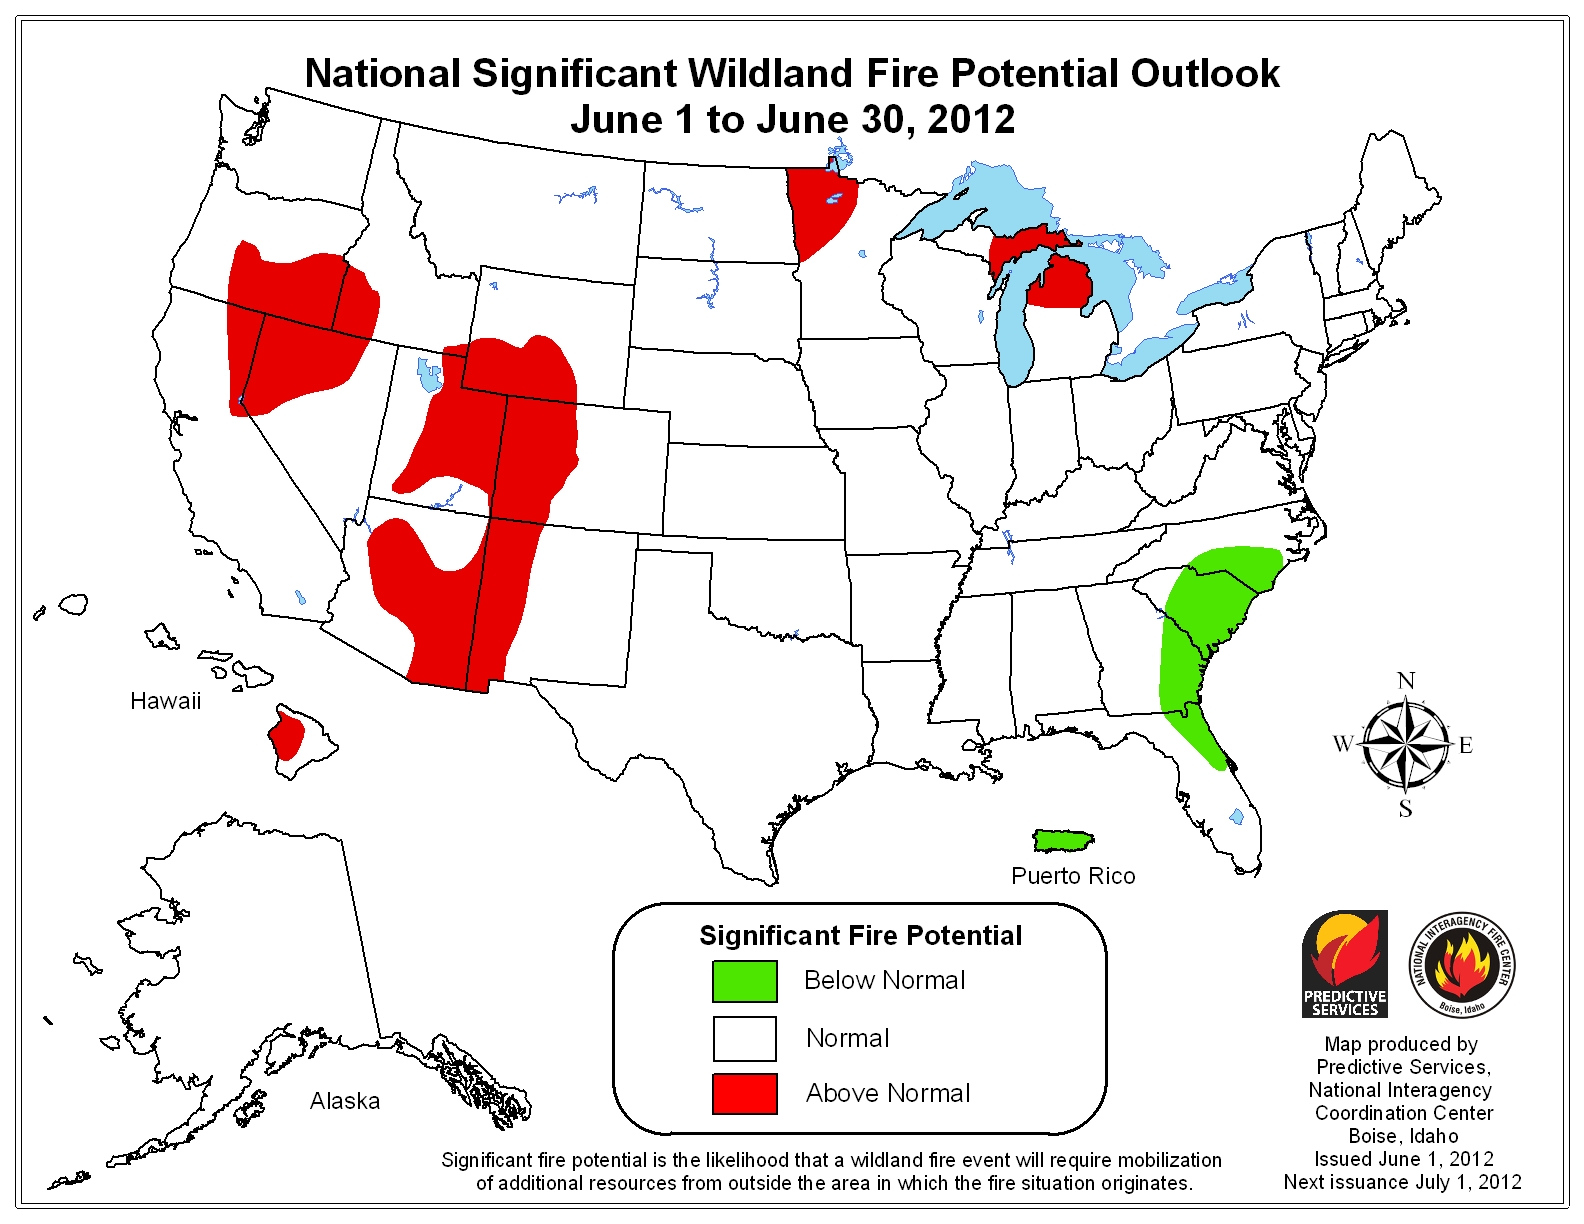
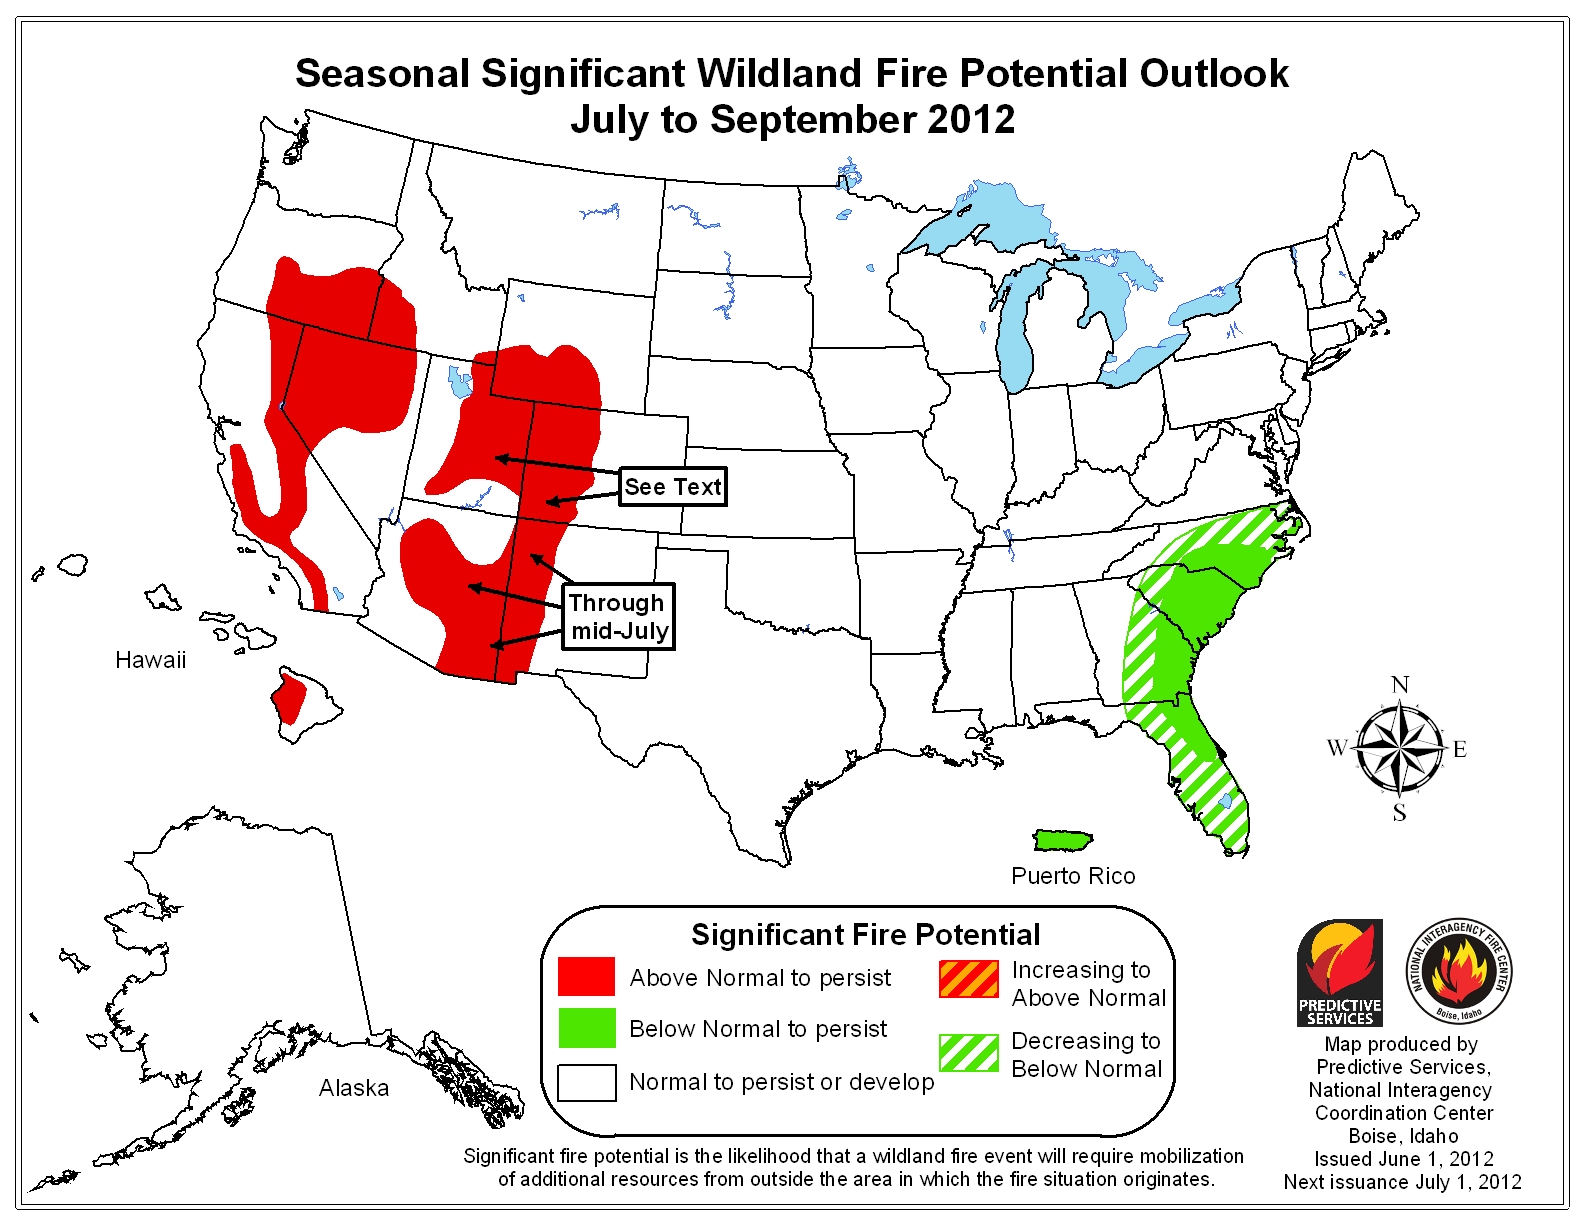
The following two maps below indicate the National Significant Wildland Fire Potential Outlook for June and then the rest of the summer into the Fall from July through September. These maps go to show the impact the heat and drought had on the wildfire season. (source: NIFC/Predictive Services)
|
|
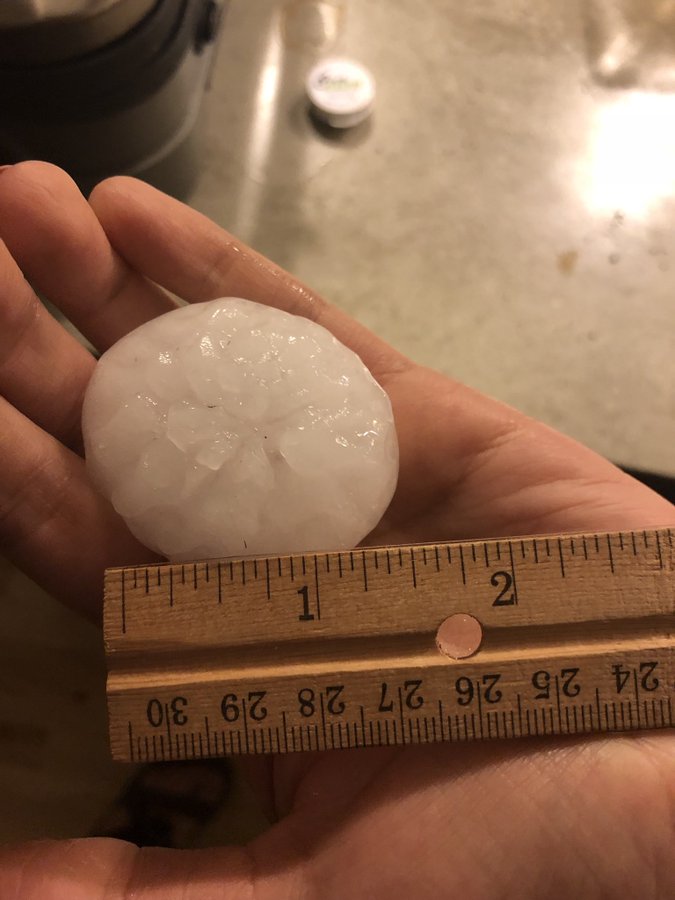
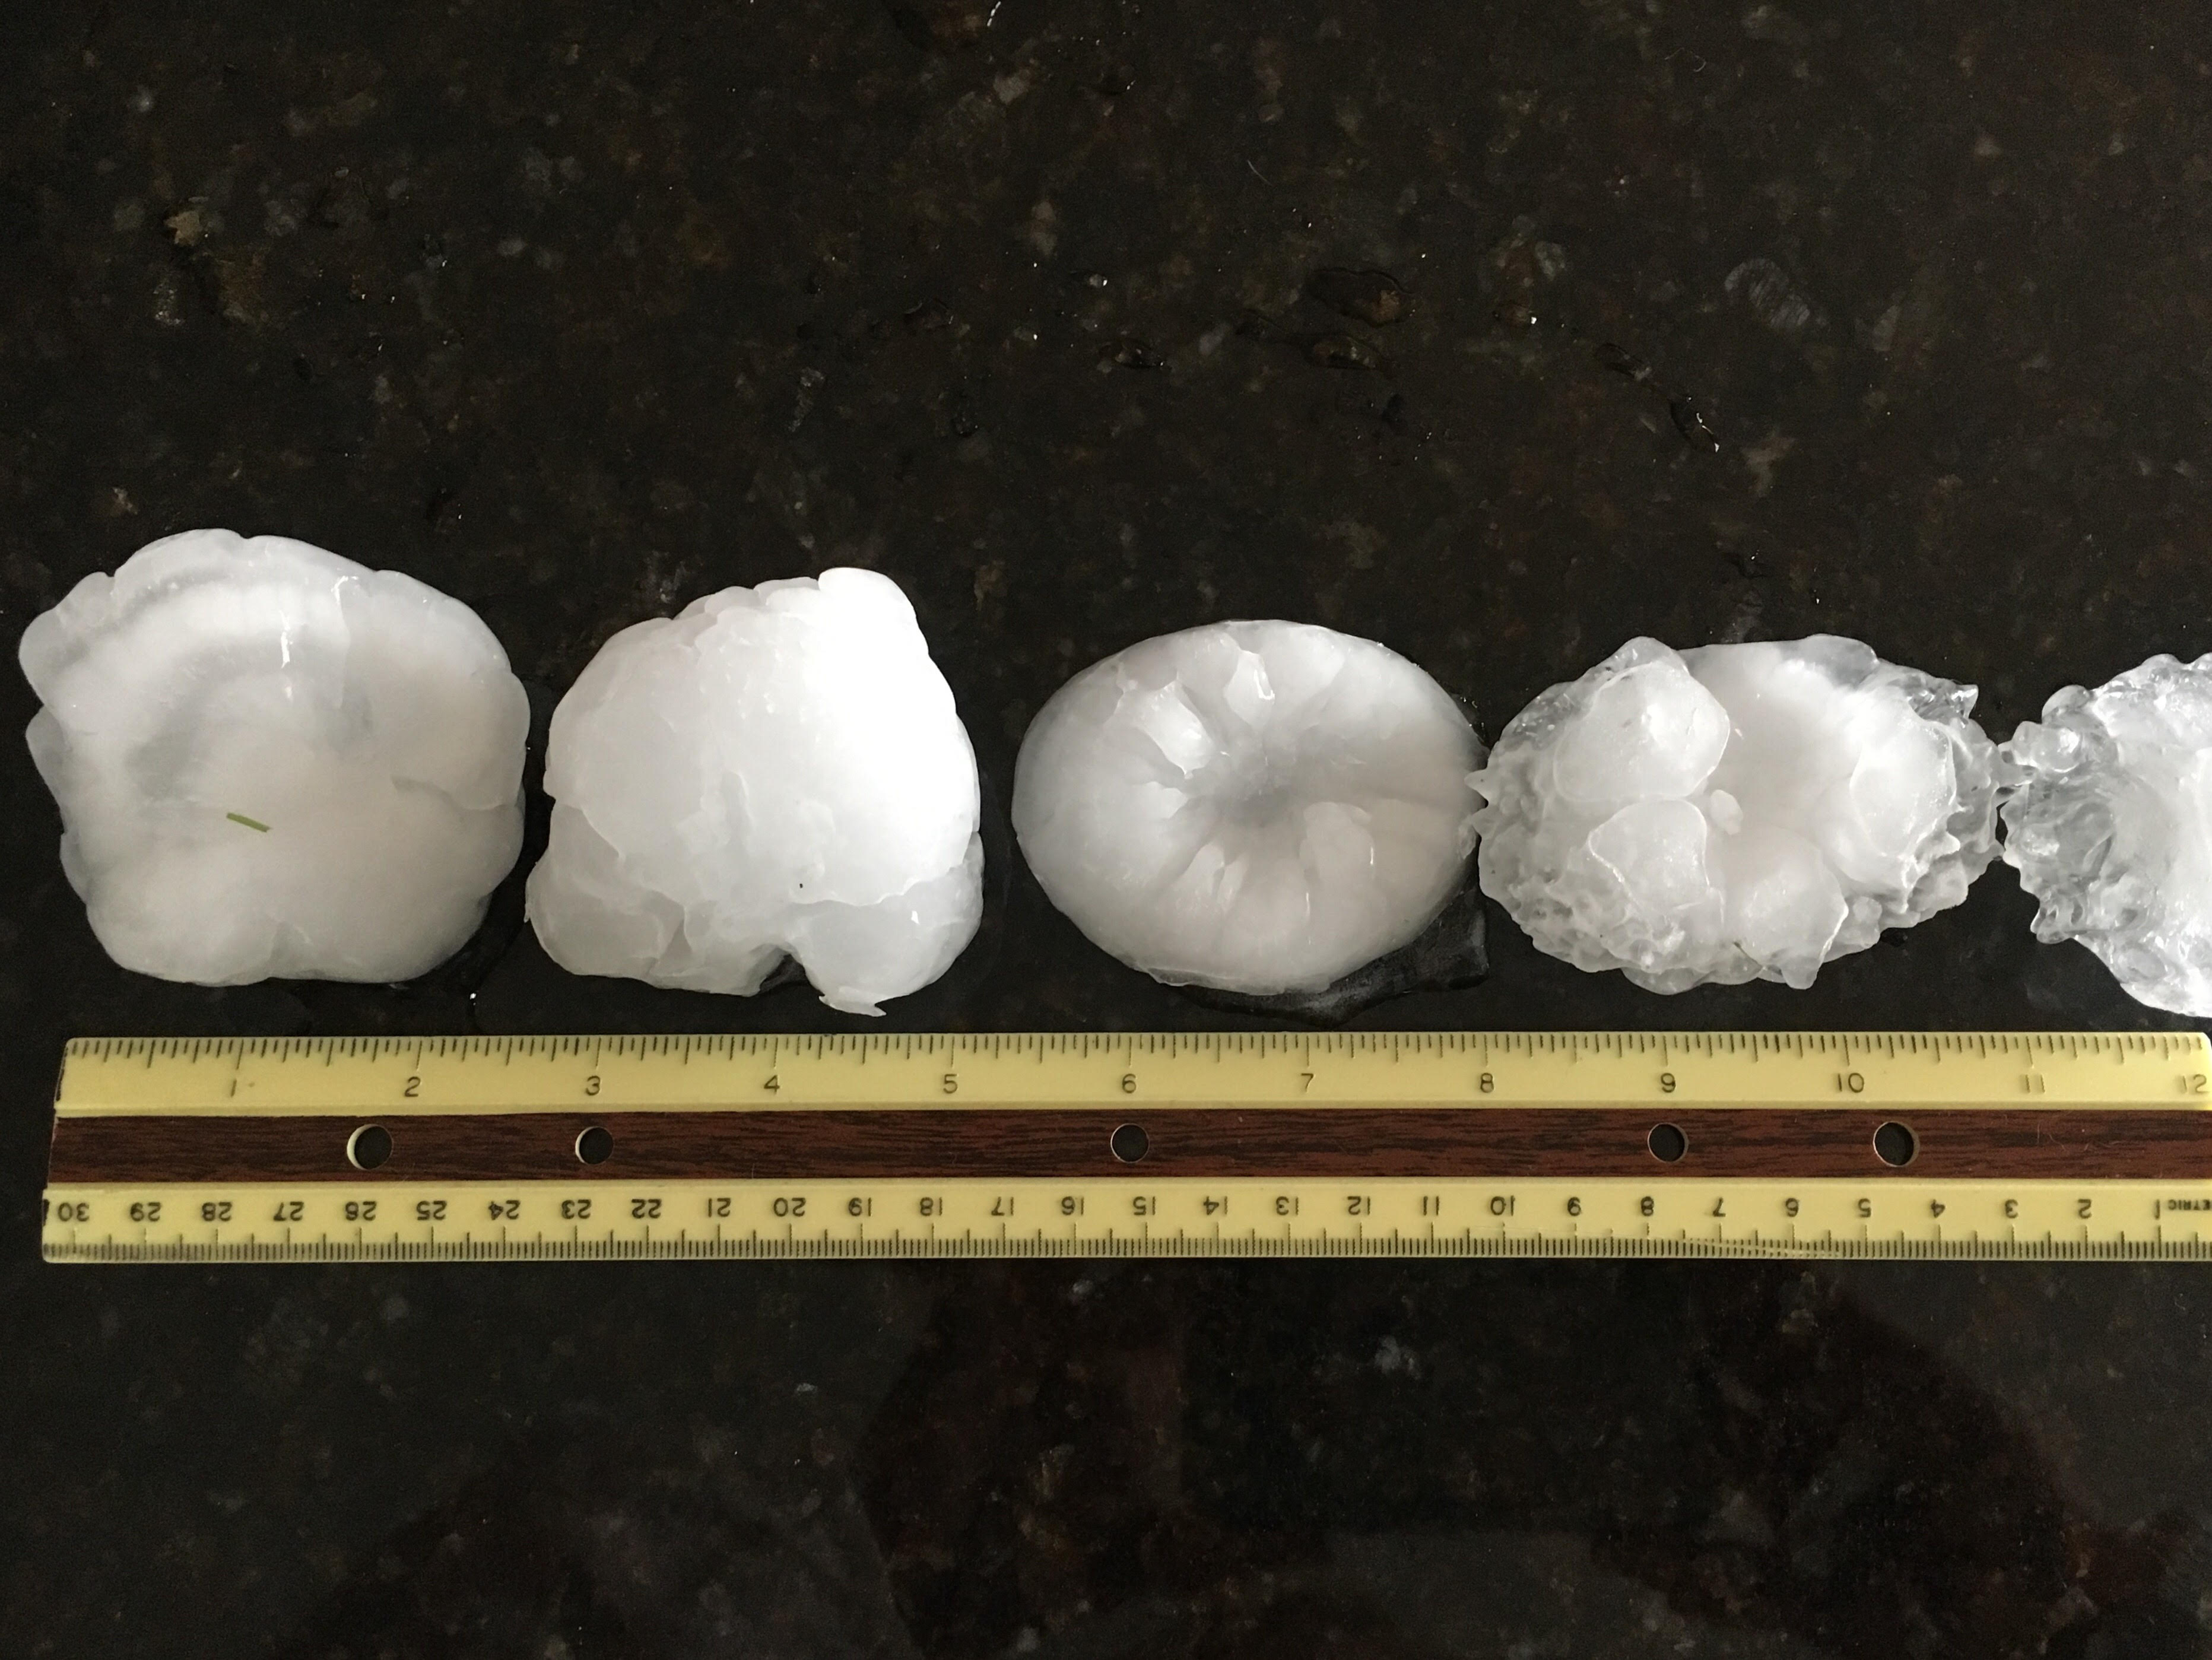
#9 The State of Colorado Record Size HailstoneAugust 13, 2019 in Bethune, Colorado(Click to view a direct page write-up)
Severe thunderstorms formed across eastern Colorado the afternoon of August 13, 2019. Several grew in strength and became supercells and by 2 PM several supercells began to interact with one another in northwestern Kit Carson County. At around 3 PM, the strongest of the storms generated hail to about 5" in diameter that fell on a farm northwest of the town of Bethune. This ended up being the largest hailstone officially analyzed and recorded in the state of Colorado. Amazingly, just two days prior and about 60 miles northwest of the record breaking hail, another supercell dropped grapefruit size hail with reports up of 5" diameter, but no hailstones were officially measured nor saved for later analysis from that event. The record breaking hailstorm occurred just outside NWS Boulder's area of responsibility, in western Kit Carson County, CO. NWS Goodland has a great write up of the hailstone, hail damage, and subsequent certification of the largest stone officially measured and validated in the state of Colorado, at 4.83" diameter. Please visit the NWS Goodland page for those details. https://www.weather.gov/gld/8132019CORecordHailstone
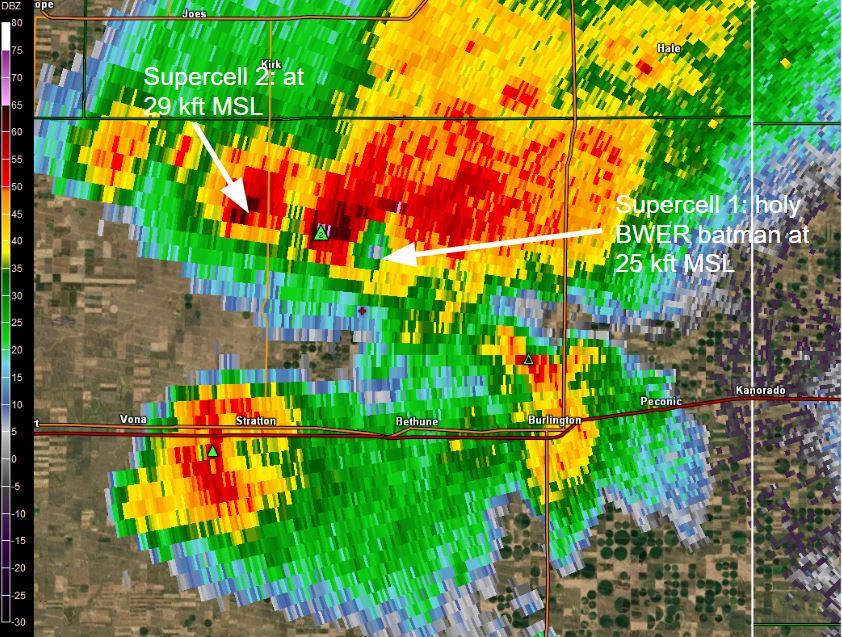
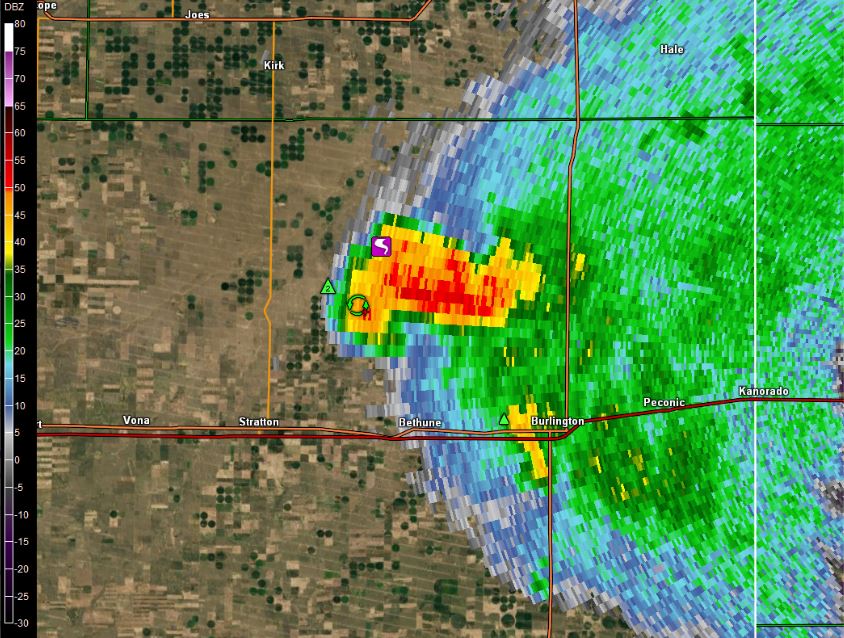
For a detailed and somewhat technical explanation of the radar characteristics, continue reading below.
The above is KGLD radar reflectivity from 2:50 PM MDT at the 5 deg elevation angle, showing the giant BWER in supercell 1, and a robust core aloft in supercell #2. The two supercells merged in the next 10 minutes or so.
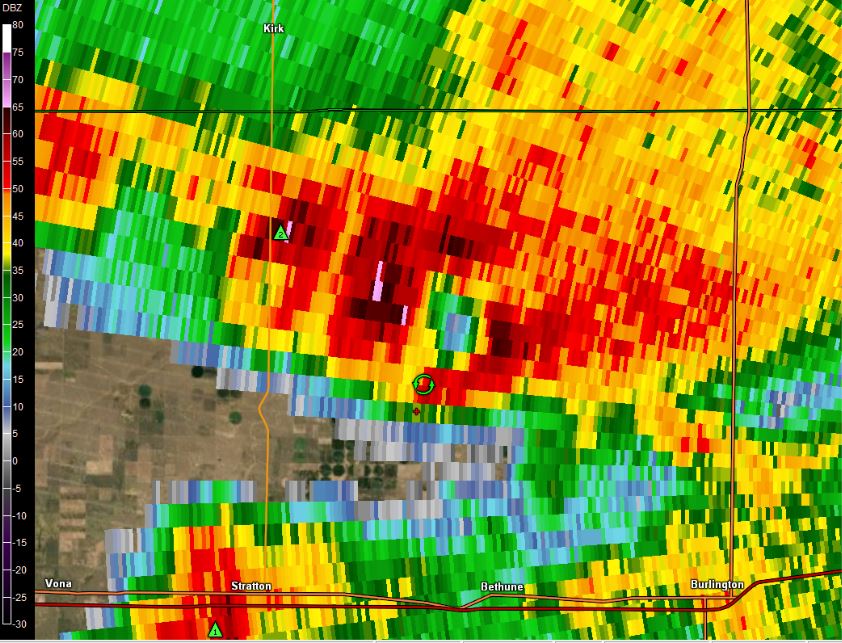
This is the next scan above is from KGLD radar reflectivity, at 5 deg elevation angle. A mesocyclone (rotation within the storm) is the green circle, just north of the red cross where the giant hail fell. This image is from 2:55 PM MDT, which is about 5 minutes from the record breaking hail reaching the ground. The storm has a giant BWER just northeast of the red cross, indicating the updraft is passing right over the red cross now.
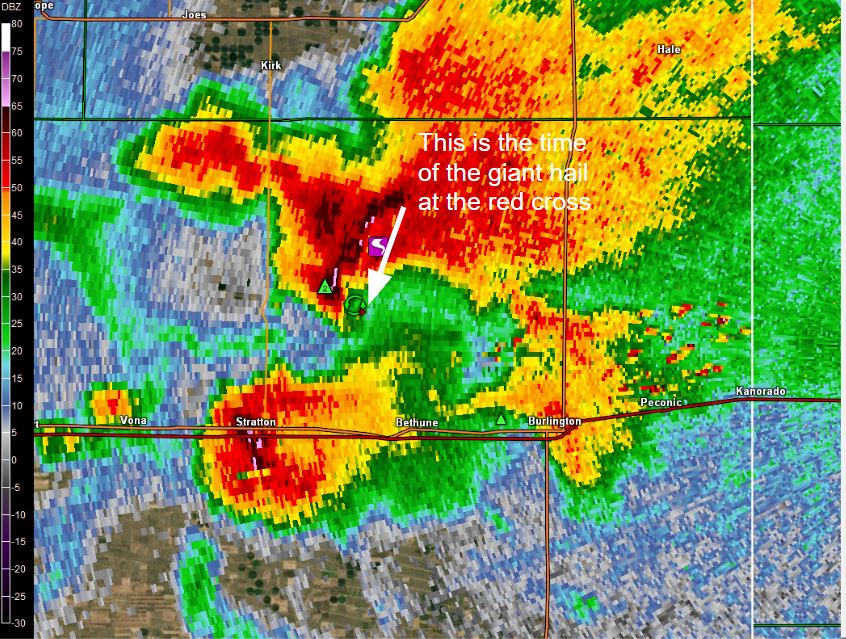
KGLD radar reflectivity at the lowest available elevation angle (0.5 deg) at 3:00 PM MDT. Note the red cross is located in the inflow notch, the location of the low-level updraft. This is a typical signature for giant hail in supercells. The largest hail falls very near the core of the updraft, and not typically associated with much rainfall or other sized hail. To the west of the red cross is the rear flank, normally associated with a drowndraft or descending air. In that region smaller hail and some rain would occur at the red cross site, after the giant hail had already fallen.
One final radar reflectivity image from KGLD radar at 3:02 PM MDT at 12.5 deg elevation angle. This is impressive. Directly overhead the red cross where giant hail had just reached the round, the storm top extends to over 55,000 feet above sea level (MSL)! There are radar reflectivity values at 54 dBZ at a height of 55,000 feet. The storm stop likely reached 60,000 feet MSL. This storm height is on par (though still a little less impressive) with some of the largest hail recorded in the U.S., in Vivian, SD (the U.S. record) and Aurora, NE (the previous U.S. record). The tornado icon is a local storm report of a tornado from this time. |
|
#8 The March 23, 2016 BlizzardMarch 23, 2016 Impacting Central and Northeast Colorado(Click to view a direct page write-up)
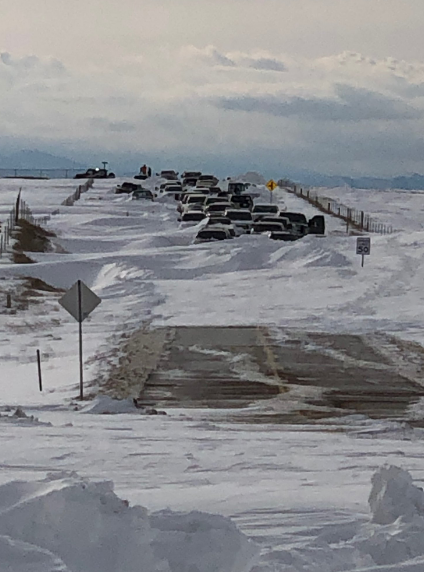
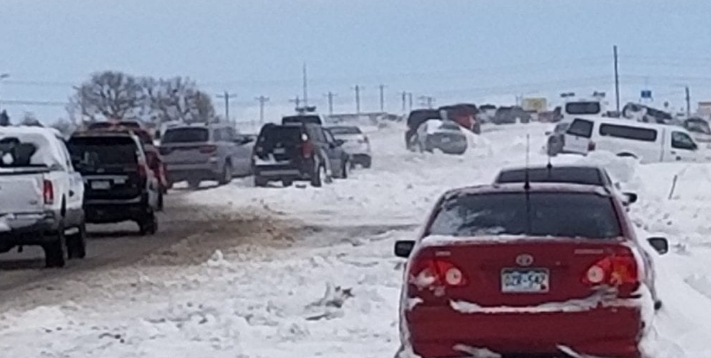
Overview: A powerful blizzard developed across the Front Range of Colorado late Tuesday, March 22, and continued through much of Wednesday, March 23, 2016. The storm tracked east/southeast across Utah Tuesday afternoon and evening, and then into Southeast Colorado by Wednesday morning. The storm rapidly intensified as the storm reached eastern Colorado, producing extremely heavy and intense snowfall with snowfall rates exceeding 3 inches per hour at times. In addition to heavy snow, strong winds gusting in excess of 50 mph east of Interstate 25 produced widespread blizzard conditions and zero visibilities. Further south across southern Colorado, peak wind gusts were between 70-80 mph.
FIGURE 1: Storm total snow from the March 23, 2016 blizzard.
Impacts: The storm initially began with rain on the plains, but quickly changed over to snow during the early morning hours of Wednesday. Snowfall rates of 1 to 2 inches per hour were common, with several inches of snow already accumulating for the Wednesday morning commute. Many roads became impassable due to the depth of fallen snow, drifting snow, and near zero visibilities during the day Wednesday. During the peak of the storm, snowfall rates reached or exceeded 3 inches per hour. The high winds, heavy wet snowfall, extreme snowfall rates, and near zero visibilities combined to produce significant impacts for travelers by land and air, as well as causing numerous power outages for local residents. CDOT enacted its first ever traction law for the immediate Denver area shortly before 7 AM Wednesday morning, requiring all commercial motor vehicles to chain up and all passenger vehicles to have four wheel drive or adequate snow tires. Road closures including portions of Interstate 25 near the Wyoming border, Interstate 70 east of Airpark Road, and Highway 287 northwest of Fort Collins began early Wednesday morning. Conditions continued to deteriorate through the rest of the morning as both snow intensity and winds increased. Between 11 AM and 1245 PM, most roads were closed, including the majority of Interstate 25 outside of the immediate Denver Metro area, Interstate 70 east of Denver to the Kansas state line, and Interstate 76 northeast of Denver. Dozens of vehicles became stuck and a semi-truck jackknifed on I-25 near Monument Hill, shutting down I-25 and trapping an estimated 2,000 vehicles or more. Hundreds of vehicles were stuck or abandoned on other Colorado roads. Numerous rescues were conducted through local police departments as well as the National Guard. Meanwhile, air travel also shut down with near zero visibilities at Denver International Airport. Around 1,300 flights were cancelled. The airport was closed for approximately 7 hours. It was only the third closure in the airports history, and the first time since the December 20, 2006 blizzard. Numerous power outages occurred as heavy wet snow accumulated on trees, despite the strong winds. Xcel Energy stated 290,000 customers in the Denver area alone lost power, and more than 50,000 customers remained without power through Wednesday evening. Power failures at NWS Boulder led to required backup services provided by NWS Pueblo. Thankfully, there were no direct fatalities as a result of the blizzard.
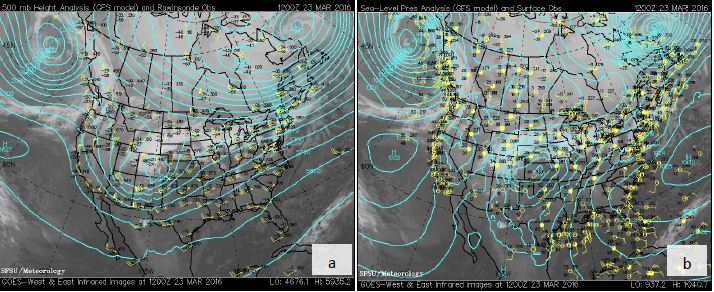
Meteorological Evolution: A deep upper level trough moved into the Pacific Northwest during the morning hours of Tuesday, March 22nd, and then moved southeast into central Utah by Tuesday evening (Figure 2a). At the same time, surface low pressure deepened over eastern Colorado (Figure 2b).
FIGURE 2. A. 500 mb heights, plot, and IR satellite. B. Surface MSLP countours, plot, and IR satellite. Valid at 0000 UTC 23 March, 2016 (6 PM MDT 22 March, 2016)
By early Wednesday morning, the upper low had cut off and was rapidly intensifying in Southeast Colorado as seen in Figure 3a. Meanwhile, the surface low pressure (Figure 3b) had begun to shift east into Kansas, but another piece of low pressure was holding back where strong surface pressure falls were occurring just ahead of the upper level low. This track was deeper, slower, and farther south and west than earlier model predictions had suggested, leading to much heavier snowfall than originally forecast for the Front Range Foothills and I-25 Urban Corridor from Fort Collins through Denver and the Palmer Divide.
FIGURE 3. A. 500 mb heights, plot, and IR satellite. B. Surface MSLP countours, plot, and IR satellite. Valid at 1200 UTC 23 March, 2016 (6 AM MDT 23 March, 2016)
With regard to progression of precipitation and the blizzard, heavy snow spread across the Front Range foothills by the midnight hour Tuesday night (March 23, 2016), while on the I-25 Urban Corridor the precipitation initially fell as rain. However, that rain quickly changed to a heavy and very wet snowfall (Radar Loop in Figure 4) with snow to liquid ratios close to 7:1. As a result, roads quickly became snow and slush covered making for difficult and hazardous travel in the early morning hours Wednesday.
FIGURE 4: KFTG radar reflectivity data from midnight through 5 PM. You'll notice a few jumps in the data, which are the result of communication issues during of the blizzard when radar data became temporarily unavailable. The 30-40 dBZ snow (yellow) part way through the loop, lasting until the end, indicates the heavy snow.
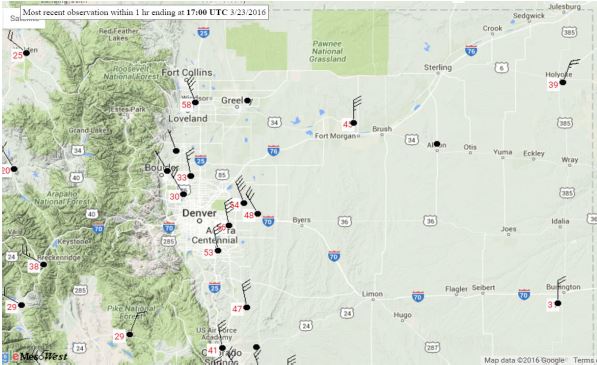
The area of heaviest snow with snowfall rates near 2 inches per hour shifted slightly eastward to just east of Interstate 25 between 6 and 7 AM, but then stalled and retrograded toward the Front Range Foothills again between 830 AM and 11 AM. In most storms, once the heavier snow band moves off the foothills it is very difficult to shift back westward again to the Front Range. This was not the case in this event and further research will be needed to diagnose the interaction between convection and the deformation zone in this storm. Snowfall rates in this extremely heavy band of snow were near a whopping 3 inches per hour, with a few observations suggesting close to 4 inch per hour rates as 0.5 degree KFTG radar reflectivity topped 40 dBZ (Figure 4). Winds had also increased across the plains, as 40 to 55 mph wind gusts (Figure 5) produced widespread blizzard conditions.
FIGURE 5: Sustained wind speeds (10 kts every long barb, 5 kts for a short barb), and peak wind gusts (in red) from the time period of 10 AM - 11 AM on March 23, 2016.
The radar doppler velocity values indicated the intensity of the winds the morning of March 23 (Figure 6)The peak intensity of this storm continued through mid-afternoon with widespread high impacts to travel by land and air. The snow intensity gradually decreased by late afternoon and ended in the evening as the storm pushed quickly east into the Central Plains. Storm totals (Figure 1 at the top) ranged from just a few inches over portions of the northeast Colorado Plains, to near 2 feet and considerably higher than originally forecast in the northwest sections of Denver and portions of the Front Range Foothills.
FIGURE 6: KFTG Doppler velocity for March 23, 2016 from roughly 5 AM through 6 PM. Doppler velocity is in kts. Keep in mind the further away from the radar (black circle right of center), the higher above the surface the winds are being measured. Within a 5 mile radius of the radar, the Doppler velocity winds will mirror winds near the surface. Also, because the radar can only measure the speed of the wind towards or away from the radar, you only see the strongest winds from north (toward the radar) to south (away from the radar). Those intense winds were nevertheless impacting just about the entire region along and east of I-25. |
|
#7 Summer 2018 Hail StormsJune 13th - Colorado Springs, June 18-19th - Denver Metro, August 6th Colorado Springs(Click to view a direct page write-up)Colorado has always been known for hail storms, but during the Summer of 2018, there were multiple severe hail storms that developed over Colorado's largest population centers, the Denver metropolitan and Colorado Springs, causing around $620 million in damage spanning three different events.
June 13th, 2018 El Paso County - Colorado Springs/Fountain:
June 18th, 2018 - Denver Metropolitan Area: Whenever a persistent, long lasting severe thunderstorm develops over a major metropolitan area, the damage is widespread and costly. Though this storm didn't produce the largest hailstones of the three mentioned in this overview, it was the costliest. This thunderstorm dropped 3" hailstones in Louisville, Colorado and caused $277 million in damage. Follow this link to the NWS BOU write-up of the storm: https://www.weather.gov/bou/HailJune18th
August 6th, 2018 - Colorado Springs: A very strong severe thunderstorm develop over Teller County during the afternoon of August 6th, 2018, then traveled southeast over the Highway 24 corridor, reaching the Cheyenne Mountain Zoo. The severe thunderstorm dropped 3 - 4" hailstones over the Cheyenne Mountain Zoo and southern Colorado Springs. The estimated damage caused by this event was $173 million. A good overview of the injuries at Cheyenne Mountain Zoo can be found here. Follow this link for a meteorological write-up of the event: https://www.weather.gov/pub/20180806_ElPasoHail
|
|
#6 2013 WildfiresBlack Forest Fire / West Fork Complex(Click to view a direct page write-up)
The Black Forest Fire began on June 11th, 2013 around 1:00 PM near Highway 83 and Shoup Road in Black Forest, Colorado, located in north-central El Paso County. The fire grew into what is considered the most destructive forest fire in Colorado history. The cause of the fire is still uncertain to this day. The fire only burned 14,280 acres but destroyed 511 homes and caused 2 fatalities. The total damage from this event was at an estimated cost of $463 million and a total of 38,000 people had to be evacuated during the fire. The fire was considered contained on June 21st, 2013. Leading up to the fire, there were anomalously dry conditions across all of Colorado. Black Forest was on the line of a "D2 Severe Drought" and a "D3 Extreme Drought" on the day the fire started. The NWS office in Pueblo did issue a Red Flag Warning on the day of the fire, warning people to avoid activities that could start fires, forecasting or gusty winds, record high temperatures, and low relative humidity values.
Other Notable Fires in 2013: On June 11th (the same day as the Black Forest Fire), a destructive wildfire occurred in the Royal Gorge Park and surrounding area. The wildfire scorched 3218 acres, burned 48 of the 52 buildings in the Royal Gorge Park, closing the park. The fire did burn some of the Royal Gorge Bridge, but ultimately, the bridge was saved.
|
|
#5 Colorado Avalanches in the Winter of 2019Winter of 2019 across the state of Colorado(Click to view a direct page write-up)
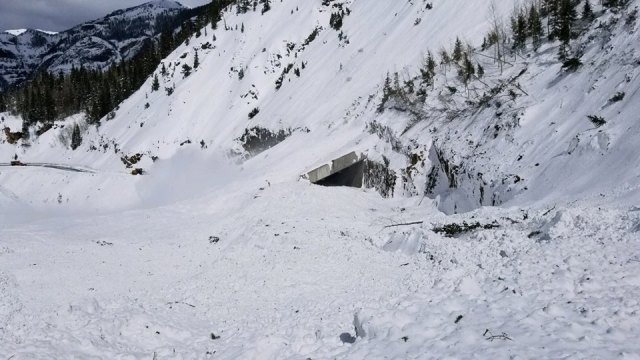
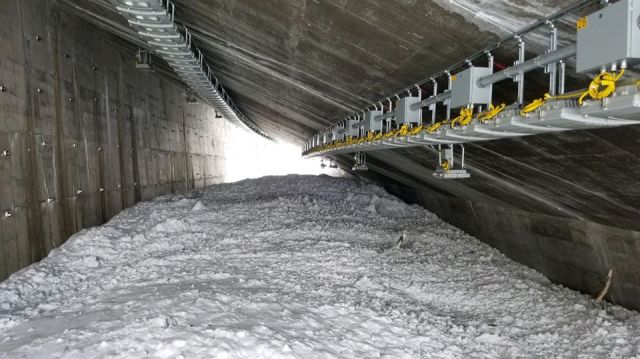
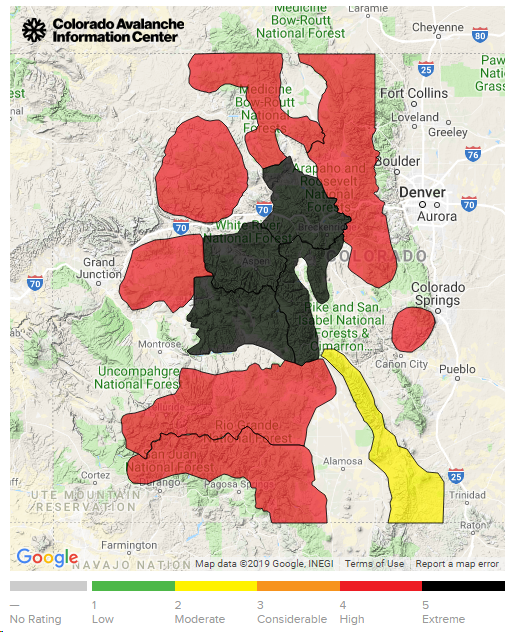
The Winter of 2019 will be remembered by most who live in Colorado as one of epic proportions. Not only did the majority of mountain areas see above normal snowpack for the season, but the amount of moisture helped to significantly reduce the extreme drought conditions during the summer of 2018 practically eliminating the drought conditions across the state by Spring of 2019. This above normal snowpack saw a dramatic increase from February through March as a series of Pacific storms pummeled the state, resulting in heavy wet snow on top of an already deep snowpack. This resulted in a significant avalanche cycle in the mountains of Colorado where pretty much every avalanche path ran, including newly discovered paths and paths that haven’t ran in a very long time. This very active weather pattern was driven by several atmospheric river events, resulting in higher amounts of moisture and warmer temperatures. An atmospheric river is a flowing column of water vapor in the atmosphere that is responsible for producing significant amounts of rain and snow, especially when directed towards mountains. Another reason for the increase in snowfall was a very active pattern of the Madden Julian Oscillation which, when combined with atmospheric river activity, leads to an increase in enhanced lift and orographic snowfall in the mountains. One to three feet of snow fell with each storm event in the mountains, with some areas seeing storm totals greater than three feet. Among the more notable of the hundreds of avalanches that occurred from mid February to mid March was a natural avalanche that occurred on Interstate 70 over Vail Pass during the March 6 to 8 storm event, which was measured at 6 feet deep. After mitigation was completed, this brought more snow down, resulting in a total depth of 15 feet with a path about 100 feet wide covering both east and westbound lanes. The avalanche danger was very high, resulting in the closure of Red Mountain Pass in the San Juan Mountains of Southwest Colorado from March 3rd through March 22nd. Extensive mitigation on Red Mountain Pass on March 10th brought down 40 to 60 feet of snow onto Highway 550, practically filling the Colorado Department of Transportation snow shed. To put in perspective how historic this natural avalanche cycle was, 1000 avalanches were reported to the Colorado Avalanche Information Center (CAIC) during the two week period during the first half of March 2019. 87 of these 1000 were of the class D4 or greater during this two week period. Only 24 avalanches of D4 or greater occurred from 2010 to 2018.
Photo of the buried snow shed on Highway 550 near Red Mountain Pass after avalanche mitigation brought down a total of 60 feet of snow. (Credit: CAIC/CDOT)
Photo from inside the snow shed on Highway 550 near Red Mountain Pass after avalanche mitigation brought down a total of 60 feet of snow. (Credit: CAIC/CDOT)
Map showing the avalanche danger as of March 7, 2019 from High to Extreme. (Source: CAIC)
Graphic showing the snowpack levels across the state of Colorado for Water Year 2019 (dark blue) compared to average (red) and previous few years. Notice the sharp increase from mid February through mid March. (Source: USDA)
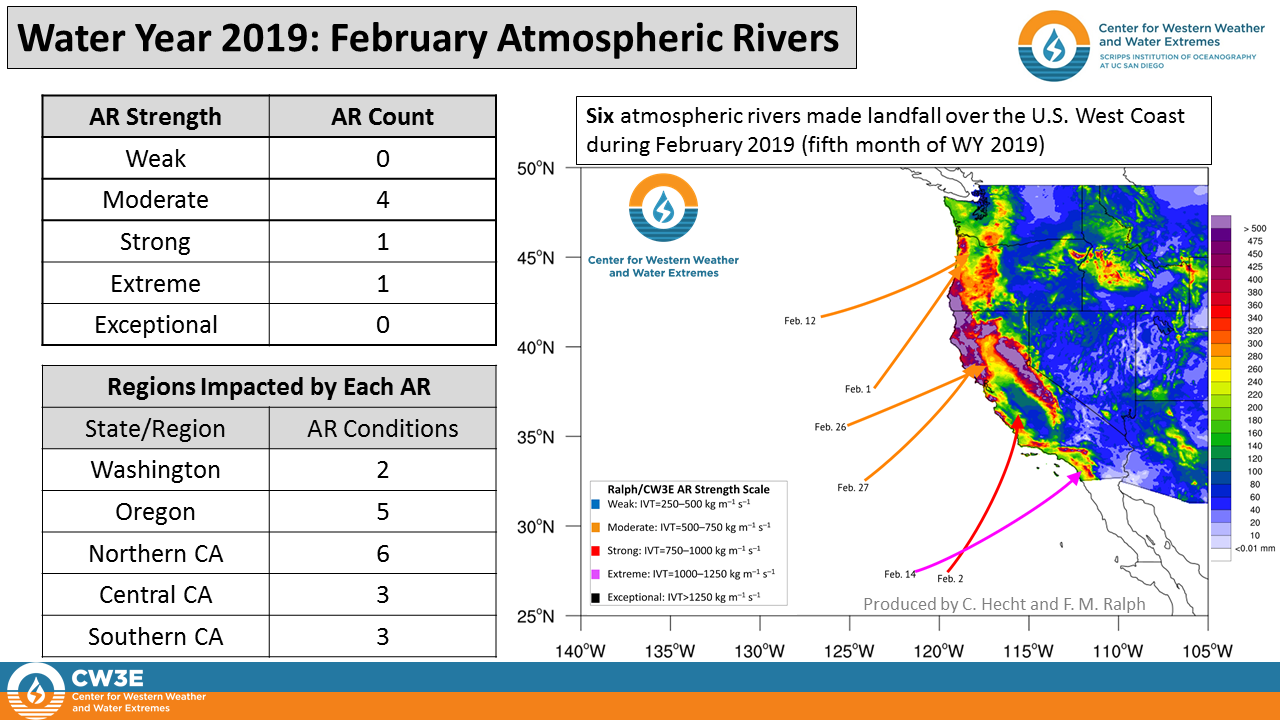
Graphic showing the atmospheric river events from February 2019, including the extreme AR event in mid February that brought significant snow to the Colorado mountains. (Source: Center for Western Weather and Water Extremes)
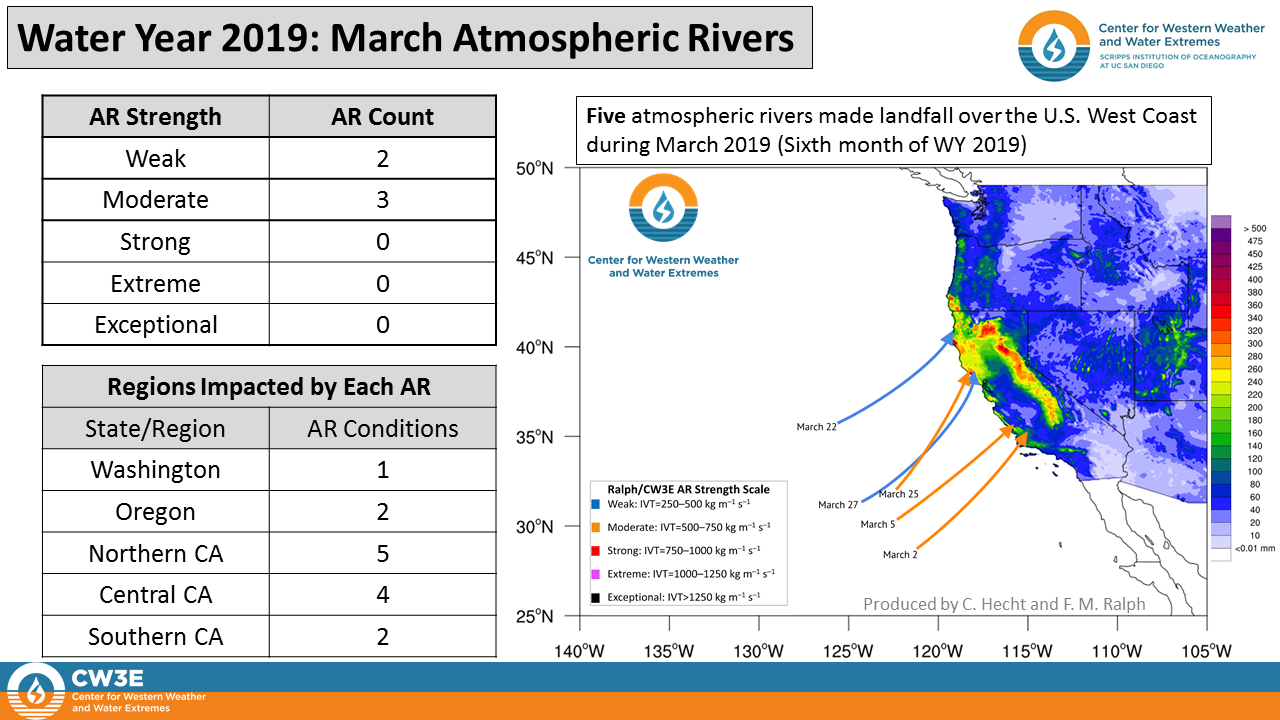
Graphic showing the atmospheric river events from March 2019, in which a few moderate AR events occurred in early March. These AR events led to more significant snowfall across the Colorado mountains, helping contribute to the historic avalanche cycle. (Source: Center for Western Weather and Water Extremes)
Graphic showing the strength and trajectory of the Madden Julian Oscillation from January through March of 2019. Zones 8 through 4 are more representative of when the MJO impacts the west coast of the United States. As you can see by the green line (February) and the blue line (March), it indicates the MJO was most active with more moderate activity from late February through mid March. This timeframe coincided with many of the AR events that helped contribute to a series of storms producing significant snow for the mountains of Colorado. (Source: Bureau of Meteorology in Australia) |
|
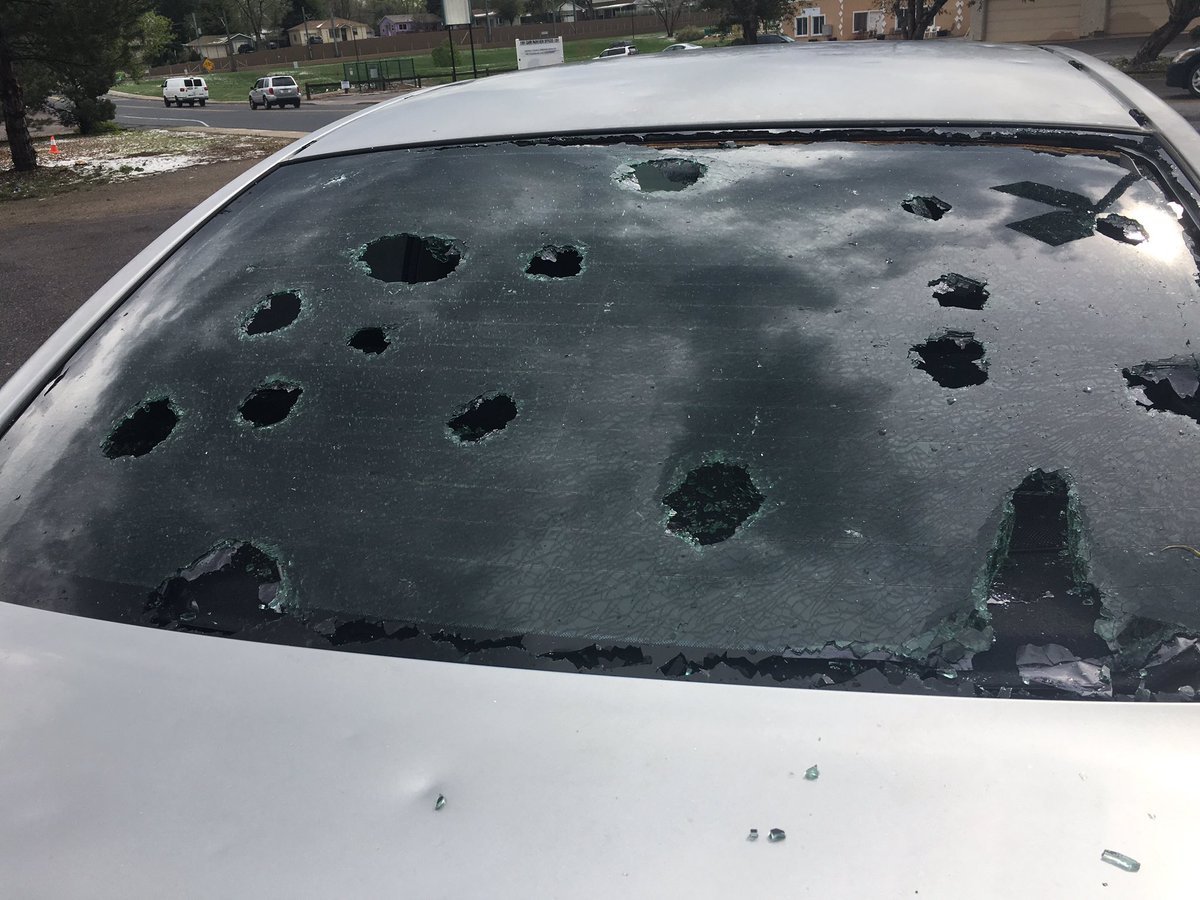
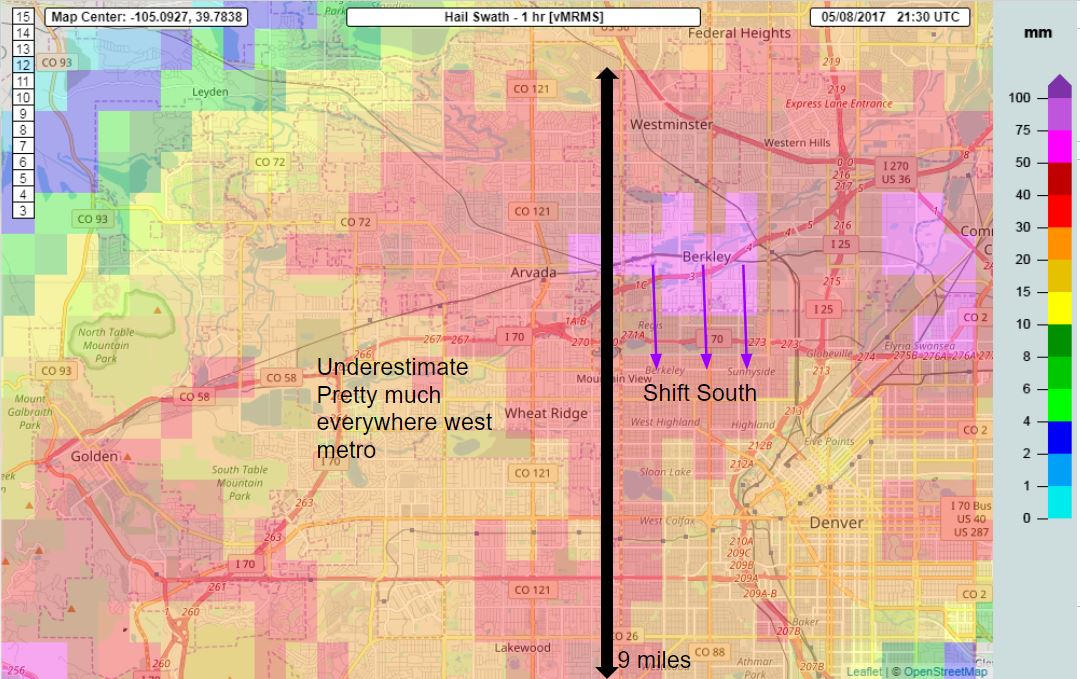
#4 The Second Costliest Hailstorm in U.S. HistoryMay 8, 2017 Metro Denver, Colorado(Click to view a direct page write-up)
Photos & Video
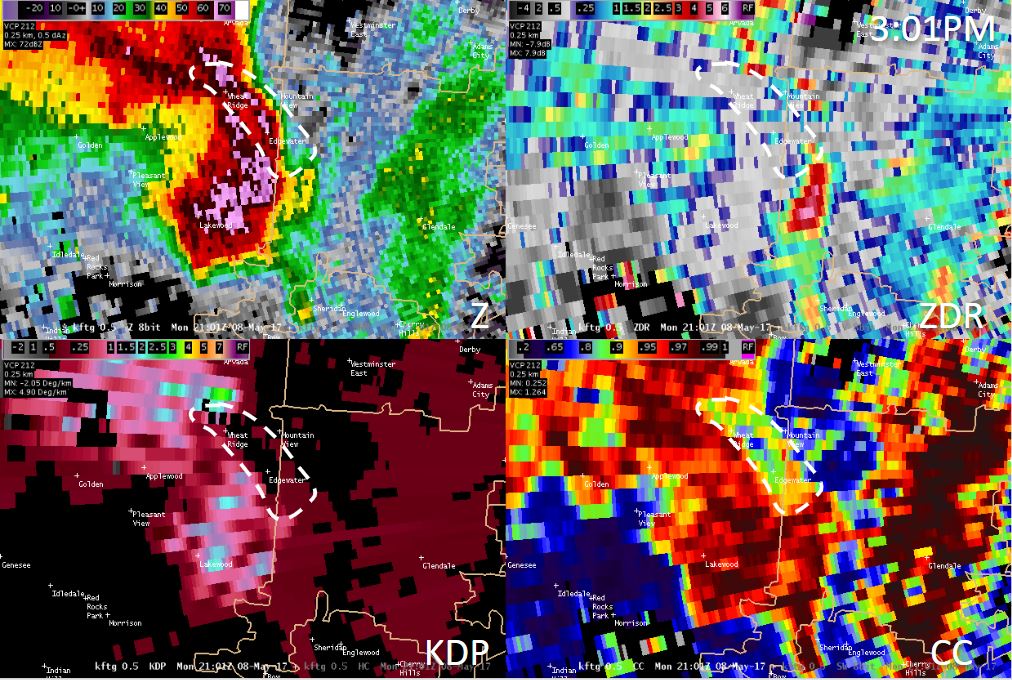
Radar
Storm Reports Businesses and homes sustained holes in siding along with broken windows and torn screens. The high cost incurred from the storm was due to a number of factors including: the size of the hail, the densely populated area, the time of day, the escalating costs to repair high-tech cars, and more expensive homes. Colorado Mills Mall in Lakewood was severely damaged after hail busted skylights and caused flooding inside stores. The common areas and tenant spaces suffered substantial water damage. Extensive damage to electrical systems, mechanical systems, including HVAC and lighting, kept the mall closed until November 2017. In Lakewood, the loss in sales tax was projected to be about $350,000 per month, which was 3 to 4 percent of the city's monthly budget. Prestige Imports in Lakewood which sells high end automobiles like Audis and Porches, estimated 250 to 300 vehicles were impacted by the storm. Some of those vehicles were valued at nearly $200,000 each. Significant damage was reported at Lutheran Medical Center after a hailstorm tore through Wheat Ridge. The hospital building and some of the medical office buildings sustained broken windows. The storm also hit the office of the Denver Federal Center in Lakewood, which includes the Colorado Bureau of Investigation. The offices were flooded, several cubicles destroyed, and even some ceiling tiles fell off. The storm damage prompted school officials to close all thirteen Adams 12 Five Star schools in Commerce City and Beach Court Elementary school in Denver. Most of the schools in the Adams 12 Five Star District are at least 50 years old and sustained flood damage. Large hail damaged an apartment building near Regis University, shattered windows and punctured the siding on the west-facing side of the building.
|
|
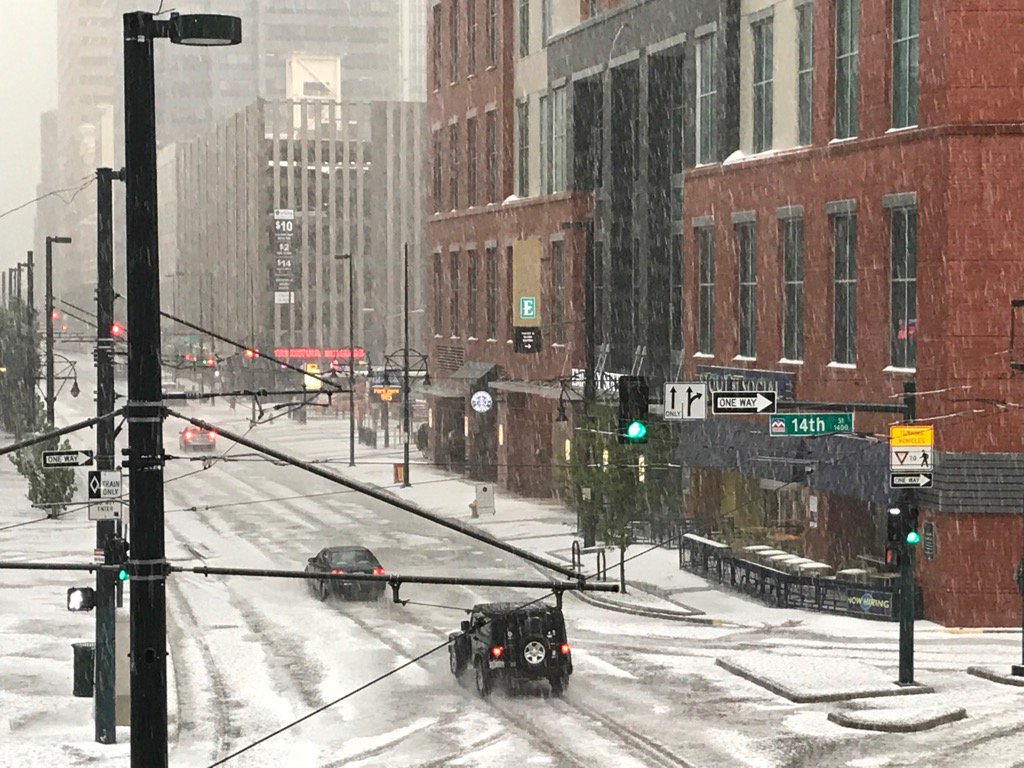
#3 2019 Bomb CycloneMarch 13th, 2019(Click to view a direct page write-up)
Overview: On March 13th, 2019 an extremely powerful low pressure system developed over southern Colorado, setting a record for the lowest pressure ever recorded over Colorado, at Lamar, of 970.4 mb. The system officially met the criteria of a "Bomb Cyclone", in which barometric pressure readings dropped in excess of 24 mb (0.71 in Hg) over a 24-hour period. This storm created widespread blizzard conditions across northeast Colorado, Palmer Divide and over El Paso County. Wind gusts from 60 to 80 mph, with locally up to 100 mph. In addition, 1 to 3 feet of snow fell across the mountains with up to 52" at Wolf Creek Pass. Impacts:
24 hour Snowfall
Peak Wind Gusts
Radar Imagery of the Storm (courtesy of NWS Pueblo)
Photos Abandoned Cars in Arapahoe County (Courtesy of Arapahoe County Sheriff)
Abandoned Cars on Woodmen Road in El Paso County (Courtesy of KOAA)
For more information about "Bomb Cyclones" NWS Pueblo has an excellent write up at https://www.weather.gov/pub/Bombogenesis_20190313
|
|
#2 2012 WildfiresLower North Fork Fire, High Park Fire, and Waldo Canyon Fire(Click to view a direct page write-up)
Lower North Fork Fire: On Thursday, March 22nd, 2012, the Lower North Fork Prescribed Fire Project, located south of Conifer, Colorado, was ignited as part of a large scale restoration effort on Denver Water property. On Friday, March 23rd, the fire was put into monitor status. On March 26th, there was a three person crew monitoring the burn on a day that the NWS in Boulder issued a Red Flag Warning, meaning the forecast was for windy conditions and low relative humidity values. According to the after action report created by the State of Colorado, around 1:15 PM, winds carried embers outside the controlled burn site. According to the after action review "A fire weather watch for strong winds was issued at 2:09 PM on Saturday, March 24, 2012 and at 5:26 AM on March 25, 2012 was upgraded to a red flag warning for strong and gusty winds for Monday, March 26, 2012". On March 26th, the fire burned out of control as wind speeds up to 60 mph developed over the mountains. The fire eventually burned 4,410 acres took the lives of 3 people and destroyed 23 homes east of Foxton, Colorado. The fire was considered 100% contained on Monday, April 2nd, 2012. The after action review can be found here.
High Park Fire: The High Park Fire, a forest fire in the mountains west of Fort Collins in Larimer County, was caused by a lightning strike and was first detected on the morning of June 9, 2012. This fire burned over 87,415 acres in the Poudre River watershed, making it the 4th largest wildfire in Colorado state history. The fire caused one fatality and destroyed 259 homes. Of the burned land, 32,302 acres burned at a low severity; 35,399 acres at a moderate severity; and 5,714 acres at a high severity. More than 14,000 acres within the perimeter were unburned. A full overview of the BAER report can be found here. A persistent pacific jet streak caused persistent gusty conditions after the fire developed, spreading the fire easterly. The previous year's winter was below average, causing the mountains to the west of Fort Collins to be in a "D2 Severe Drought" to a "D3 Extreme Drought". There was beetle-kill trees located in the fire, which caused explosive fire behavior. The fire was considered 100% contained on June 9th, 2012.
Waldo Canyon Fire: On Saturday June 23rd, 2012 a fire was reported in the Pike National Forest, just west of Colorado Springs, just north of Highway 24 in El Paso County. The fire burned for 18 days, covering 18,247 acres, taking two lives, and destroying 347 homes and damaging others. The BAER team determined the three levels of burn severity of the Waldo Canyon Fire on the soils and watersheds to be: 41% low/unburned severity (7,586 acres); 40% moderate severity (7,286 acres); and 19% high severity (3,375 acres). The Waldo Canyon Fire resulted in $453.7 million in insurance claims, which is the second most destructive fire in Colorado state history, next to the Black Forest Fire (found at #6 on the Top 12 Events). The cause of the fire was determined to be caused by a human, but the true nature of the cause is still uncertain. The fire was considered 100% contained on July 10th, 2012. The following year, a thunderstorm developed over the Waldo Canyon Fire burn scar, resulting in catastrophic flooding over Highway 24 and into the city of Manitou Springs, Colorado.
|
|
#1 September 2013 FloodsSeptember 11th-15th, 2013(Click to view a direct page write-up)
Overview In almost unanimous fashion, topping the list of Colorado weather events in the past decade were the Floods of September 2013. Following a few days of light to moderate rains in portions of the state, the clouds unleashed torrents of rain across relatively large portions of the Front Range from the evening of September 11th through much of September 12th. A very rich, subtropical airmass situated itself over the state through much of this week, but on the evening of September 11th a weak disturbance coincided with the showers and thunderstorms. That resulted in a very slow and almost stationary area of heavy rain along the Front Range. That rainfall, heavy at times, lasted through much of September 12th, before finally decreasing late that night. A few showers and storms occurred in the days that followed, with the last bout of locally heavy rain on Sunday, September 15th.
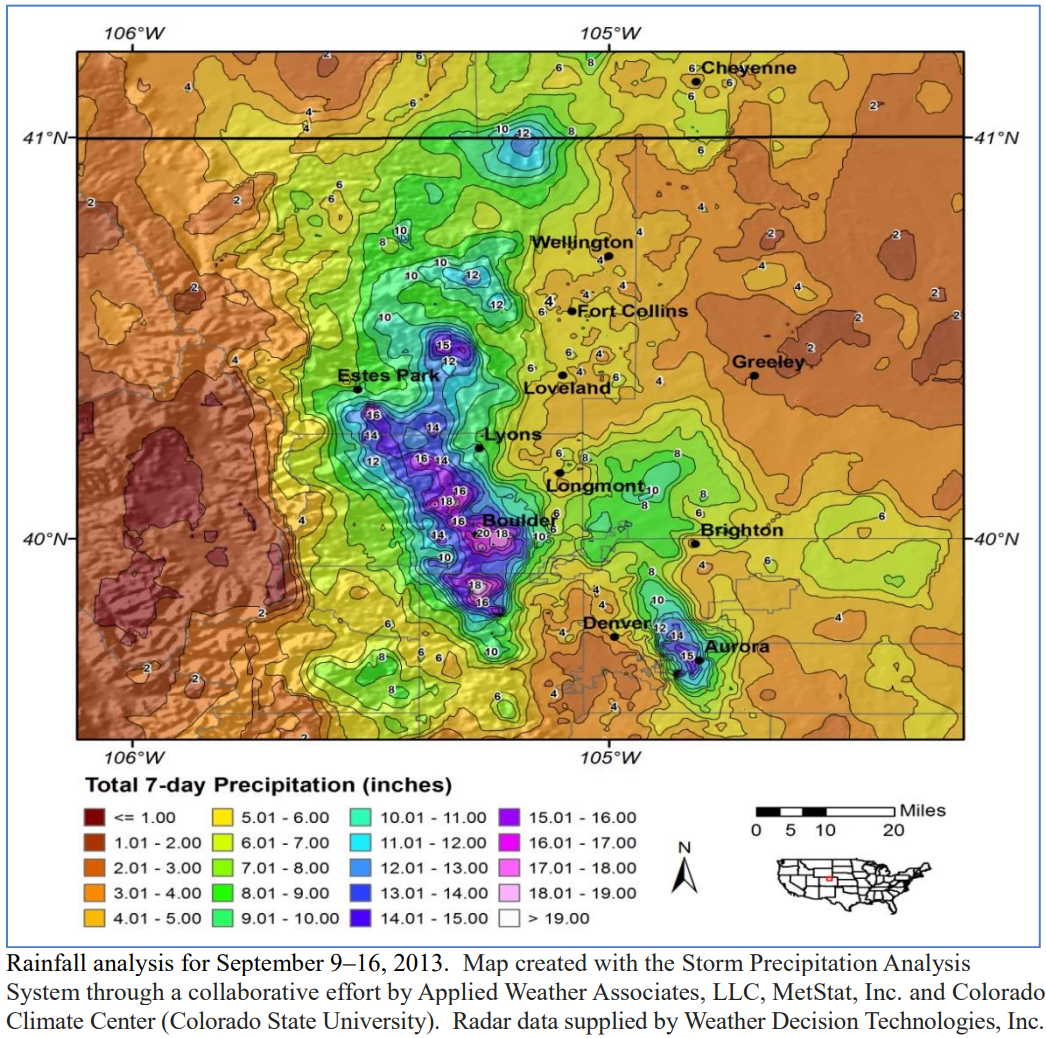
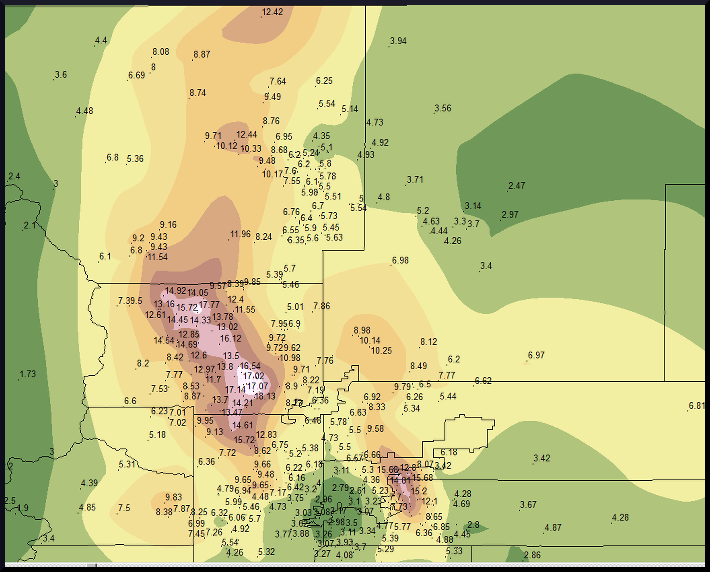
Rainfall Rainfall totals through this period reached 6 to 18 inches in many areas of the Front Range, including most of the foothills from around I-70 northward to the Wyoming border, eastern and northern sections of the Denver Metro area, and portions of Teller and El Paso county including western sections of Colorado Springs. The heaviest totals of 12 to 18 inches were widespread through much of Central Boulder County, stretching from Boulder north and west toward Jamestown, Lyons, and into Central Larimer County including the Estes Park area. The vast majority of this rain fell in about 30 hours from the 11th through the 12th. The 24 hour state precipitation record was broken in Fort Carson, Colorado, with a whopping 11.85 inches of rain falling on September 12th. Boulder set a calendar day all-time record rainfall of 9.08 inches, which shattered the previous wettest day of 4.80 inches set on July 31, 1919. Finally, a one month record of 18.16 inches in September also shattered Boulder’s previous all-time monthly record of 9.59 inches set in May of 1995.
Zoomed in Rainfall Analysis with 7 Day Amounts
Radar Loops Loop of Storm Total Rainfall
September 11 9/12
9/13 9/14 9/15
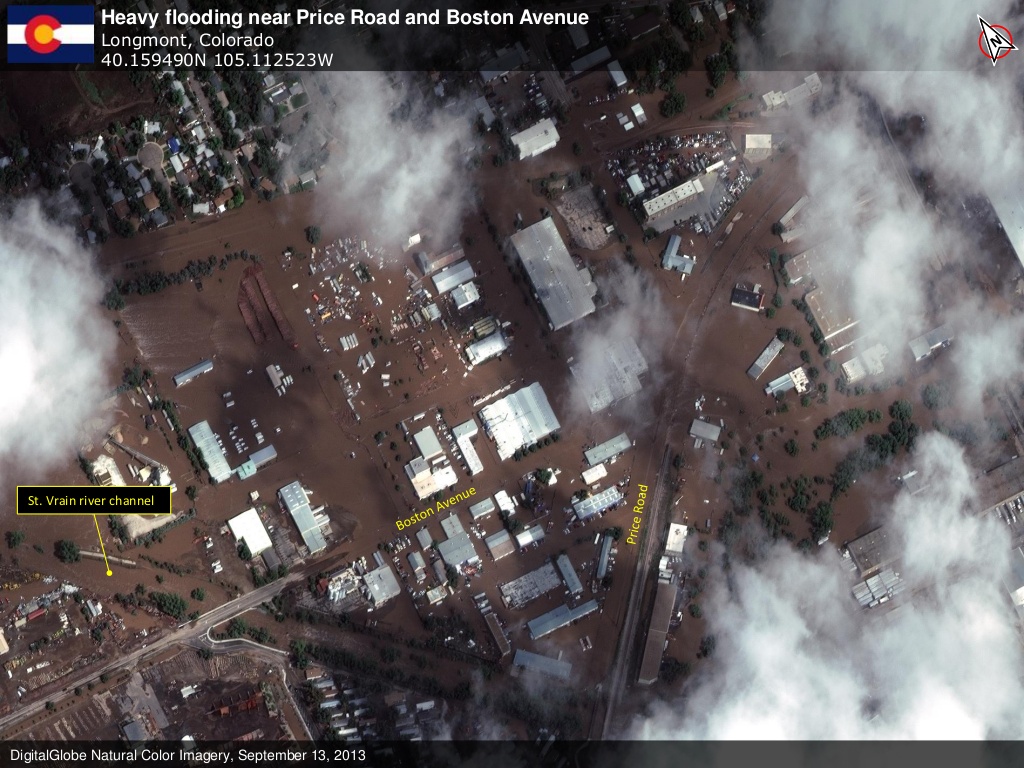
Flooding Flash flooding quickly ensued the onset of heavy rainfall, and large streams and rivers also became raging torrents as the flood waters accumulated throughout the several days of heavy rainfall. Streams and rivers that swelled well above flood stage included; Big Thompson River, Little Thompson River, Cache La Poudre River, Lefthand Creek, St Vrain Creek, Boulder Creek, South Boulder Creek, Coal Creek, Sand Creek, and Fountain Creek. Record flood levels were observed on the St. Vrain near Lyons, as well as the South Platte River at Balzac, Weldona, and Julesburg.
Satellite Imagery shows flooding along the South Platte over northeast Colorado
Pictures of Historic Flooding Lefthand Canyon in Boulder County (courtesy of Boulder Daily Camera)
Highway 36 in Big Thompson Canyon (courtesy of Loveland Reporter Herald)
Another area of Highway 36 in Big Thompson Canyon (courtesy of Loveland Reporter Herald)
Flooding in Longmont (courtesy State of Colorado and Digital Globe)
For a more detailed analysis of the event you can visit
|


.jpg)