Denver began 2018 under the influence of weak La Nina conditions which transitioned into a neutral ENSO environment (EL Nino - Southern Oscillation) by spring. The neutral ENSO environment persisted into the summer before weak El Nino conditions developed over the equatorial portion of the Pacific Ocean. In general, La Nina conditions bring drier than normal conditions to the Front Range and eastern Plains of Colorado,especially in the winter months, with near to above normal precipitation often experienced in El Nino environments.
For the weather parameters of temperature and precipitation, 2018 ended 6th driest along with a tie for 20th warmest. For the 3rd year in a row, Denver came in with below average annual precipitation while ending 2018 with a scant 8.53 inches. This is 5.77" below the normal of 14.30 inches ( NCEI 1981-2010). The last year with above average precipitation was in 2015 where a healthy 18.31 inches landed in the Denver Metro area. As for temperatures, 2018 marked the 4th year with annual temperature above average. The average annual temperature for 2018 was 52.0°F, which was 1.5°F above 147 Year average of 50.5°F. This is also or 1.5°F above the current NCEI 1981-2010 average 50.5°F.
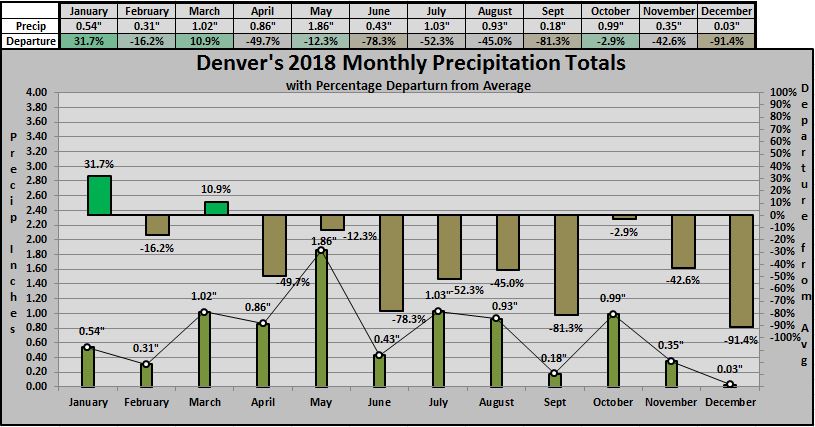
Precipitation:

Temperatures:
Dry conditions often coincide with above average temperatures, and this was certainly the case in 2018 for the high plains region including Metro Denver. Most notable were the months of May, June and September where all three landed in their respective "Top 10 Warmest Month" category. May was the 8th warmest May in Denver's 147 year history with June and September ending 7th and 6th warmest respectively.

Snowfall:
After a moist January with slightly above average precipitation, cool and unsettled conditions persisted in February bringing 6.2 inches of snow to the Denver city. March is Denver's climatological snowiest month of the year where needed moisture from snowfall is often anticipated. Although the month ended with slightly above average precipitation, it came in lower than average in the snowfall category. March 2018 brought 4.8" compared to a normal March which averages 10.7 inches. This was followed up by lower than average snowfall in April. January, February, March and April are Denver's 4th, 6th, 1st and 5th snowiest months respectively (NCEI 1981-2010 averages).

When 2018 ended, the average annual temperature for Denver finalized at 52.0 degrees, which is 1.5°F above the NCEI 1981-2010 annual average of 50.5°F. This ranks as ties for 20th warmest in Denver`s 147 Year temperature history. The warmest year in Denver`s weather History was in 1934 with an average annual temperature of 54.8°F. The coldest year was 1912 with an annual average of 47.6°F.
Denver's 146 year history of average annual temperatures from 1872 through 2018.


