
Below are data and images of Hurricane Georges as it approached and moved over parts of the Northern Gulf of America and some of its effects on the state of Alabama and the Florida Panhandle during late September of 1998.
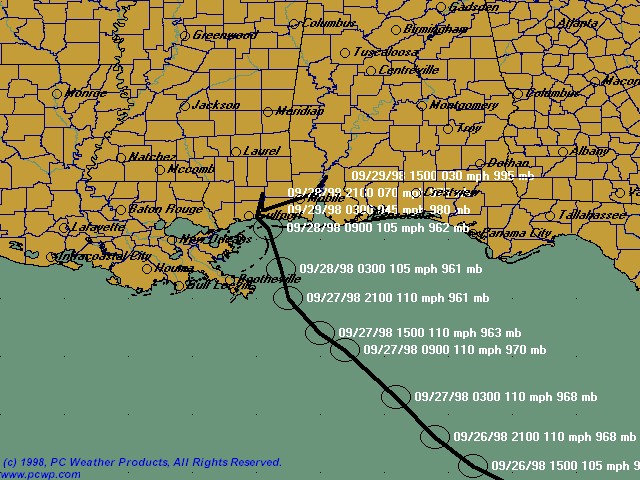
| Track of Hurricane Georges |
Images below include the gage rainfall totals and rainfall totals analysis associated with Hurricane Georges.

| Rainfall Plot associated with Hurricane Georges | Analyzed Rainfall Totals from Hurricane Georges |
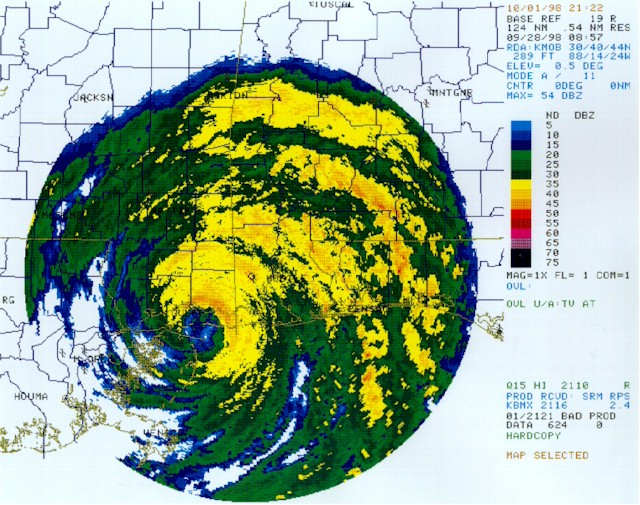
Images below include 3 groups of pictures: First, infared (IR) satellite images are overlaid with surface, buoy, and CMAN observation reports. Second, surface maps are overlaid with sea level pressure analysis. Lastly, radar display is from KMOB (Mobile, AL). All data is from just before and after landfall on Monday, September 28th.

| IR Image from 09/28/1998 at 2 AM CDT/7 UTC | IR Image from 09/28/1998 at 3 AM CDT/8 UTC |


| IR Image from 09/28/1998 at 4 AM CDT/9 UTC | IR Image from 09/28/1998 at 5 AM CDT/10 UTC |

| IR Image from 09/28/1998 at 6 AM CDT/11 UTC | IR Image from 09/28/1998 at 7 AM CDT/12 UTC |

| Surface Map from 09/28/1998 at 2 AM CDT/7 UTC | Surface Map from 09/28/1998 at 3 AM CDT/8 UTC |


| Surface Map from 09/28/1998 at 4 AM CDT/9 UTC | Surface Map from 09/28/1998 at 5 AM CDT/10 UTC |
| Surface Map from 09/28/1998 at 6 AM CDT/11 UTC | Surface Map from 09/28/1998 at 7 AM CDT/12 UTC |

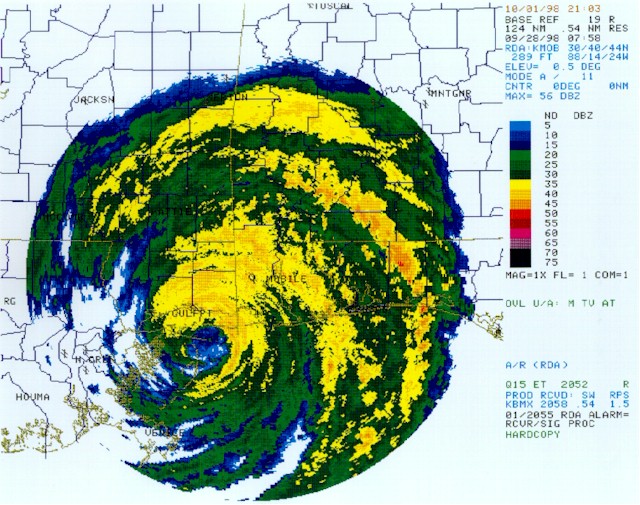
| KMOB Radar Image from 09/28/1998 at 2 AM CDT/7 UTC | KMOB Radar Image from 09/28/1998 at 3 AM CDT/8 UTC |

| KMOB Radar Image from 09/28/1998 at 4 AM CDT/9 UTC | KMOB Radar Image from 09/28/1998 at 5 AM CDT/10 UTC |
The following links are to post event reports, areal photos, and various rainfall maps from the event:

