
Tropical Depression Two is expected to gradually strengthen and could bring tropical storm conditions to the Florida Panhandle beginning late Monday. Areas of flash flooding will be possible through Thursday along the eastern and central Gulf Coast. Severe thunderstorms will develop and move along a cold front crossing the Upper Midwest Monday, and through the Ohio Valley/Mid-Atlantic on Tuesday. Read More >
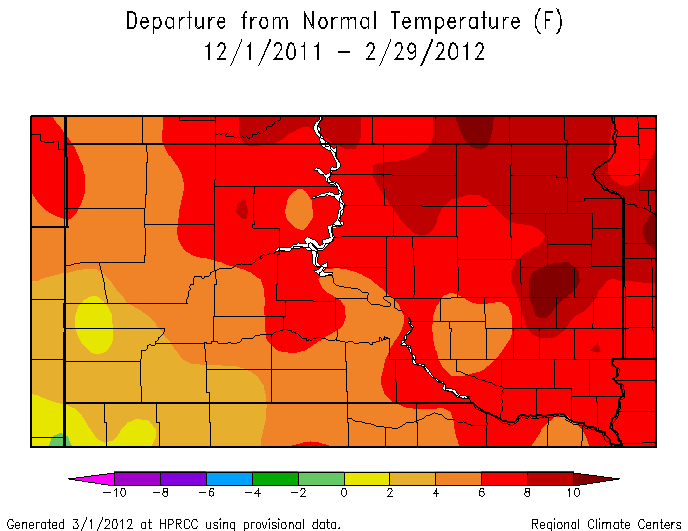
The tables below lists the warmest average temperature for the period December through February at Aberdeen, Pierre, Mobridge, and Watertown. Graphical displays for the observed temperature and departure from normal for all of South Dakota is also provided (courtesy of the High Plains Regional Climate Center).
One note is that 2012 is a leap year – such that the winter of 2011/2012 contained one more day in meteorological winter than a majority of the other years (91 days vs. 90 days). Leap year winters are annoated by an asterisk (*).
Aberdeen, SD (Normal DJF Temperature = 15.1F)
|
Rank |
Average Temperature |
Year |
|
1 |
27.6 |
1931 |
|
2 |
25.6 |
1987 |
|
3 |
25.2 |
1983 |
|
4 |
24.7 |
1992* |
|
5 |
23.1 |
2012* |
|
6 |
22.9 |
1921 |
|
7 |
22.3 |
1998 |
|
8 |
21.9 |
2002 |
|
9 |
21.6 |
1944* |
|
10 |
21.5 |
2006 |
Pierre, SD (Normal DJF Temperature = 22.0F)
|
Rank |
Average Temperature |
Year |
|
1 |
30.2 |
1992* |
|
2 |
30.0 |
1987 |
|
3 |
29.8 |
1983 |
|
4 |
29.2 |
2000 |
|
5 |
29.1 |
1998 |
|
6 |
28.4 |
1999 |
|
7 |
28.2 |
1981 |
|
8 |
27.3 |
2006, 1934 |
|
10 |
27.2 |
2002 |
|
11 |
26.9 |
2012* |
Watertown, SD (Normal DJF Temperature = 15.4F)
|
Rank |
Average Temperature |
Year |
|
1 |
25.6 |
1987 |
|
2 |
23.8 |
1992* |
|
3 |
22.7 |
1921 |
|
4 |
22.6 |
2012* |
|
5 |
22.4 |
2002, 1983 |
|
7 |
21.7 |
1998 |
|
8 |
21.3 |
2000 |
|
9 |
21.0 |
1919 |
|
10 |
20.4 |
1944* |
Mobridge, SD (Normal DJF Temperature = 18.4F)
|
Rank |
Average Temperature |
Year |
|
1 |
27.1 |
1992* |
|
2 |
26.9 |
1987 |
|
3 |
25.9 |
1983 |
|
4 |
24.4 |
2002 |
|
5 |
24.3 |
2006 |
|
6 |
24.1 |
2000* |
|
7 |
23.8 |
2012* |
|
8 |
23.5 |
1981 |
|
9 |
22.7 |
1954 |
|
10 |
21.6 |
1976* |
Figure 1: High Plains Regional Climate Center Average DJF Temperature:
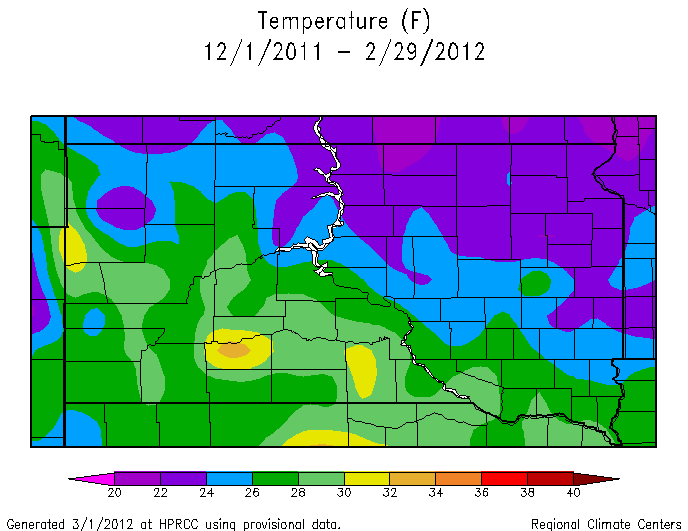
Figure 2: High Plains Regional Climate Center DJF Depature from Normal Temperature:
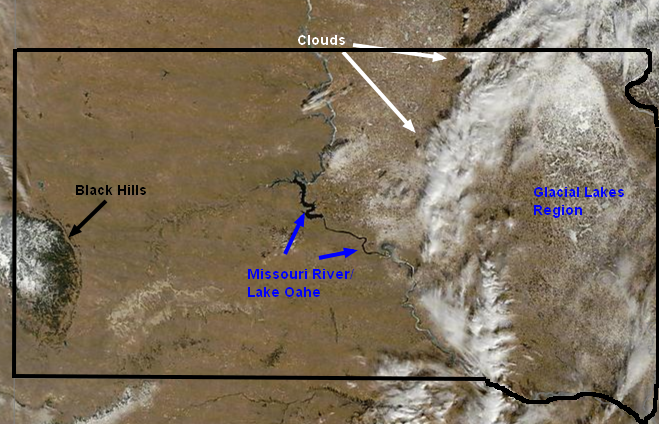
The image below is a 1000m resolution, "true color" image from the MODIS satellite valid today - 1 February 2012. A couple interesting features noted on the image are described below:
Mike Fowle - SOO

