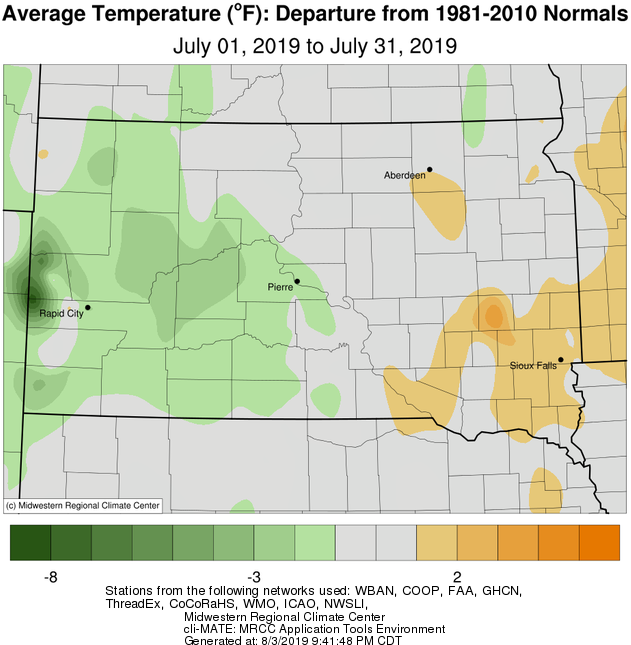
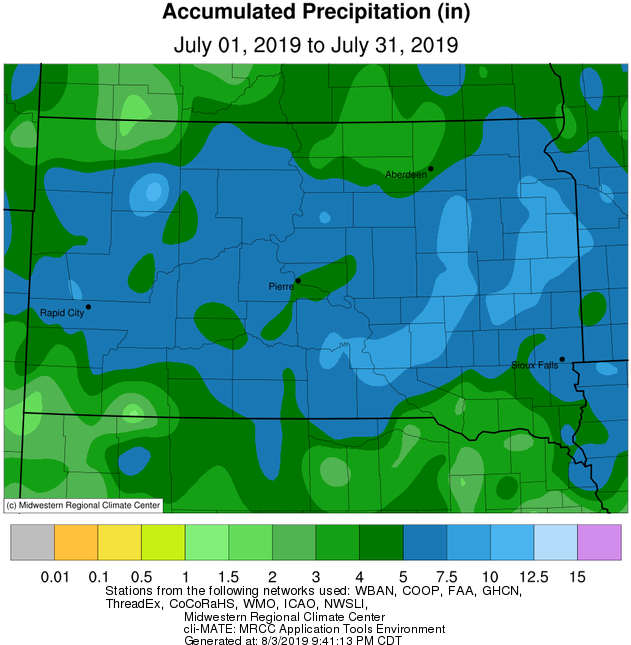
July 2019 was more-or-less typical in terms of overall temperature across the area, being generally only slightly cooler across central South Dakota and slightly warmer along and east of the James River Valley. Precipitation was a different story however – everyone experience above average rainfall. Between 4 and 6” above average for some in fact. After just the first 7 days of the month, two CoCoRaHS stations between 6 and 11 miles north/northeast of Pierre recorded over 6” of rainfall! Fortunately that pace slowed, but the month’s weather remained generally wet for most. Several record daily rainfall amounts were set throughout the month: 1.87” in Sisseton on July 4th (1.13” 1962), 1.8” in Watertown on July 1st (1.62” 1969), 1.29” in Watertown on July 9th (1.18” 1946), and 1.53” in Mobridge on July 16th (1.1” 1927). When all said and done, the following locations recorded top 10 wettest Julys on record: Timber Lake’s 5.28” ranks 4th (6.91” in 1915), Watertown’s 6.88” ranks 3rd (10.36” in 1963), Mobridge’s 5.25” ranks 2nd (5.63” in 2001), and Kennebec’s 7.62” ranks 2nd (8.89” in 1915). Where do we rank in terms of wettest year-to-date (through July 31st)? Timber Lake’s 19.3” ranks 9th (26.42” in 1915), Watertown’s 21.5” ranks 6th (24.57” in 1953), Mobridge’s 17.31” ranks 4th (20.92” in 1942), Pierre’s 20.42” ranks 4th (24.56 in 1997), and Kennebec’s 23.74” ranks 2nd (24.53” in 1915). Not surprisingly, yet amazingly, a couple area river gauge sites have yet to drop below flood stage since the ice first thawed this spring.
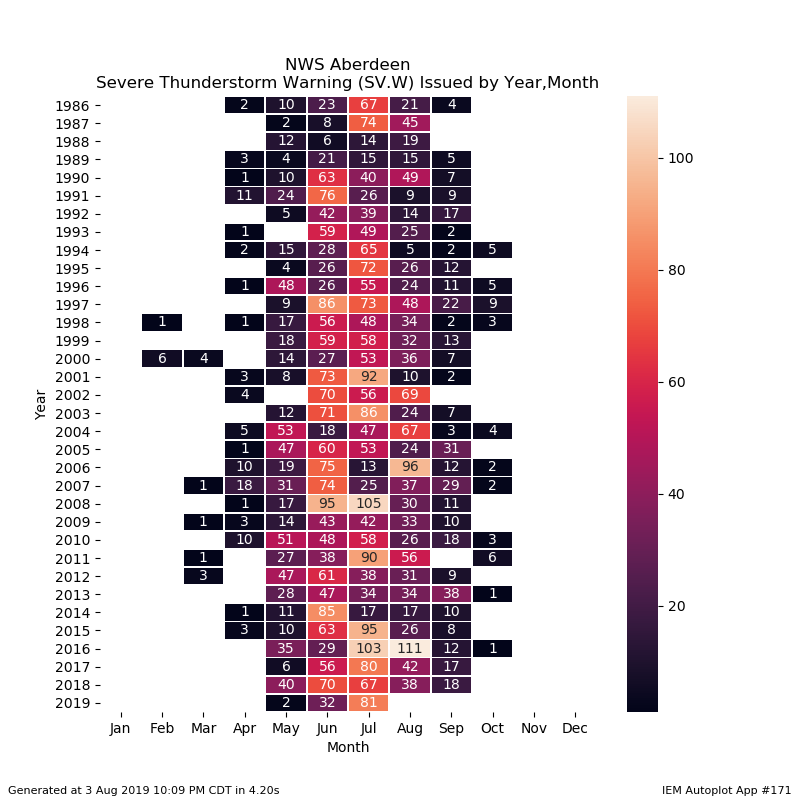
While very quiet through June, we saw a bit of an uptick in activity this July. Of note, 100+ mph wind gusts were recorded near Hayes on the evening of July 4th by two separate weather stations as a severe thunderstorm complex moved through. A long-lived storm system also produced hurricane-force (74 mph) plus wind gusts across northern South Dakota on the morning of July 19th, including in Aberdeen. For more on this event, visit https://www.weather.gov/abr/20190719_SevereWind.
|
July 2019 |
||||
|
Temperature Data |
Aberdeen |
Sisseton |
Wheaton |
Watertown |
|
Warmest Temperature / Date |
96°/ 15th |
92°/ 15th |
92°/ 15th |
90°/ 15, 18th |
|
Coldest Temperature / Date |
51°/ 30th |
48°/ 30th |
52°/ 30th |
50°/ 30th |
|
Average High / Departure from Normal |
84.2°/ +0.7° |
81.4°/ -1.5° |
81.1°/ -1.4° |
81.3°/ -1.3° |
|
Average Low / Departure from Normal |
61.9°/ +2.9° |
61.7°/ +2.2° |
63.6°/ +2.9° |
61.3°/ +1.7° |
|
Monthly Average / Departure from Normal |
73.0°/ +1.7° |
71.6°/ +0.4° |
72.2°/ +0.6° |
71.3°/ +0.2° |
|
Precipitation Data |
||||
|
Monthly Precipitation / Departure from Normal |
4.25”/ +1.23” |
4.98”/+1.40” |
3.32”/ +0.12” |
6.88”/+3.86” |
|
Most Precipitation in 24 hours / Date |
1.14”/ 19th |
1.87”/ 4th |
1.26”/ 4th |
1.80”/1st |
|
Monthly Snowfall / Departure from Normal |
N/A |
N/A |
N/A |
N/A |
|
Most Snow in 24 hours / Date |
N/A |
N/A |
N/A |
N/A |
|
Temperature Data |
Pierre |
Kennebec |
Mobridge |
Timber Lake |
|
Warmest Temperature / Date |
93°/ 13, 26th |
94°/ 14, 15th |
91°/ 14, 15th |
91°/ 14th |
|
Coldest Temperature / Date |
52°/ 22nd |
52°/ 22nd |
57°/ 27, 29th |
53°/ 20th |
|
Average High / Departure from Normal |
85.0°/ -3.8° |
86.7°/ -3.0° |
84.2°/ -1.6° |
84.7°/ -1.3° |
|
Average Low / Departure from Normal |
62.7°/ +0.8° |
63.0°/ +1.0° |
62.8°/ +3.3° |
60.6°/ +0.9° |
|
Monthly Average / Departure from Normal |
73.8°/ -1.6° |
74.9°/ -1.0° |
73.5°/ +0.9° |
72.7°/ -0.1° |
|
Precipitation Data |
||||
|
Monthly Precipitation / Departure from Normal |
4.32”/ +1.70” |
7.62”/ +5.13” |
5.25”/ +2.55” |
5.28”/ +2.66” |
|
Most Precipitation in 24 hours / Date |
1.22”/ 3rd |
2.88”/ 17th |
1.53”/ 16th |
1.64”/ 9th |
|
Monthly Snowfall / Departure from Normal |
N/A |
N/A |
N/A |
N/A |
|
Most Snow in 24 hours / Date |
N/A |
N/A |
N/A |
N/A |
Temperature (high and lows combined) departures from normal during July 2019, courtesy of the Midwestern Regional Climate Center
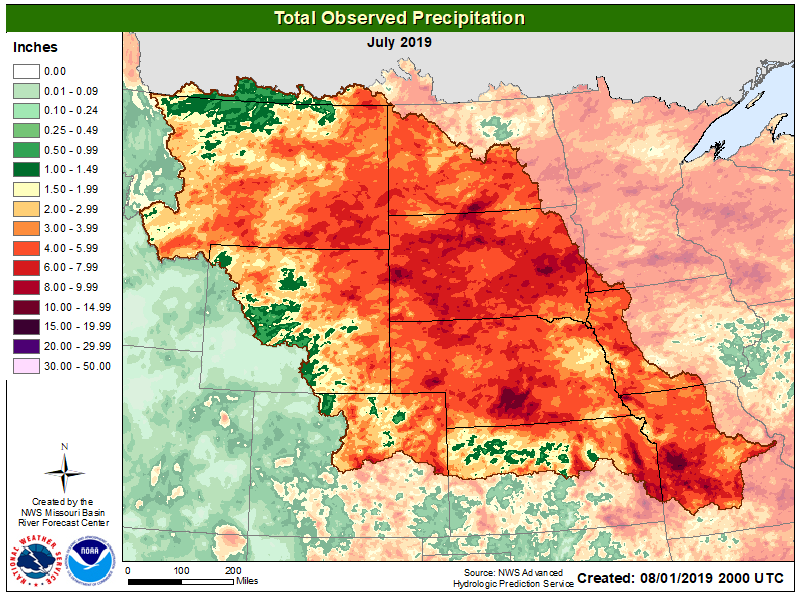
Total precipiation observed during July 2019, courtesy of the Midwestern Regional Climate Center
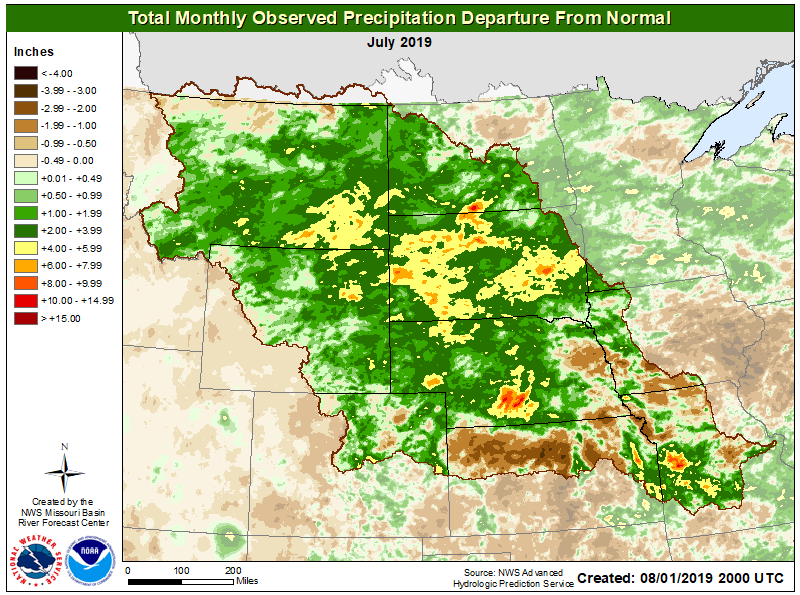
Precipiation departures from normal during July 2019, courtesy of the Midwestern Regional Climate Center
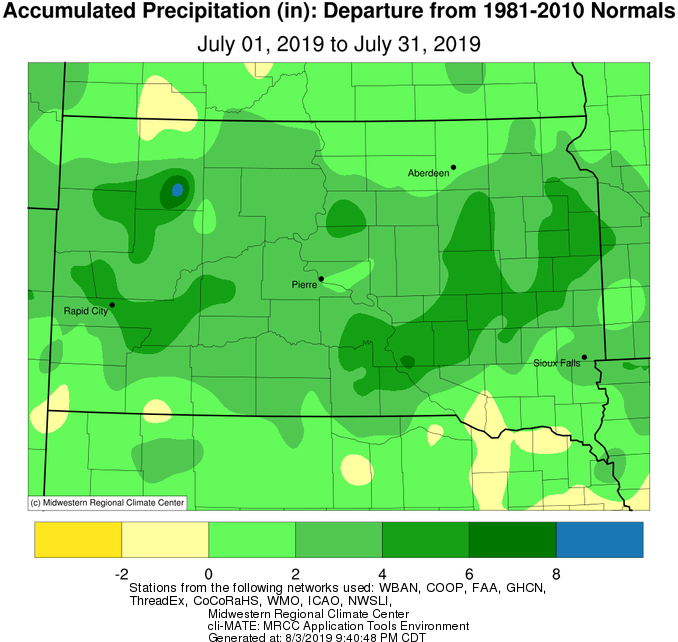
A wider view of departure from normal (right) and totals (left) precipitation across the Northern Plains during July. South Dakota was far from the only state with much above average rainfall.
Plot of number of severe weather warnings issued by the NWS in Aberdeen for 2019 and every other year since 1986, to highlight the relative severe weather inactivity so far this year. Data from the ISU Iowa Environmental Mesonet
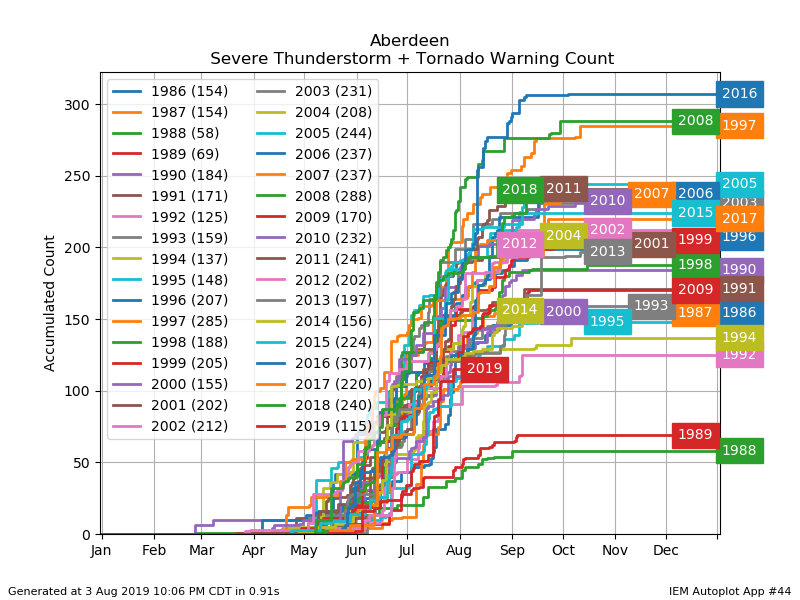
Plot of number of severe weather warnings issued by the NWS in Aberdeen for 2019 and every other year since 1986, by month, to highlight the relative severe weather inactivity so far this year. Data from the ISU Iowa Environmental Mesonet